Scintigraphic diagnostics and radionuclide therapy in nuclear medicine
| AstroNuclPhysics ® Nuclear Physics - Astrophysics - Cosmology - Philosophy | Physics and nuclear medicine |
4.
Radionuclide scintigraphy
4.1.
The essence and methods of scintigraphy.
4.2. Scintillation cameras
4.3. Tomographic scintigraphy
4.4. Gated scintigraphy
4.5. Physical parameters of scintigraphy - image
quality and phantom measurements
4.6. Relationship between scintigraphy and other
imaging methods
4.7. Mathematical analysis and computer
evaluation in nuclear medicine
4.8.
Radionuclides
and radiopharmaceuticals for scintigraphy
4.9.
Clinical
scintigraphic diagnostics in nuclear medicine
4.1. The essence and methods of scintigraphy
Radionuclides in nuclear medicine
Nuclear medicine
is a field dealing with diagnostics and therapy using open
radioactive substances - radiopharmaceuticals -
applied to the internal environment of the organism; these in
vivo methods will be addressed in this chapter. In
an in vitro test, the
radiopharmaceutical is not administered to the patient's body,
but is used in the radiochemical analysis of blood samples taken;
the patient does not come into contact with a radioactive
substance, only a sample of plasma or other body fluid is used (in vitro radioisotope methods are briefly
outlined in §3.5 "Radioisotope
tracking methods", passage "Radioimmunoassay
- radiosaturation analysis";
now they are mostly not part of nuclear medicine, but laboratory
biochemistry).
Nuclear medicine methods are based on two basic
properties of radionuclides :
1.
Emissions of
penetrating ionizing radiation during radioactive
transformations of nuclei (detailed
physical explanation in §1.2"Radioactivity") ;
2. Identical chemical behavior of isotopes Þ
radioactive isotopes react chemically in exactly the same way as
stable isotopes of the same element (§3.5
"Radioisotope tracer method") .
Radioactive atoms and their
molecules - compounds "labeled" with radioactive
elements - are distributed in the body as if they were
non-radioactive, but penetrating radiation is continuously
emitted during the radioactive transformation of the respective
nuclei. This radiation allows them to be "made visible"
- to monitor, indicate, "trace" *) - and measure their
amount by detection devices during diagnosis, or
the radiobiological effects this radiation can be used for therapeutic
purposes.
*) Hence the general name of an indicators
or tracers methods, that are used not only with
the help of radionuclides and not only in medicine, but also in
laboratory and industrial applications (§3.5
"Radioisotope tracking methods") .
Scintigraphic diagnostics and radionuclide
therapy in nuclear medicine
The central method of nuclear medicine is radioisotope
diagnostics in vivo: we apply a suitable (bio)chemical
substance with a bound radionuclide - the so-called radioindicator
or radiopharmaceutical - to the organism. This
substance enters the metabolism and is distributed
in the body according to its chemical composition - pharmacokinetics
- of the given radioindicator. Physiologically or pathologically,
it accumulates in certain tissues and organs, regroups and is
subsequently excreted. The chemical composition of a
radiopharmaceuticals determines its incorporation into kinetic or
certain metabolic processes - targeted input (targeting)
into relevant tissues, organs, cells or sub-cellular elements,
including subsequent excretion. The built-in radionuclide then
allows either external detection and imaging of the
distribution of this substance (by gamma radiation in
scintigraphy), or monitoring of its amount in samples
taken (biological fluids, mostly blood or
urine) - specific methods of these
examination methods are described in detail below in the section
"Clinical
scintigraphic diagnostics in nuclear medicine".
In the case of therapy,
the radiation of the radionuclide performs biological
effects on the cells of the tissue in which the
radiopharmaceutical accumulates (eg it
destroys tumor cells - §6.6 "Radiotherapy",
part "Radioisotope therapy").
Radioindicators
in nuclear medicine are applied in a small trace amount,
about 10-9
-10-12
grams (pico- or nanomolar concentrations in
tissues), so they themselves can
not (bio)chemically affect the function of the examined
organs, nor can they cause some side or toxic effects to the
organism *). They can only cause radiation exposure,
which we try to minimize by optimizing the applied activities.
*) The only exception to
this biochemical safety are radiopharmaceuticals based on murine
monoclonal antibodies. In a small percentage of
patients, they may experience allergic reactions
due to the presence of so-called HAMA antibodies (discussed below in the section "Radionuclides
and radiopharmaceuticals for scintigraphy").
The best known
example is the application of radioactive sodium iodide NaI131, which, like any
iodine, is taken up (accumulated) in the thyroid gland. By
external detection of gamma radiation emitted during radioactive b- transformations
of 131I
nuclei, it is then possible to measure the accumulation of this
iodine or to display its distribution in the thyroid gland - §4.9.1 "Thyrological
radioisotope diagnostics"; if desired, radiation b may have biological effects
on the cells used in therapy, when higher activities are applied.
A number of types of radiopharmaceuticals
with affinity for the kidney, liver, bone, myocardium, some tumor
or inflammatory tissues, signaling receptors have been developed,
for the function of which the given substance is an indicator
(§4.8 "Radionuclides and
radiopharmaceuticals for scintigraphy"). The degree of local
accumulation of radiopharmaceuticals depends on the intensity of
local metabolic and functional processes in organs and tissues.
Using scintigraphic imaging, possible malfunctions can be
located, analyzed and possibly quantified.
Or the radionuclide is injected into the
bloodstream and the dynamics of its passage
trough the heart, lungs and large vessels is monitored - in this
case without metabolic binding to a specific organ or tissue (§4.9.4, part "Dynamic radiocardiography" and "Radionuclide
gated ventriculography",
or §4.9.8, part "Perfusion scintigraphy of the brain"); again with the
possibility of analysis and quantification.
"Molecular
imaging"
With the development of organic chemistry,
biochemistry and cell biology, some radiopharmaceuticals have
been developed whose labeled molecules have affinity for very
specific cell types or processes at the subcellular level. With
the help of scintigraphy and a suitable radiopharmaceutical, it
is possible to purposefully examine not only the function of a
certain organ or tissue, but also to selectively recognize a
certain type of metabolic and transport pathway, such as enzyme
or receptor binding or antigen-antibody reactions. For this
purpose, special radiopharmaceuticals (both for diagnostics and
for therapy) have been developed and are still being developed,
which are characterized by their effects at the molecular
level. With a bit of exaggeration, these methods of
local measurement and imaging of the physiological response are
referred to as "in vivo biochemistry".
Note: Of course, the name "molecular
imaging" does not mean that we are imaging the
molecules themselves (unfortunately, we cannot do that..), but we
are depicting a distribution of the radioindicator that is a
consequence and reflection of specific biochemical
reactions at the molecular level.
Scintigraphy
The passage and distribution of a radioindicator thus reflects
the specific physiological or pathological condition
or function of the relevant organs and tissues.
For its assessment in the simplest cases, it is sufficient to
simply measure the intensity of radiation g emanating from a
certain place (eg from the thyroid gland -
to determine its accumulation) by a collimated detection probe. For
better and more comprehensive diagnostics, however, we need to
measure - map out - display - the entire distribution
of the radio indicator, including local details and
anomalies. An important method called scintigraphy
or gammagraphy is used for this :
| Scintigraphy : |
| Scintigraphy or gammagraphy is a physical-electronic method of imaging the distribution of a radioindicator in an organism based on external detection of outgoing gamma radiation |
Terminological note:
The more apt name of gammagraphy
- gamma-ray imaging - is unfortunately used relatively rarely;
predominant the less accurate name of scintigraphy,
came from the fact, that scintillation detectors are now
technically used here. In the future, scintillation detectors are
likely to be replaced by semiconductor detectors
(see below "Alternative
physical and technical principles of gamma cameras"), whereby the name
"scintigraphy" already lost its justification. Out of
inertia, however, name scintigraphy will undoubtedly
persist.
Scintigraphy or scintigraphic examination
is often also called a scintigraphic study in
the "jargon" of nuclear medicine. It dates back to the
days, when scintigraphy was a new experimental research
method to study physiological
processes in the body.
In most of the
text of this chapter (§4.1-4.8) we will deal with the physical
principles of scintigraphic imaging and technical
solutions of devices for gammagraphic imaging. The clinical
use of scintigraphy in nuclear medicine is summarized in the last
§4.9 "Clinical
scintigraphic diagnostics in nuclear medicine". And the therapeutic use of
radionuclides is discussed in §3.6 "Radiotherapy",
part "Radioisotope therapy".
Types of scintigraphy
Before we deal with specific physical-electronic methods for the
implementation of scintigraphic imaging, we will briefly
introduce the division (classification,
categorization) of scintigraphic methods. In terms of time,
scintigraphy can be divided into two types :
In terms of spatial-geometric, we can divide scintigraphy again into two categories :
In terms of complexity and interpretation of scintigraphic examination, we can distinguish two basic categories :
Radiation
exposure at scintigraphic examination
At each interaction of ionizing radiation with an organism, some
of this radiation is absorbed in the tissues and causes radiation
exposure; at diagnostic applications (small) risk of
unwanted stochastic effects. There is a significant difference
between x-ray diagnostics and nuclear medicine in the laws of
radiation exposure. During an X-ray examination, the
source of ionizing radiation is the device (X-ray tube located
outside the patient's body) and the radiation dose depends, among
other things, on on the number of images taken, exposure times or
the extent of the area scanned during CT (§3.3,
passage "Radiation load of patients
during X-ray examination"). In scintigraphy, the source of radiation is
not the diagnostic device, but the patient himself resp.
radionuclide distributed inside his body in the investigated
tissues and organs. We can then take any number of scintigraphic
images, in different projections, with different acquisition
times, without changing the patient's radiation exposure.
The radiation dose received by the
patient in connection with the scintigraphic examination is already
given when the radiopharmaceutical is administered
into the body. It depends mainly on the value of the applied
activity [MBq] - direct proportionality. It also
significantly depends on the type of applied
radiopharmaceutical. The chemical form
determines the degre and rate of accumulation of the
radiopharmaceutical in various tissues and organs and the rate of
its excretion. The radionuclide used for
labeling determines the half-life of the radioactive
transformation and the type of radiation emitted. In the case of
pure gamma-radionuclides (such as 99mTc), the radiation burden is relatively low, since most
of the penetrating g radiation passes through the tissue and
carries its energy outward. However, with scintigraphy itself,
the magnitude of the patient's radiation exposure does
not depend on the acquisition time at all. The patient
is continuously exposed to low levels of radiation (with a decreasing dose rate) even
after leaving the nuclear medicine facility - during a subsequent
stay at another healthcare facility or at home... The time during
which radioactivity practically disappears from
the body depends on the physical half-life of the radionuclide
and the biological excretion half-life of the
radiopharmaceutical; for radioindicators marked with 99mTc (approx 100-300 MBq), it usually
takes about 2-3 days.
In summary, issues of radiation exposure
are discussed in §5.7 "Radiation
load during radiation diagnosis and therapy".
Basic
principles of scintigraphic imaging
How to achieve gammagraphic imaging ?
An idea might arise to use photography for this:
Radiation g is an electromagnetic wave of the same physical nature
as light. If we want to display an object using light (reflected
or actively emitted), we use the laws of geometric optics
and use a focusing lens to project an image of the
object on a sensitive photographic layer and expose it for some
time - a photochemical reaction creates a latent image, which
after development becomes a visible image of different densities
of silver grains in the photographic emulsion - see Fig.4.1.1 on
the left.
Fig.4.1.1. Comparison of photographic imaging options in visible
light and in gamma radiation.
It would be very pleasant if the patient could
be "photographed" in this way in g radiation - Fig.4.1.1 in
the middle. Unfortunately, this is not possible! Radiation g will not refract
like light when it strikes the lens. As shown in §1.3, radiation
g interact
with each substance, and thus also with the material of the
optical lens, in three ways :
1. Photoeffect- here the incoming photon
ceases to exist and therefore will not arrive to the sensitive
layer at all - it is not usable
for imaging.
2. Compton scattering
- here would be some scattered photons g could strike the sensitive
layer and elicit a photochemical reaction there, but the
scattering angle is essentially random and always different,
regardless of the angle of incidence. Compton-scattered radiation
thus produces no image, but only a more or less monotonous
graying or blackening of the film. Thus, even Compton scattering
is not applicable for photographic imaging in gamma radiation *).
*) However, this statement is not
completely absolute, it only applies to photographic images. At
the end of §4.2 it will be shown that Compton scattering of
radiation g can in principle be used for electronic
collimation in so far experimental so-called Compton
cameras .
3. Formation of e- e+
-pairs (if the primary radiation g had energy >> 1MeV) -
here the primary photon g disappears and the secondary photons of annihilation
radiation always fly in opposite directions *), but each time at
a different angle in space - unusable similarly
to Compton scattering.
*) This property is used for
electronic collimation in positron emission tomography
(PET) - see §4.3, section "Positron emission tomography PET".
We would reach the same conclusions
if we tried to use a hollow mirror instead of a lens to
display it in g radiation. Only the simplest imaging using the pinhole
camera in Fig.4.4.1 on the right, also works for
gamma radiation, it is used in pinhole type
collimators (they are described below in
the section "Scintigraphic collimators").
For radiation g therefore does not
apply the laws of refraction and reflection => there is no refractive or reflective
optics for radiation g
! We are not able to purposefully influence
the direction of movement g -radiation photons *). Only for soft X-rays, under
certain circumstances, reflective mirror optics
partially work, but only for very small angles of
incidence-reflection - see the appendix
"X-ray telescopes" at the end of §3.2.
*) Physically conceived, only strong gravity can
influence the direction of motion of photons g (due to its
universality). Although such gravitational lenses
of gigantic dimensions are abundant in universe (see §4.3, passage "Gravitational
lenses. Optics of black holes ."
in the monograph "Gravity, black holes and space-time physics"), they are not feasible in
laboratory conditions on Earth; even if we could make miniature
black holes with the required properties, the quality of
their images would not be very good and, most importantly, they
would immediately kill us with their
gravity and quantum radiation (§4.7
"Quantum radiation and thermodynamics of black holes" in the same book).
The only way
to achieve an imaging in g-radiation is collimation - shielding g radiation from
all unwanted directions and releasing only radiation from the
required direction. This creates a collimation projection
in gamma radiation. In this way, most scintigraphy methods
"works" with g radiation - see "Scintigraphic
collimators" below.
Exceptions are special methods using so-called electronic
collimation by means of coincidence detection of two or
more primary or secondary photons. These principles are used
mainly in Positron emission tomography,
or for so far experimental Compton cameras (see section "Compton
cameras" and "High
energy gamma cameras")
or Compton telescopes in
astrophysics - some "telescopes without lenses and
mirrors"...
Motion
scintigraph
Historically, the first type of instrument to perform
scintigraphic imaging of the radioactivity distribution was a
motion scintigraph, sometimes called a scanner.
The first device of this kind was built in 1951 by B.Cassen and
his colleagues, their main manufacturer in the 60s and 70s was
the company Picker (Fig.4.1.2
right). It is in principle a simple device,
schematically shown in Fig.4.1.2 :
Fig.4.1.2. Motion scintigraph.
Left: Principle diagram of the movement scintigraph
(bottom middle is an example of a thyroid
scintigram) . Right:
Scintigraph Picker 500i at KNM Ostrava.
A collimated scintillation detector
*) is mounted at one end and an electromagnetic pen
at the other end on a common massive arm moved
by an electric motor. The detector shifts with a
uniform meandering motion over the measurement object W,
the radiation g (which is detected only from the area just below the
collimator on its axis) is converted into electrical pulses,
which (after amplification and amplitude
discrimination, possibly reducing excessive frequency) are lead to electromagnetic coil. For each pulse, a
ferromagnetic core is ejected from the solenoid coil, provided at
the end with a pen (stamp), which prints a mark (comma)
on the paper over the ink ribbon. Each comma represents,
depending on the reduction setting, a hundred or a thousand
pulses or the like. The higher the radioactivity of the place
above which the collimated probe is located, the higher the
frequency of pulses the probe will send to the solenoid coil and
the denser the pen will type the commas of the image as it moves
over the paper. The result is a display of the invisible
distribution of the radioindicator using the visible density
of commas on the paper (Fig.4.1.2 in the middle) - a
scintigraphic image W* is created. In addition to paper, some instruments
also recorded scintigrams on photographic film,
which made it possible to better distinguish details in density
of the commas - the frequency of pulses.
*) To increase the detection efficiency,
relatively large scintillation crystals with a diameter of up to
15 cm, equipped with multi-hole focused collimators,
were used. Thus, radiation g from the focus at the investigated site, from a relatively
large spatial angle was concentrated on the surface of the
crystal.
The advantage of the motion
scintigraph was simplicity and perhaps also the
fact that it provided an image in a 1:1 scale. However, it had
some major disadvantages. In the first place, it
is a very low measurement efficiency: only a
small part of the g photons is always detected only from the place above
which the detection probe is currently located - radiation from
all other places escapes uselessly. Furthermore, the probe moves
relatively slowly over the patient and takes a long time to scan
the scintigraphic image. If the distribution of the
radioindicator changes with time during the measurement, we are
not able to capture and display these changes - the motion
scintigraph does not allow dynamic scintigraphy.
For these reasons, movement scintigraphs have not
been used since about the end of the 1980s (they
lasted the longest for thyroid scintigraphy, Fig. 4.2.1 in the
middle of the bottom) - then they were
completely replaced by scintillation gamma cameras.
4.2. Scintillation gamma cameras
| A scintillation camera is a device that detects photons of radiation g simultaneously from the entire field of view, converts them into electrical impulses and then uses them to create a scintigraphic image of the distribution of the radioindicator in this field of view. |
The
principle of the scintillation camera
Scintillation cameras, or gamma cameras,
are so far the most perfect devices for
scintigraphic imaging of radioactivity distribution. It is a very
complex device both in its principle and in its technical
construction.
The first
scintillation camera was constructed by H.O.Anger in 1958. In the
initial experiments, he used a single-hole collimator and the
scintillation in a thin crystal of larger diameter exposed to a
photographic plate. He achieved a striking improvement by
attaching photomultipliers (originally 7 photomultipliers) to the
crystal, which sensed flashes in the scintillation crystal and
converted them into electrical pulses that were electronically
evaluated. The first scintillation cameras with 19
photomultipliers began producing company Nuclear Chicago
in 1964, soon to be Picker (a leading manufacturer of
motion scintigraphs); later in Europe Intertechnique,
Philips, Gamma, in Japan Toshiba.
The schematic
diagram of Anger's scintillation camera is shown
in Fig.4.2.1 :

Fig.4.2.1. Schematic diagram of a
scintillation camera (analog).
Note: For
clarity, only two photomultipliers F1 and F2 are shown. In fact,
there are a larger number of photomultipliers - min. 19 (for
older cameras with a smaller field of view), 32, 64 and more.
Detection
of radiation g and determination of the place of
its origin
Let's consider a (model) investigated object W,
in which there are three localized deposits A, B,
C of increased concentration of g- radioindicator.
From each place of deposition of radioactivity, radiation g is emitted
isotropically on all sides, which, due to its penetration, emanates from the object W
out. In order for this radiation g to be able to create an
image, a collimation projection must first be
performed. We achieve this by putting a lead plate
in the path of the emitted radiation g, drilled with a large
number of small parallel holes. Only those photons g,
that move exactly in the direction of the
axis of the holes, can pass through this collimator.
Other photons that go "obliquely" are absorbed on the
lead partitions between the holes. The collimator thus creates a planar
projection of the radio indicator distribution into the
blue marked plane in Fig.4.2.1. A thin
large-area scintillation crystal is placed here. Each
photon of radiation g that passes through the collimator causes a
scintillation flash of a large number of photons of (visible)
light in the crystal. Scintillations from crystal are sensed and
converted into electrical pulses by a system of
photomultipliers, optically adhered to the crystal *).
For simplicity, only two photomultipliers are drawn in Fig.4.2.1
- F1 and F2.
*) The general principle of scintillation detectors
and photomultipliers, their properties and construction are
discussed in detail in §2.4 "Scintilltion
detectors".
Let us now observe the
"fate" of the individual photons g emitted from the
interior of the object W under investigation. In particular, any photon g' that flies in a
direction other than exactly perpendicular to the collimator face
(i.e., parallel to the orifice axes) is absorbed
at the partitions between the collimator orifices, does
not fall on the crystal, and is not detected.
The photon gA, which flies in the
"right direction" from position A,
passes through the collimator opening and causes at position A´
in the crystal a scintillation, whose photons
propagate in all directions in the crystal. A photomultiplier F1, which is close
to the site A´ of scintillation, will receive a
relatively large number of photons from this flash, so that the
pulse at its output will have a high amplitude, while the distant
photomultiplier F2 will receive only a small
portion of these photons and its pulse will be very low. For the
photon gB from position B,
scintillation occurs approximately midway between the
photomultipliers F1 and F2, so
that the amplitude of their pulses will be approximately the
same. For photon gC (radiated from deposit C),
which impact to the crystal and causes scintillation near the
photomultiplier F2, the photomultiplier F2
will receive much more light than the photomultiplier F1,
and this will also be the ratio of the amplitude of their pulses.
In general, most light enters the
photomultiplier, which is closest *) to the
flash point (the point of interaction of
the photon g with the crystal) - therefore a
pulse is generated at its output, the amplitude of which is larger
than the amplitude of pulses from more distant photomultipliers,
whose phocathodes receive less light from a given flash. The
localization of the flash positions is thus performed by a kind
of electronic-geometric "triangulation", is
determined as the "center of gravity" of the signals
from the photomultipliers.
*) The photomultiplier receives the largest
portion of light when scintillation occurs directly below the
center of the photocathode. From scintillations at more distant
locations, fewer photons will fall on the photocathode, so the
output signal has a lower amplitude.
Thus, we see that by
comparing the amplitudes of the pulses from the
individual photomultipliers, it is possible to calculate
the position of the scintillation in the crystal, and
thus the place in the patient's body, from which
the photon g was emitted. Pulses from individual photomultipliers (of
which there are a larger number - e.g.16 (for
older cameras with a smaller crystal), 32,
64 and more), are led to an electrical circuit called a comparator
(based on a resistive matrix), where the pulse amplitudes are compared and the
resulting X and Y coordinate pulses are
generated - these already carry direct information about the position
of scintillation in the crystal, and thus also about the
position of the place in the organism from which
the respective gamma photon was emitted. After amplification,
these X and Y pulses are fed to
the deflection plates of the oscilloscope screen, where
they determine the position of the flash on the screen (this was the case with older analog gamma
cameras used in the 1960s and 1970s).
Amplitude
analyzer
In addition to coordinate analysis, pulses from all
photomultipliers are fed to the summing circuit
- from the point of view of this circuit, the whole scintillation
camera behaves as one large scintillation detector of radiation g. These summation
pulses, the amplitude of which is proportional to the
energy of the absorbed radiation g, are then sent to an amplitude
analyzer *) (pulse selector according
to amplitude) - for each flash is thus
determined not only its position (coordinate
pulses X, Y), but also the energy of the photon g, which this flash
caused. The analyzer window is set so as to
transmit only pulses corresponding to the photopeak
- total absorption of radiation g in the crystal. If the
radionuclide used has more radiation energies g, the window is
usually set to the "main" (strongest) photopeak, or
measurements in multiple windows set to individual
photopeaks shall be used.
*) The principle and role of the amplitude
analyzer in radiation spectrometry is described in §2.4 "Scintillation
detectors".
For correct radiometric
measurements on each spectrometric instrument, the basic
condition is to set the analyzer window to the photopeak of the gamma radiation of the used
radionuclide. In the case of a scintillation camera, in addition
to the detection efficiency, the correct adjustment of the
analyzer window is necessary to suppress Compton scattered
radiation and to ensure the alignment of the photomultipliers to
achieve good field of view homogeneity (see below passage "Adverse
effects with scintigraphy and their correction", part "Compton scattering g).
In older types of gamma cameras, the
analyzer window was set to photopeak manually, with modern
digital cameras is implemented automatic setup
and tuning window analyzer - called Peaking or Auto
Peak (automatic tuning peak). By comparing the
frequency of pulses in the lower and upper half of the window,
this window analyzer is automatically tunes to the center
of photopeak (see figure) :

Formation
of analog scintigraphic image
The pulses behind the amplitude analyzer, called Z
(have nothing to do with the third
dimension coordinate!) are uniform
"trigger pulses" - they say: "Yes, a 'correct' g photon has now
been registered and the X and Y coordinate pulses are
valid". The Z pulses are fed to the grid of
the oscilloscope screen; here it cancels the negative bias for a
moment, causing the cloud of electrons to emerge from the
cathode, focusing and accelerating in the "electron
cannon" and flying towards the screen screen. In the
meantime, the X and Y
coordinate pulses have already appeared on the accelerating
plates, whereby the electron beam is deflected in the appropriate
direction and falls into the appropriate place (A*,
B*, C* - depending on point
where the photon g is emitted - A, B or C)
of the oscilloscope screen, where it emits a flash of
light. As the flashes gradually come to the screen as if
they were "raining" there, these analog images are
sometimes called "images with rain".
In this way, the invisible
distribution of the radioindicator in the examined
object W, via physical-electronic detection of
invisible gamma radiation, is displayed in the form of a density
of visible flashes in the corresponding places of the
screen - a scintigraphic image W* is created.
Radioactive structures (lesions) A, B, C in the examined object
are displayed as sites A*, B*,
C* with increased number of flashes on the
screen.
The described scintillation camera according to Fig.4.2.1 provides analog scintigraphic images on the oscilloscope screen. This image is present here only for the duration of the photon g scan by the gamma camera, after end of the scanning ("patient departure") this image disappears. To preserve this image, it was photographed from the screen with a camera, whose shutter was open while the pulses were being stored. The so-called persistent oscilloscope was also often used, on the screen of which the flashes did not disappear immediately, but remained here for an adjustable time and only then gradually faded until they disappeared.
Digital
scintigraphic images
The above-described photographic method of recording (analog)
scintigraphic images has the disadvantage, that it cannot be
post-edited (need intensifying dark underexposed areas and
weakening bright overexposed places) and, most importantly, it cannot
be quantified. Therefore, with the development of
desktop minicomputers in the 1960s, there was an effort to
supplement (and later replace) oscilloscopic imaging of analog
scintigraphic images by digitizing them and storing this
images into the computer memory. The scheme of operation
of such a gamma camera equipped with an acquisition
computer is shown in Fig.4.2.3 :

Fig.4.2.3. Creation of a digital
scintigraphic image by AD-conversion of analog X, Y coordinate
pulses, their storage in the image matrix of the computer memory
and display on the monitor screen.
The scintillation camera itself and the
relevant electronic circuits for amplification, comparison,
summation and amplitude analysis of pulses are identical as in
Fig.4.2.2. Only the oscilloscope screen in the right part is
replaced by a special circuit - the so-called analog-to-digital
converter ADC (Analog-to-
Digital Converter) and computer memory. The actual
conversion process is started by the trigger pulse Z,
which indicates that a valid photon of radiation g has been detected.
The amplitudes of the X and Y coordinate pulses are then
converted by the ADC converter into digital (numerical)
information - a bit combination - and sent to the corresponding
cell address in the computer. A certain sequence of cells
is set aside in the computer's memory to write these digitized
pulses; these cells are software-arranged into a so-called image
matrix - it is usually 64x64, 128x128, 256x256 cells (exceptionally also
512x512
cells; for cameras with a rectangular field, then neither the
image matrix is not square). Each cell in the image matrix topographically
corresponding to a specific location in the displayed
object W . The field of view of the gamma camera is thus divided
by a grid into small squares - pixels (picture element), which
correspond to individual addresses in a defined part of the
acquisition computer's memory.
Before the start of the acquisition,
the contents of all cells are reset. If a digitized pulse arrives
at a cell from the ADC converter, its content is
increased by 1. Thus, photons of radiation g, converted into
electrical pulses and digitized, gradually populate the cells in
the image matrix of the computer memory, according to the place
of the radiation emission, with ever-increasing values of their
content - a digital scintigraphic image formed
by the numerical content of the image matrix cells
in the computer memory. The numerical content of each of these
memory cells (pixels) is directly proportional
to the radioactivity corresponding site in the organism,
resp. its columnar projections from the entire depth of the
displayed area. The image matrix from the computer's memory is
then electronically displayed
("mapped") on the computer monitor screen.
FRAME mode, LIST mode
The above described method of cumulative explicit recording the
scintigraphic image into memory is called a frame mode ("image method "). For special purposes (for phase dynamic studies and
iterative tomographic methods - §4.3, part
"Computer
reconstruction of SPECT",
"Reconstruction of
PET images ", "TOF - time localization of the annihilation
site") is sometimes used so called list mode
("list method "), where only a list of X and Y
coordinate values of successive incoming pulses (together with time stamps) is
sequentially loaded into memory and the own images are created
additionally only after the acquisition is completed.
Digital
scintillation cameras
With the development of electronics, especially the construction
of fast and miniaturized ADC-converters and microprocessors, the
digitization of the scintigraphic signal is no longer limited to
the conversion of "finished" analog X, Y coordinate
pulses according to Fig.4.2.3. With current so-called digital
gamma cameras, each photomultiplier
already has its own analog-to-digital ADC converter
at its output. The calculation of the coordinates of
scintillation in the crystal is not performed in an analog
comparator, but in a digital microprocessor, which already
directly "populates" the respective addresses
in the computer's image matrix with the relevant numerical
information. In addition, the gain of the preamplifier of each
photomultiplier via a DAC converter is controlled directly from
the computer, which allows more accurate and operative calibration
of the camera - adjustment (tuning) and setting of
appropriate corrections for homogeneity and linearity.
Construction arrangement of scintillation
cameras
Gamma camera
detector
A large-area scintillation crystal
of a gamma camera with glued photomultipliers (their number is usually 19 to about 120) and appropriate electronics is built into a special
robust housing (a kind of "pot"),
providing light tightness and radiation
shielding against ambient ionizing radiation. The metal
housing also shields the photomultipliers against an external
magnetic field. At the bottom of the camera housing is a
mechanism for attachment the collimator, which
must be tightly attached to the crystal. The collimators are
exchangeable, during manual exchange they are usually fastened
with screws, for automatic exchange the collimators are fixed
with special motorized holders. For SPECT cameras, there are also
touch sensors for mechanical protection of the patient
and the detector when the camera moves towards the patient.
Stand and gantry for
mounting detectors
The entire camera detector is then mounted on a special stand
equipped with electric motors for mechanical movement of
the camera - shift in the vertical, or event. horizontal
direction and for rotation of the detector. For SPECT tomographic
cameras, the stand is made in an annular arrangement as a
so-called gantry, enabling by use of an electric
motor angular rotation of the camera around the
examined object. There are usually two detectors mounted on the
gantry, which can be angulary rotated around the axis of the
lounger - a "double-headed" camera. Additional electric
motors ensure radial displacement of the
detectors towards the center and away from the center, so that it
is always possible to set the smallest possible distance between
the body surface and the collimator face.
Examination lounger
Under the camera detector, there is a bed
(lounger) for the examined patient - perpendicular to the stand,
or enters inside the gantry. Manually or motorized, it allows
horizontal movement in a sufficiently large
range (up to 2m) to
be able to pass with the whole patient under the camera or
through the gantry and take images of different parts of the
body. To a lesser extent (approx. 60 cm) a vertical shift is also realized. The lounger should be
sufficiently robust (load capacity min. 180
kg) and stable, ensuring mechanical
positioning with the possibility of locking. The support plate of
the lounger in SPECT cameras is made of a material with low
absorption of gamma and X-rays (when
scanning from the front and back through the lounger). With the lounger pushed aside and the camera detector
turned vertically, scintigraphic examinations of patients can
also be performed sitting or standing.
To perform the whole body
scintigraphy (whole-body imaging), the bed with
the patient with using the electro-motor is slowly moved
in the longitudinal direction, so that the individual parts of
the patient's body gradually enter the field of view and are
detected by the camera detectors; the acquisition computer
fluently composes of a whole-body scintigraphic image -
"gliding" whole-body scintigraphy.
Auto-Body-contouring
To achieve the best possible resolution, the gamma camera
(collimator face) should be placed as close as possible
to the patient's body surface (trigonometric
analysis is performed below in §4.5, section "Spatial resolution"). Auto-contouring
or body-contouring is a useful opto-electronic
tool for ensuring optimal quality of scintigraphic imaging in
whole-body and SPECT examinations: when moving
the lounger and rotating the camera, using electronic position
sensors, the camera detectors on the gantry are automatically
shifted by electric motors so that they "copy" the
patient's body and the collimator is still as close as possible
to the patient's body surface (automatic
"body contouring").
Auto-contouring is
realized by means of two rows of infrared LED diodes
and two rows of opposite photodiodes, placed in
two strips mounted on opposite edges of the camera detectors.
Electronic circuits regulate the radial position of the gamma
cameras so that the infrared rays from the outer row are
interrupted, but not from the inner row (closer to the front of
the collimator). The distance of the detector is thus constantly
kept in the range between the two rows of LEDs <-->
photodiodes, approx 10 mm.

Fig.4.2.4. Construction arrangement of a scintillation camera.
Left: Uncovered
scintillation camera detector - collimator, crystal, system of
photomultipliers and electronic circuits.
Right: Example of an assembled planar
camera with one detector (top) and a SPECT tomographic
camera with two detectors in gantry (bottom).
In the left part of Fig.4.2.4 is a disassembled
detector of a smaller older camera (PhoGamma
Nuclear Chicago, with 19 photomultipliers),
removed from the shielding package. Below we see a collimator,
above it is a thin circular scintillation crystal, to which
photomultipliers are optically attached via light guide blocks.
In the upper part of the detector there is the appropriate
electronics, especially the preamplifier for each
photomultiplier, adjustment circuits, for digital cameras also
analog-to-digital converters and microprocessors for determining
coordinate pulses. Newer scintillation cameras have a larger
rectangular crystal, equipped with a larger number of
photomultipliers.
In the right part of Fig.4.2.4 there
is an example of two installed cameras. Above is a smaller planar
camera with one detector on a simple stand (PhoGamma
HP from 1973, with Clincom evaluation device; on the left next to
the camera stand, there is a stand with interchangeable
collimators), at the bottom there is a
larger SPECT tomographic camera (from 2002)
with two detectors ("heads")
mounted on circular gantry *) and motorized movement of a lounger
for whole-body scintigraphy.
*) Occasionally was also used some other
construction arrangements of scintillation camera devices
(Anger-type camera detectors themselves are designed almost
identically for different types and manufacturers; other
alternative technical solutions are mentioned below). Instead of
the classic circular gantry, the detectors were mounted on
special arms, the movements of which were
electronically controlled by servomotors. The
advantage here was perhaps greater flexibility of different
detector positions (including the possibility of simultaneous
independent sensing of two patients by each detector separately).
In addition to "universal" cameras, special single-purpose
cameras with a fixed detector configuration were
sometimes used, such as 3 or 4 detectors connected in a triangle
or square, designed for scintigraphy of the heart (myocardium) or
brain. However, all these more complex construction
arrangements of gamma cameras did not not proven himself in
the end and soon ceased to be used...
The electronic
circuits of the scintillation camera have been described
above (in the section " Principle
of the scintillation camera ") only in a general and simplified way, rather from a
physical point of view. Scintillation cameras are equipped with a
number of other electronic circuits for adjustments and for
corrections of physical-electronic influences. They are important
eg circuits for the correction of X, Y coordinate pulses
- the shape and size of the image, especially the correction of
the dependence of the image size on the energy of the
detected gamma radiation - so that the scale of the image is not
dependent on this energy.
Scintigraphic
collimators
The primary "optical member" of a
scintillation camera, through which radiation g is the first to
pass, is the collimator *). In terms of gamma
imaging, the collimator has an analogous function as an optical lens
when photography. Its task is to make the most perfect projection
of the distribution of radioactivity in the examined object using
g- radiation
into the plane of a large-area scintillation crystal. Therefore,
the final quality of the scintigraphic image
largely depends on the properties of the collimator.
*) From the general point of view of radiation physics
and radiation detection, collimators were discussed in §2.1
"Methodology of ionizing radiation detection", paragraph "Shielding, collimation and
filtration of detected radiation" and in §3.1 "Nuclear and radiation methods",
section "Collimation of ionizing
radiation"). In
scintigraphy, collimators have an imaging role. For
positron emission tomography, coincident electronic
collimation is used instead of mechanical collimators
for imaging - see below “Positron
emission tomography PET”.
In general, the collimator is a
special aperture made of a shielding material
(mostly lead, sometimes tungsten), defining the direction
of the photons incident on the scintillation crystal as
well as the field of view of the camera. Most often it is a plate
with a large number of densely and evenly spaced holes
- channels - of a certain shape, size and
direction. Without attenuation, only photons flying in
the direction of the axis of the collimator's orifices
pass through the collimator (and impinge on the crystal), or only
with a small deviation, ie almost perpendicular
to the collimator front and to the crystal surface. Other photons
in other directions are absorbed in lead
partitions (septs, baffles) between the holes, they do
not fall on the crystal and are not detected.
Collimators
for scintillation cameras are usually replaceable
- there are several types of collimators with unambiguously
defined properties, which govern their use. The collimators are
distinguished according to the number, size and configuration of
the holes, according to the radiation energy g for which they are
optimized, according to the resolution and sensitivity (detection
efficiency). The imaging properties of collimators are discussed
in more detail in §4.5 "Physical
parameters of scintigraphy".
Here we give a brief overview of the
basic types of collimators - Fig.4.2.6. First we will deal with
collimators with parallel holes - channels -
perpendicular to the scintillation crystal of the camera, which
are by far the most common type - here the image of the object
created in the detector has the same size of 1:1 as the
displayed object, regardless of the distance of the source from
the collimator (however, the spatial
resolution of the imaging depends significantly on this
distance, see below).
Fig.4.2.6. Left: Basic types of
collimators of scintillation camera (gamma camera crystal is in
the up position, just above the collimator). Right:
Example of a robust high energy collimator HE and a subtle low
energy collimator LE HR (and cutout from
UHR) .
Collimators
for different energies
The most basic criterion according to which collimators are
divided is the radiation energy g,
for whose scintigraphic imaging the collimators are optimized.
According to this gamma radiation energy, the collimators have
different thicknesses of the partitions
(septums) between the openings *), sufficient to absorb the
radiation of a given energy.
*) The thickness of
the partitions
The optimization of the collimator design for
the required energy of gamma photons is based on the requirement,
that gamma radiation passes only through the holes,
while in the partitions (septs) between them it was effectively absorbed.
If gamma radiation penetrated to a greater extent across the
baffles, it would degrade the imaging properties of the
collimator, especially the contrast of the image (it is discussed in §4.5, passage "Over-radiating trough collimator septa", Fig.4.5.3). For
complete absorption of gamma photons would need a large thickness
of the baffles, which would lead to very low
detection efficiency. However, as a sufficient criterion for
achieving a reasonable level of cross-radiation over baffles,
without significant deterioration of the image contrast, a value
of 5% is considered. According to the
trigonometric analysis in Fig.4.5.3b in
the passage "Over-radiating trough collimator septa", this leads to the
condition for the transmission factor e -m .s.L
/(2d + s) <0.05, where d is the diameter of the
holes, L their length, s the thickness of the
baffles and m is the linear absorption coefficient of the collimator
material (lead) for the required gamma energy. This gives a
limitation for the thickness of the collimator septs s > (6.d/m)/[L - (3/m)]. The optimal
is the smallest possible thickness of the
partitions, allowed by cross-radiation - so that the septa shades
the smallest possible area of the detector and the efficiency
(luminosity) of the collimator is the best
possible.
The absorption coefficient of the
collimator material (lead) strongly depends on the gamma
energy, on which thus the required thickness
of the baffles depends. For low energies around 150keV, where for
lead is m » 21.4 cm-1, eg for a collimator with holes 2 mm in diameter and 25
mm long, the required partitions thickness is s » 0.3 mm (thin lead foil). For higher energies around 400keV, where m is » 2.5 cm-1, significantly thicker
partitions s » 4.5 mm are
needed.
According to gamma energy we have 4
basic types of collimators (Fig.4.2.6 left) :
Recently, it has been constructed :
Appropriate selection of the collimator
according to the energy of the emitted gamma radiation has a
fundamental effect on the quality of the scintigraphic image. For
low energies, such as 140keV 99mTc, we use Low Energy collimators, which
provide the best resolution. If we used a robust HE
collimator (for high energies) here, we would get an image with
lower resolution and lower detection efficiency, on which, in
addition, the lead septa between the holes of the collimator *)
would be disturbingly visible. We can also use the Pinhole
collimator (see below "Collimators
with special geometry"), which
provides a quality image, but with significantly lower detection
efficiency. For higher energies, such as 364 keV 131I, the collimators Low
Energy are completely unusable, significant cross-radiation
between the septa completely degrades the image into a shapeless
"daub" (it is discussed in §4.5,
passage "Cross-radiation of the
collimator septa"). It is imperative that we use a High Energy
collimator here (the holes and partitions
of the collimator can also be seen in the picture) or Pinhole. Pinhole is the
only type of collimator, that is in a wide range independent
of energy.
*) This disturbing structure of the holes and septa of the HE
collimator can be suppressed by a stronger smoothing of the image
(approx. 4 x S9), at the cost of a lower resolution - pictures on
the right.
Scintigraphic images of a thyroid phantom filled with 99mTc (top)
and 131I (bottom),
imaged using the collimators Pinhole , Low Energy HR
and High Energy HE. The disturbing display of the holes
and septa of the HE collimator can be suppressed by a stronger
smoothing (filtering) of the image - pictures on the right.
Collimators according to
resolution and sensitivity
Another criterion for the division of collimators is their
required resolution and sensitivity
(efficiency - "luminosity"). However, this only applies
to low energy LE
collimators; with robust collimators for high and medium energies
we cannot achieve either good resolution nor high sensitivity,
due to the thick partitions between the holes (and thus the low density of the holes). According to the resolution and sensitivity,
low-energy collimators are further divided into :
The number of collimator
holes
depends on the type of collimator and its size (area) of the
camera's field of view. With the current planar/SPECT cameras,
the field of view is around 55 x 45
cm. The total number of holes for the basic types of
collimators is then approximately :
HE - 8000 holes ; ME - 15,000
holes ; LEAP - 80,000 holes ; LE HR (UHR) - 140,000
holes .
The holes are usually hexagonal in shape.
Spatial resolution of a
gamma camera
The spatial resolution of a camera is determined by two
components: the internal resolution of
the detector and the resolution of the collimator (for a more detailed analysis, see §4.5, section "Spatial resolution") . The resolution of the collimator
is determined by the diameter of the holes and
their length. HR collimators with narrow and
long holes (the length of the holes is
given by the thickness of the collimator) have
better resolution than thinner HS collimators with larger and
shorter holes. The spatial resolution of the gamma camera
significantly depends on the distance displayed
structures from the collimator front. From each hole of the
parallel collimator we can draw an imaginary cone
defining the area from which gamma radiation can pass through
this hole to the camera detector (radiation
from places outside this cone is absorbed by the lead septa of
the collimator). With the distance from the
collimator, this detection cone widens, which
significantly worsens the geometric spatial
resolution of the image projected by the collimator on the
scintillation crystal of the gamma camera (trigonometric
analysis is performed below in §4.5, section "Spatial resolution", here for the sake of clarity we present only the
basic Fig. 4.5.2 :) .
Fig.4.5.2. Deterioration of the positional resolution of
the gamma camera with increasing distance h from the
collimator front. The image of the point source becomes more and
more "blurred" with increasing distance, the PSF
expands and the spatial resolution of the FWHM deteriorates -
Fig. d). Deterioration of the spatial resolution
is accompanied by a decrease in the brightness of the image, but
the total number of pulses is the same in all images and the area
(integral) under the
PSF function is also the same for all distances.
The gamma camera (front
of the collimator) should therefore be
placed as close as possible to the surface of
the patient's body. For collimators with a different arrangement
of holes (see below),
the geometric situation is more complicated, but in principle the
same rule applies to the deterioration of the spatial
resolution for greater distances from the collimator
face.
Detection efficiency
of the scintillation camera
The detection efficiency
(sensitivity) of the camera is given by the efficiency
(luminosity) of the collimator and the internal detection
efficiency of the detector (discussed in more detail in §4.5, section "Detection efficiency (sensitivity) of the gamma
camera"). Efficiency (transmittance, luminosity) of the collimator
is given by the diameter of the holes and their length,
but in the opposite ratio to the resolution. The larger and
shorter the holes, the higher the detection efficiency. The
efficiency or luminosity of collimators is generally very
low - around 1-2 %.
Interestingly, with gamma cameras,
when using parallel collimators, the detection
efficiency (sensitivity) does not depend on the distance h
of the displayed source from the collimator front! The
imaging of the point source in a wide range of distances 0-30 cm
from the front of the collimator in Fig.4.5.2 d shows a
deterioration of spatial resolution and decreased image
brightness, but the total number of pulses is the same in all
images, area (integral) under the PSF function is the same for all distances.
This surprising behavior is due to the specific
properties of geometric collimation in parallel
collimators. We can clearly illustrate this according to the
schematic drawing in Fig.4.5.2 b) as follows: As
the source moves away from the collimator front, the number of
photons incident on the individual holes decreases
quadratically as 1/h2. However, the number of holes through which radiation
can pass to the detector, increases
quadratically in proportion to h2. These two opposing trends cancel each
other out, so the total photon flux passing
through - collimator efficiency - does not
change with the distance between the source and the
collimator.
Note: This
rule does not apply to special convergent or Pinhole
collimators, the detection efficiency here changes
significantly with distance - it increases or decreases (see
§4.5, section "Imaging
properties of special collimators").
However, this distance sensitivity
independence of parallel collimators only applies to situations without
a substance-absorbing environment - in vacuum
or in air. In practical scintigraphy, however,
there is a tissue environment between the
displayed structures with distributed radioactivity in the
organism and the gamma camera, with which gamma radiation
interacts, which leads to the absorption and attenuation
of gamma radiation. This a gamma-ray absorption, also called attenuation,
is reflected in scintigraphic images by an artificial
reduction in the number of pulses from structures deposited
at greater depths, compared to structures closer to the surface.
In such a case, the statement that the detection efficiency
(sensitivity) does not depend on the distance of the
displayed source from the collimator front, is no longer
valid. Here, the detection efficiency decreases
significantly with the distance - depth - of the
displayed source !
Collimators with special
geometries
In addition to collimators with parallel holes - channels - the
collimators with otherwise geometrically arranged holes are used
for some special purposes (Fig.4.2.6. in the middle) :
The imaging properties of collimators are
discussed in more detail in §4.5 "Physical
parameters of scintigraphy".
Here, for clarity, we will only duplicate graphs of the
dependence of the spatial resolution and detection efficiency
(sensitivity) of the gamma camera with basic collimators on the
distance :
Fig.4.5.6. Dependences of the spatial resolution FWHM (left)
and the detection efficiency S (right)
of the gamma camera on the distance of the source from the front
of various types of collimators.
Imaging
properties of the most important types of collimators with
different geometric arrangement of the holes, we tested using
linear orthogonal grid (its
construction is described in "Phantoms and phantom
measurements in nuclear medicine" image "Grid") :
For a collimator with parallel
holes (such as LE HR left) we get a linear
imaging of the grid everywhwre, only for a greater distance from
the front of the collimator, the spatial resolution deteriorates
(blured grid). With a convergent collimator
(such as a SmartZoom with the convergent center part) the image
of the center part increases with increasing
distance. With the Fan Beam collimator (which is
convergent in the transverse direction, parallel in the axial
direction), the grating espands only in the transverse
direction with increasing distance, it remains the same
in the axial direction.
The most striking dependence on the
object distance exhibits the collimator Pinhole:
tightly close to the opening we get the image magnified
many times, with increasing distance the zoom decreases and for
distances above approx. 20cm the image is already reduced.
Of all the images is also seen a
general trend of deteriorating resolution (and thus
contrast in the image) with the distance from the front of the
collimator.
Scintigraphic images
and their evaluation
The whole process of scintigraphic diagnostics
is schematically shown in Fig.4.2.5. After application of
radioindicator, its distribution occurs
in certain parts of the organism (uptake in
target tissues and organs, or flow of the radiotracer trough
blood vessels and heart cavities). This
distribution is imaged by a scintillation camera using external
detection of the emitted radiation g. Digital scintigraphic
images are created on a computer, which on the one hand
we evaluate visually, or we can create curves
and mathematically analyze the investigated
processes and calculate quantitative parameters
of the functions of individual organs. Finally, an interpretation
of all these partial data and results is coming, which, together
with data from other methods, will result in the making a diagnosis
in the final protocol.
Fig.4.2.5. Schematic
representation of the whole process of scintigraphic examination
- from the application of the radioindicator to the patient and
its uptake in target tissues and organs, through the process of
scintigraphic imaging with a gamma camera, visual evaluation of
images, mathematical analysis and quantification, to
interpretation and making a diagnosis.
The methodology of mathematical analysis and computer evaluation of scintigraphic studies will be discussed in more detail below in Chapter 4.7 "Mathematical Analysis and Computer Evaluation in Nuclear Medicine".
Adverse
influences on scintigraphy and their correction
In scintigraphy, there are some unfavorable and disturbing
phenomena, which can worsen the quality of the image and
thus, in the extreme case, even lead to incorrect
interpretation of scintigraphic examinations in the
sense of false negative or false
positive findings. Here are six basic adverse effects
that occur in general in every scintigraphy, ie
in planar scintigraphy and SPECT tomographic scintigraphy. Other
adverse and disturbing phenomena specific to SPECT (such as
instability of the axis of rotation or artifacts arising during
reconstruction) and PET (random false coincidences) will be
mentioned below in §4.3.

 |
| Fig.4.2.7.
Volume and activity distortion in images of
lesions of various sizes (left) and specific
activities (right). Left: Images of sources with the same specific activity, but different sizes, appear differently clear. Right: Images of sources of the same size, but of different specific activities, appear to vary in size. (measured on PhoGamma LFOV camera, FWHM = 6mm) |
These unwanted side
effects are significant manifested in small
lesions, smaller than 2.FWHM
(twice the resolution), while in lesions larger than
about 3-4.FWHM are practically
negligible (they appear only at the edges of the lesion
image). The phenomenon is particularly unfavorable in small
negative lesions - small districts of reduced
radioindicator concentration against the background of
higher radioactivity concentration. Here, the effect of
over-radiation from the surroundings into the image of
the lesion can completely erase the visibility
of such a small lesion, which disappears in statistical
fluctuations; we say that such a lesion is
not detectable (see
below "Scintigraphic image quality
- detectability of lesions", Fig.4.2.9) .
Overall, it can be said that due to the
"blurring" of the image, the observed activity
(number of pulses in the image), artificially decreases
in positive ("hot") lesions, and it increases
in the negative ("cold") lesions.The common
consequence here is a reduction in image contrast
(see also below "the quality of scintigraphic images -
detectability of lesions")
.
Correction
of the activity distortion
Have been developed methods for correcting this distorted
imaging of activity - the so-called Partial Volume
Correction ( PVC), which is desirable for
quantitative image analysis, such as SUV determination
(see "Scintigraphic image quality - lesion
detectability" below).
Theoretically, reconstructive algorithms could be used
based on the knowledge of the response function of the
point source PSF (point spread function) - the
above-mentioned method of resolution recovery,
but it fails at higher statistical fluctuations. In
practice, simple multiplication by correction
factors is sometimes used, which indicate the
ratio of the actual volume activity of the lesion to the
apparent activity in the image. These coefficients are
strongly dependent on the size of the displayed object
and on the spatial resolution of the scintigraphic image;
their specific values are determined on the basis of phantom
measurements. In the literature, the values of
inverse correction coefficients, so-called recovery
coefficients RC (Recovery
Coefficient) depending on the diameter of the spherical
lesion for different values of FWHM resolution are
tabulated or plotted. To use this correction method
correctly, you need to know the actual size of
imaged lesions, which is practically only available for
hybrid systems combining scintigraphy with anatomical CT
imaging (see below §4.3 "Tomographic cameras",
section "Image fusion, hybrid
tomographic systems").
For small lesions of about 1 cm with a resolution of FWHM
@ 8 mm, the correction coefficient is 1/RC @ 5, for
smaller lesions or worse resolution (as is usually the
rule at greater depths), its value is even higher. This
leads to a large correction error, which
is practically unusable at values of the
correction coefficient approaching ~ 10. Of course, the
above-mentioned resolution recovery method is
also unusable here.
If the size of the displayed lesion is smaller
than the spatial resolution of the camera, the
differences in the volume of this structure will be
reflected only in the number of accumulated pulses in
pixels of the image location (brightness or intensity of
the displayed lesion). This effect is sometimes used to
assess changes in heart wall thickness in the SPECT
myocardium.
Note:
The effect of volume (size)
and intensity distortion is manifested not only in
scintigraphy - it occurs wherever the image shows convolutional
blurring. And that is, to a greater or lesser
extent, in practically all imaging methods ...
Fig.4.2.8. Influence of registered number of photons on image
quality in terms of statistical fluctuations (noise) - image
quality improves with increasing number of photons.
Above: Photographic portrait exposed
with different number of photons of light .
Bottom: Gammagraphic image of
a phantom (Jasczak, filled with 99mTc radionuclide ) taken by a scintillation camera with different numbers
of g- photons
in the image.
 |
| Compton scattered radiation in scintigraphy |
If, by coincidence, a
photon is scattered in the tissue at such an angle, that
this scattered photon passes through the collimator
orifice and is detected by the camera crystal (in Figure a), then this g´ photon are detected from a false
location - the gamma photon is detected
seemingly as coming from a different place than that from
which it was originally radiated during the radioactive
transformation (a similar
"false localization" effect may occur with
Compton scattering of g
radiation in the material of the
scintillation crystal itself).
These randomly coming scattered photons g´ would be
artificial reduced the contrast of the
scintigraphic image.
Fortunately, however, these
false scattered photons g´ have lower
energy than the "true" direct and
primarily detected photons g (part of the energy
was transferred to the electron e- during
scattering in matter), so they
usually do not fall into the photopeak (in Figure b). By carefully setting the analyzer
window to the photopeak of the given radiation g, we can
therefore largely eliminate the
Compton-scattered radiation g´. More effective
suppression of Compton. scattered radiation can be
achieved by a narrower window, or its
slightly asymmetrical adjustment towards higher
energy - but at the cost of reduced detection efficiency (elimination of part of the primary photons) and the risk of a slight deterioration in the
homogeneity of the camera's field of view (in a narrow and asymmetrical window, aligning
the response of individual photomultipliers may not be so
perfect).
Correction for g-scattering
However, a small proportion of Compton-scattered photons
(scattered at a small angle) still energetically extends
into the region of the photopeak and can be detected.
Some types of scintillation cameras use special
electronic procedures to correct or eliminate
these remaining scattered photons.
Pulses for each pixel of the image are registered in two
or three energy windows (DEW - Dual
Energy Window, TEW - Three Energy Window; instead of the
word "Energy", the "Photopeak" is
sometimes used and abbreviations are written DPW or TPW) : 1. window just in front of the photopeak (with a
high proportion of scattered radiation), 2. main
central window of the photopeak, 3. window just behind
the photopeak. For these energy windows three
corresponding images are created . By interpolating the
number of pulses registered in the auxiliary windows
before and after the photopeak, the fraction of
scattered photons corresponding to the main window
of the photopeak is determined for each pixel - a "scattering
image" is formed, which is subtracted
from the main image in the basic central window.
More
complicated methods of scattering correction were also
tested with a larger number of analyzer windows, or with
different homogeneity correction matrices for different
windows; however, with significantly greater complexity,
the results were not demonstrably better than with the
basic TEW method. Algorithms for obtaining (modeling) 2D
or 3D scattering distribution are being developed for
SPECT tomographic scintigraphy, with implementation into
reconstruction procedures of type MLEM, OSSEM (below
§4.3 "Tomographic scintigraphy", section
"Computer reconstruction of
SPECT", passage "Iterative
reconstruction").
Author's note - experiences with scattering
correction :
At our workplace, we tested the above methods of
correction for gamma scattering using phantom
measurements. With the phantom of 99mTc
point sources placed in a scattering water environment,
we took scintigraphic images with different settings of
the analyzer window - central to the photopeak and
differently shifted down and up. We then interpolated the
images thus obtained in front of and behind the photopeak
and subtracted them from the images with the central
window. The resulting effect was virtually
indistinguishable from simply setting the
appropriate brightness and contrast modulation (LT and UT
levels) in the uncorrected image matrix display. We are
therefore relatively skeptical about the
methods of scattering correction at our department of
nuclear medicine...
Another source of false impulses
can be the so-called pile-up effect of
the cumulative electrical response of two quantum g , detected
almost simultaneously (see §2.4, section "Scintillation spectra of
radionuclides"). This
is manifested at high frequencies (fluxes) of g photons.
In most cases, these pulses fall off the photopeak and
are not detected. However, if there is a pile-up effect
on two simultaneous Compton scattered photons, the
resulting pulse may fall into a photopeak with its
amplitude - it is detected and may slightly contribute to
the degradation of the scintigraphic image contrast.
Physical
parameters of scintigraphy
Resolution, detection efficiency, homogeneity and other
parameters of the scintillation camera are defined and discussed
below in §4.5 "Physical
parameters of scintigraphy - image quality and phantom
measurements". The methods of
their measurement and testing are discussed in the work "Phantoms
and phantom measurements in nuclear medicine".
Errors and pitfalls of
correction methods - correction artifacts
It should be noted that no correction methods are
"self-saving", but they can have their pitfalls. Errors
of correction methods can be divided into two categories :
Undercorrection, overcorrection, and correction artifacts can lead to similar deterioration (or even the risk of misinterpretation) of scintigraphic images as uncorrected studies. Experience shows, that in order to correctly interpret the findings, it is necessary to carefully compare images without correction and images with correction by the "trained eye" of an erudite expert, who must also take into account the specific anatomical and positional circumstances of the patient.
Scintigraphic
image quality - lesion recognition
The above-mentioned adverse effects mean that the scintigraphic
image is not entirely accurate and perfect - despite useful
information, disturbing statistical fluctuations
(noise) overlap, the image is blured and often low
in contrast. This imperfect quality leads to the fact
that some more subtle structures of the examined object are not
visible on the scintigraphic image - we say that such lesions
are not detectable. In the diagnostic practice of
nuclear medicine, such a scintigraphic image is optimal,
which, in addition to objectively measurable physical parameters,
it also suits the human subjective visual perception
of the evaluating physician. So what parameters of the examined
object and its image decide on the the objective imaging
and the best possible recognition of lesions ?
The basic regularities result from the
properties of scintigraphic imaging and from the statistical
analysis of the resulting image data. In the left part obr.4.2.9
shows scintigraphic images of simple structure (lesion) of the
circular shape of the size (diameter) d
and the specific activity A, surrounded
by a homogeneous environment - background - specific activity of B
. The prominence of the lesion against the background can be
characterized as the contrast of the object Cobj = (A - B)/B; (event. x 100 in [%]). Scintigraphic imaging produces an image in which the
lesion is shown as a structure A* and the background as a
constant area B* (more or less
wavy,depending on statistical fluctuations).
Fig.4.2.9. Analysis of contrast and statistical fluctuations of
scintigraphic imaging of lesions (phantom
measurements on a PhoGamma LFOV camera) .
If we compare the original object with its
scintigraphic image, we see two main differences :
¨ 1.
Blur and contrast reduction
Due to imperfect spatial resolution, the sharp contours of the
original object A were blurred and the
difference between image maximum A* and background B* decreased -
image contrast Cimg = (A*max - B*)/B* is lower
than the contrast of the object Cobj : C img < C obj . Assuming a circular lesion and Gaussian convolutional
blur (the response function of the point
source PSF of the camera has the shape of a Gaussian curve with a
half-width FWHM), the relationship between
the contrast of the object and the image is given by the
exponential expression :
C
img
= C obj . e - (FWHM / d) 2 ,
where FWHM is the camera resolution and d is the size
(diameter) of the lesion. For large lesions (d> 4.FWHM), the
contrast of the image hardly changes (Cimg @ Cobj). However, in small
lesions, comparable or smaller than the FWHM camera resolution,
the contrast degradation is very significant, Cimg << Cobj (at a typical camera resolution of 10mm,
the contrast of a 1cm lesion decreases almost 3-fold, in a 5mm
lesion more than 30-fold !).
¨2.
Statistical fluctuations - noise
Due to the quantum stochastic laws of radioactive decay, emission
and detection of quantum radiation g, all parts of the
scintigraphic image show statistical fluctuations
- noise is covered over the image of the object.
As shown in §2.11 "Statistical fluctuations and measurement
errors", the magnitude of this
noise at each point of the image is given by the square root of
the average accumulated number of pulses n : s = ±Ö(n). The relative
statistical fluctuations s/n = 1/Ö(n) are lower the higher the number of pulses
accumulated in the individual cells of the image. Constant
background B is thus shown as an area whose points
fluctuate roughly between B* ±
Ö(B*), ie with sB = ±Ö(B*). Similarly, the point values in the A* image
fluctuate statistically. If these fluctuations are too high,
comparable to the average values of the difference between A* and
B*, these differences can easily be "lost" in them and
the corresponding structure will not be visible in the image.
Disturbing statistical fluctuations are thus a fundamental
limiting factor for the recognizability *) of small and
not very contrasting lesions on the scintigraphic image.
*) Were if not for statistical
fluctuations, by artificial increase in steepness
(contrast) display of a scintigraphic image on the screen, to
would be possible achieve visibility of even small and low
contrast lesions. In addition, appropriate deconvolution
filtering (using the inverse modulation transfer
function MTF) could correct the camera resolution, resolution
recovery - computer "focus" of the image - and
reconstruct all details from the displayed object (see "Filters and filtering", section "Band focus filters").
Unfortunately, statistical fluctuations deprive us of most of
these possibilities in practice ...
The statistical analysis of image
data shows, that we can only recognize (and
statistically prove) in the image a structure (lesion) whose
contrast Cimg satisfies condition
C
img
> 4 / Ö(B*) .
It is a condition of the statistical significance
of the difference A* - B* information in the lesion image A* to the surrounding
fluctuating background B*.
Signal
- noise
In analogy with the analysis of electrical signals in low-current
electronics, the terms are introduced for the quantitative
description of image properties :
Signal S
is the difference in image intensity (its
"brightness", number of accumulated pulses) between the investigated structure (lesion) and
environment. In our case it is given by the difference: S = A*max - B*.
Noise N
represent disturbing statistical fluctuations in the image. For
our case, background fluctuations are important, so the noise is
given by the square root of the average accumulated number of
pulses in the background image: N = sB = Ö(B*).
Like the signal quality of the
electronics, the quality of the image given by
the parameter :
Signal to noise ratio SNR, SNR = S/N = S/Ö(B*) .
The above statistical condition for the detectability of a lesion
can then be expressed as follows: A lesion can
be seen in an image only if its signal-to-noise ratio is SNR
> 4 .
If we take into account the effect
of resolution and statistical fluctuations, by combining the
above relationships we can formulate the basic condition
of lesion recognition as follows :
Cobj > 4.
e (FWHM / d) 2 / Ö(B*) .
Only such a lesion will be visible in the image, which will have
sufficient contrast Cobj (in the accumulation of radioactivity), geometric size d
large enough compared to the resolution of the FWHM camera and
the number of accumulated pulses will be large enough so that the
relative statistical fluctuations are not too high. The image of
the lesion is better the larger, more contrasting the lesion and
the higher the density of accumulated pulses in the image. And
the smaller the size and contrast of the lesion, the higher we
need to accumulate the number (density) of pulses in the image
for its successful imaging. For the display of these small and
not very contrasting lesions, the best possible resolution of the
camera is also crucial in order to avoid an enormous degradation
of the contrast of the lesion during the imaging.
Positive
and negative lesions
One of the differences between "cold" (negative) and
"hot" (positive) lesions is that the well acumulating
hot lesions can have high contrast Cobj even many hundreds of percent, while with cold lesions
the contrast can reach a maximum of 100%. Therefore, we can
observe well-displayed even the small (but contrastively
accumulating) hot lesions, such as inflammatory or tumor foci in
classical skeletal scintigraphy or 18FDG PET. Smaller cold lesions are difficult to observe,
especially when they are stored deeper (such as inside the liver
or lungs).
Deep deposites lesions
Phantom measurements in the left part of Fig.4.2.9 (similar to
the measurements above in Fig.4.2.7) were performed without a
scattering environment (in the air) and near the front of the
camera collimator. They simulate an idealized situation of superficial
lesions. If the lesion is deposited at greater
depths in the tissue, four other adverse factors apply,
further reducing imaging contrast and impairing lesion
detectability :
v A greater distance from the collimator front leads to
poorer resolution (higher FWHM), which reduces the Cimg contrast in the
image according to the exponential dependence above.
v Absorption of g radiation from the
lesion as it passes through the tissues (attenuation), reduces
the number of useful pulses detected in the lesion image.
v Radiation from other layers of
tissue can be added to radiation g from the lesion. This
primarily reduces the contrast of the object Cobj in the respective
planar projection and thus the contrast in the image. This effect
is largely eliminated in SPECT and PET tomographic imaging (see
§4.3 "Tomographic scintigraphy" below).
v Part of the gamma radiation is Compton scattered in the
tissue material. Part of this scattered radiation is detected and
also reduces the contrast of the lesion image (as shown above in
Figure 4.2.8).
In the right part of Fig.4.2.9 is a
phantom display of positive and negative lesions deposited on the
surface and at different depths in the tissue (simulated by water
with dissolved 99mTc activity). In deep-seated lesions, their image
deteriorates sharply, especially in the case of negative
("cold") lesions.
How
can image quality and detectability of lesions be improved ?
The recognizability of small structures (lesions) in
scintigraphic imaging is determined in practice mainly by the
following factors :
× Geometric size of the lesion;
× Accumulation of radioindicator in the lesion compared
to the surrounding tissue ® contrast of the lesion;
× Depth of lesion placement ®
attenuation of radiation, interference with radiation from other
layers;
× Spatial resolution of the scintigraphic system -
contrast in the image;
× Detection efficiency (sensitivity) + acquisition time ®
number of accumulated pulses ® statistical fluctuations.
The size and location of the lesion
is determined by the anatomical situation of the patient, the
resolution and sensitivity of the camera are basically determined
by its construction, but we can partially influence them by a
suitable choice of collimator. There are then, in principle, four
ways in which we can improve the image quality and the capture of
lesions :
l Increase the primary contrast of the lesion
This can be achieved in some cases by choosing a suitable
radioindicator, which is more selectively taken up in
the diagnosed lesion.
l Increase the applied activity
of the radio indicator, which will increase the detected
number of pulses and reduce the relative statistical
fluctuations. However, this encounters the problem of increased
radiation exposure of the patient and, at high
activities, also for a dead time of detection device.
l Increase the image acquisition
time ,
which proportionally increases the number of stored pulses in the
pixels of the image and reduces the relative statistical noise.
However, too long an acquisition time brings problems with the movement
of a patient, which does not last so long motionless
under the camera detector. In dynamic scintigraphy, this solution
is usually not applicable at all, because the acquisition time of
individual images is determined by the time dynamics of the
investigated process.
l Perform a suitable computer filtering of the
image ,
which can improve its quality and help identify smaller defects - it is discussed in more detail in the discussion
"Filters and filtering of scintigraphic
images". It is mainly optimized smoothing of
statistical fluctuations ( Low-pass filters - smoothing ) and artificial improvement
of resolution - resolution recovery
("Bandpass filters - focusing").
In general, the lesion in the tissue
is displayed more easily, if it is larger, more contrasting and
located at a smaller depth below the surface of the body.
Quantification of positive lesions on
gammagraphic images - SUV
One of the most common tasks of radionuclide gammagraphy is to
display the accumulation of a suitable
radioindicator in lesions (especially tumor) - not only to
recognize the lesion in the image, but also to determine the quantitative
intensity of radioindicator accumulation in the
displayed tissue. A simple relative criterion of
the significance of the displayed lesion is the above discussed contrast
of the image Cimg = (A*max - B*)/B* between
the activity (accumulated number of pulses) in the A* lesion
image and the surrounding B* background. To assess the severity
of tumors in different patients, as well as in
monitoring the time course of tumor size and metabolic activity
in a given patient (most often monitoring
the biological response of tumor tissue to therapy), the degree of accumulation of the relevant
radiopharmaceutical in images from various independent
scintigraphic studies should be evaluated and compared.
For the absolute (semi)quantitative expression
of the selective uptake of the radioindicator in
the tumor, in comparison with the average distribution in the
rest of the body, the so-called standardized accumulation
value SUV (Standardized Uptake Value) is often
used. It expresses the ratio of the local accumulated
concentration of the radioindicator in the lesion to the average
concentration in the whole body (ie to the
applied activity normalized to the patient's weight) :
SUV = C / (Ainj / M) .
Here, C [kBq/cm3] is the tissue concentration of radioactivity (volume
activity) in the lesion, Ainj [MBq] is the applied activity, M [kg] is the
mass (weight) of the patient. The values of volume activity of
lesion C and applied activity of Ainj must be corrected at the same time (especially when using short-lived radionuclides such as
99m-Tc or 18-F). Concentration C
radioactivity in the lesion is determined from the gamma image
using the appropriate conversion and correction factors :
C = h -1 . (A * -B *). RC -1 .V tum -1
,
where h [imp.
s-1 MBq-1] is the detection
efficiency (sensitivity) of the camera, RC is the so-called recovery
coefficient of correction for the "partial volume
effect" (mentioned above in the
section "Adverse effects of
scintigraphy", passage
"Partial volume effect"), Vtum [cm3] is the volume of the lesion.
Therefore, if we measure the value SUV
= 1 at some point in the image, the volume activity is
the same as the average activity in the whole body - it means
that the radio indicator is not captured
here. The higher the value of SUV > 1
we get, the more selectively the given
radioindicator accumulates in the given place, the higher
the metabolic activity of the respective tissue.
Either the SUVmax
calculated from the A*max value of the most intense pixel in the lesion image is
used, or the SUVmean (SUV50%) determined from the average value in pixels within the
area of interest (ROI) of the lesion, sometimes the SUV70% etc. If there is
otherwise an approximately homogeneous distribution of the
radioindicator outside the examined lesion, the SUVmax is approximately
equal to the contrast value Cimg and other SUV50 or SUV70 values can be determined simply as the ratio of the
number of impulses in the tumor (or its defined part - ROI) and
in the tissue background ("tumor to background ratio").
However, it is desirable to make a correction to the partial
volume effect using the RC recovery coefficients (as mentioned above).
SUV analysis is performed mainly on
PET images of 18FDGs and other radiopharmaceuticals with tumor
accumulation - see also §3.6, section "Diagnosis
of cancer". For medium
accumulating tumor lesion the SUV value is in the range of about
2 ¸ 5,
for the well and selectively accumulating tumors can then be
SUV> 10.
Note :
Quantification of SUVs with planar and SPECT
scintigraphy performed only quite rarely. SUV is
domain a primarily tumor scintigraphy,
PET (see below §4.3, section "Positron
emission tomography PET"),
which is mainly used to quantitate the accumulation of 18F-FDG. Here we
discuss the issue of SUV general terms in
connection with common properties of scintigraphic images and the
information contained therein.
Disadvantages and
pitfalls of SUV quantification
The determination of SUV can be a useful tool for assessing the
severity (metabolic activity, possible aggression) of tumors and
the effectiveness of the biological response to their therapy.
However, it is necessary to keep in mind even some pitfals,
consisting in the dependence of the obtained SUV
values on a number of circunstances and parameters :
¨ Particular, it is the exact actual
value of activity in relation to the calibration
of the meter applied activity and sensitivity
(detection efficiency) gamma camera. It also depends on the time
between application and examination, which by
radioactive decay and pharmacokinetics significantly affects the
amount of radioindicator accumulated in individual tissues,
including the examined lesions. Correction to this time can be
difficult because different types of tissues and tumors
accumulate the radioindicator at different rates. The
only way to minimize this time factor is to keep the same
time interval between application and scintigraphy. It
is also necessary to subtract the activity values remaining in
the syringe or tubing after application.
¨ Hydration and levels of metabolic
substances (eg sugars) in the patient's blood, functional state
of the kidneys, liver and other organs.
¨ It is also a dependence on the weight and body
constitution of the patient. In patients with the
higher the fat content, which accumulates very little in the
radiopharmaceuticals used, overestimates the measured
SUV values. This can be a problem when comparing different
patients with each other, or if a given patient changes weight
between exams. Correction of SUV to
patient weight can be performed approximately by normalization to
standard reference values of patient weight 70kg
and body surface area S = 1.75m2, using empirical
relationship between weight M , height H, body
surface area S and adipose tissue fraction: SUVM-corr = C/(Ainj) .43.8.M0.425.H0.725 .0.0072.
Due to this correction, the measured value of SUVM-corr in the shown
lesions is lower in more massive patients than the uncorrected
value of SUV, on the contrary it is higher in more subtle
patients.
¨ Marking of areas of interest (ROI) of
examined lesions on the scintigraphic image is individually
dependent and is not very reproducible. SUV values (especially SUVmean) are very sensitive to small
differences in the size and position of marked ROIs.
¨ Absorption of gamma radiation in the tissue,
causing attenuation of the signal from deeper
lesions (see section "Adverse
effects with scintigraphy and their correction"). The correction for
attenuation is not always accurate and reliable.
¨ Computer image editing - various kinds
of filters, methods and algorithms reconstruction by tomographic
images can significantly (and non-linear)
influence the accumulated number of pulses
in the evaluation of lesions and tissue background. This leads to
large arteficial differences in measured values
SUV.
¨ The effect of partial volume ( partial volume effect - as described above in
the passage " the volume and activity bias ") causes distortion
displayed lesions in terms of activity and size. To correct for
this effect, RC coefficients are used, which are
difficult to determine (obtained by phantom
measurements) and their values depend on
the imaging properties of a particular camera. To use them, it is
also necessary to know the diameter of the
displayed lesion.
Due to these difficulties in
determining a specific exact SUV value, this parameter is valid
only in comparative studies of larger patient
populations, where individual deviations and inaccuracies are randomized.
When comparing changes in scintigraphic images in a particular
patient, the SUV value (which in practice
cannot be determined with an accuracy of better than 30%) needs to be "taken with a grain of salt"..!..
Author's
skeptical note on SUV :
The importance of "accurate" absolute quantification of
SUVs using all sophisticated correction methods is sometimes overestimated.
To gain my own experience, I would like to recommend the
following experiment to colleagues : Try to
compare the SUV values determined by the above
complex procedure, with the values obtained from a simple ratio
of the number of pulses from the ROI in the lesion
image and the number of pulses in the ROI of a suitable reference
healthy tissue. The relative results will be very
similar, at least in terms of assessing the severity of
the metabolic activity of the tumor and the biological response
to therapy..?.. - I welcome your experiences ...
Relative SUV
These pitfalls of accurate SUV determination show that identical
conditions cannot be maintained in practice during
repeated scintigraphy of the patient before and after therapy.
Therefore (in connection with the above
note) the relative SUVrel is
introduced as the ratio SUVrel = SUVtumor / SUVreference tissue , where all problematic values of applied activity,
detection efficiency, partial volume effect, patient weight,
application time are truncated. We basically get
the value of the tumor / background ratio expressing
the relative rate of uptake of the radiolabel in the analyzed
lesion compared to the tissue background. The SUVrel can be obtained
from the scintigraphic image very simply by comparing the number
of impulses from the lesion ROI and the ROI of a representative
tissue background (eg liver or aorta ROI is
used as reference tissue; identical ROI must be observed when
repeatedly evaluating the same patient) .
Technical failures of scintillation cameras
With such a complex electronic device as a scintillation camera,
there are many possibilities for mild and more serious technical
failures. We will mention here only some disorders specific to
gamma cameras. In terms of their location, we can divide them
into two groups :
1. Disorders of electrical power supplies and
mechanical movements of the camera
Electrical power supplies for cameras are often burdened with
long-term power, they become hot, cooling fans "get
stuck", ....
Current gamma cameras in their electro-mechanical part
contain a number of sensors, regulation and control circuits,
which is certainly correct in terms of successful and safe
operation of the device. Sometimes, however, it is too
"recombined", so that even an insignificant deviation
can lead to blockage of mechanical movements and thus the
practical unusability of the camera, with the need for service
intervention.
2. Disorders of imaging properties in the field of
view of the camera
Practically all these disorders can be clearly seen in the image
of homogeneous distribution of gamma radiation (whether it is a homogeneoussource, or irradiation of a
crystal without a collimator with a point source from a
sufficient distance - see "Phantoms and phantom
measurements" , section
"Testing and calibration of camera
image homogenity") :

When properly functioning, the image of the homogeneous
distribution of radioactivity should also be homogeneous
(Figure a), with the only permissible deviations resulting from
statistical fluctuations of the accumulated number of pulses due
to quantum-stochastic processes during the emission of gamma
photons.
Local circular outage (mostly sharply demarcated, often with a visible hem) in the field of view is the result of interrupted
detection by scintillation from a specific location of the camera
crystal. The cause can be either a failure of the respective photomultiplier,
or its preamplifier or some other circuit
through which the detected pulses pass. In Figure b is
a failure of one peripheral photomultiplier. Repairing a
preamplifier is not a bigger problem. However, replacing a
defective photomultiplier is technically very difficult. After
the electrical disconnection, the photomultiplier must be
carefully "peeled off" from the silicon grease
(ensuring optical contact with the scintillation crystal light
guide), thoroughly clean the area and stick with silicone a
specially selected photomultiplier with the same properties as
other photomultipliers. This work will take an experienced
electronics woker all day, including subsequent adjustments and
the resulting calibrations of the camera detector.
A series of minor inhomogeneities in
Figure c, corresponding to the positions of the
photomultipliers, may not indicate a malfunction, but are usually
caused by misalignment - "detuning""-
positions of photopeak from individual photomultipliers. After
proper adjustment - "tuning" - and the
creation of a new homogeneity correction matrix, we usually
obtain a homogeneous field of view.
The most serious accident of the
scintillation camera is cracked crystal. In the
image of the field of view, it appears as a distinctive irregular
(zigzak or branched) line of pulse outage, with a positive rim
(Fig. d) This fatal failure can occur in basically two ways :
×
By mechanical pressure
or impact on a very brittle crystal.
It is enough for a screwdriver, phantom holder or other object
heavier than a few grams to fall on the crystal without a
collimator. When replacing collimators, the crystal may break
when there is a foreign object on the mounted collimator, for
example a pencil ..!..
×
Thermal stress
when the temperature of the crystal changes unevenly or rapidly.
Larger temperature gradients due to thermal expansion can cause
considerable mechanical stresses in the crystal, which can result
in cracking. The crystal is particularly temperature sensitive
when the collimator is removed. In this situation, it is not even
recommended to open windows in the room or turn on the air
conditioning.
A cracked crystal is an irreparable
defect in a scintillation camera. The entire detector must be
replaced (crystal +
photomultipliers + preamplifiers) for a new
detector, assembled in the factory. This is a costly
affair, over $ 100,000 !
New
and alternative physical and technical principles of gamma
cameras
Practically the only type of scintillation cameras used so far in
nuclear medicine are Anger-type cameras
described above (of course with the
exception of PET cameras
described below in §4.3 on tomographic scintigraphy). Despite the clear success of the use of these cameras
in nuclear medicine, two basic disadvantages of
this solution were also known from the very beginning. The first
is the need to use a lead collimator, through
which only the radiation g passes in a precisely defined direction, but the vast
majority of incident photons are captured in the partitions
between the holes Þ low detection efficiency (sensitivity)
of camera. The second disadvantage stems from the limited
accuracy with which a system of photomultipliers and electronic
circuits is able to locate the position of a scintillation flash
in a large-area scintillation crystal Þ
imperfect spatial resolution.
Therefore, since the 1970s, alternative
physical-technical solutions of scintillation cameras
have been designed and experimentally tested, eliminating the
first or second disadvantage, or both at the same time. These
alternative solutions have not yet gone beyond laboratory
experiments, but with the development of technologies in
the field of microelectronics and new materials, there is a real
hope in the near future to bring some of these constructions into
a practically usable form, or even to replace existing
scintillation cameras in the more distant future...
Wired
cameras
Wireframe cameras are based on the simple principle of a
position-sensitive multi-wire ionization chamber,
which was developed for monitoring and displaying traces of
particles formed during interactions in accelerators (see §2.3,
section "Drift ionization chambers"). The
detector itself is made up of a large number (even several
hundred) of thin wires - electrodes stretched in a gas charge in
two layers in a mutually perpendicular direction - determined by
the X, Y coordinates. When a photon radiation g enters, the ionization occurs at the
appropriate site. The electron cloud drifts from this point to
the nearest electrodes, where an electrical signal is generated.
The intersections of the electrodes thus received signal the
location of the interaction of the detected photon. The
ionization cloud of electrons can reach several nearby
electrodes; the evaluation electronics then determine the
coordinates using the weighted averages of the signals from the
various electrodes. The point of impact and interaction of the
photon can be determined with an accuracy of about 0.1 mm.
Cameras of this type are especially suitable for imaging with
low-energy radiation g .
Semiconductor multidetector gamma cameras
One of the basic factors limiting the internal resolution of an
Anger scintillation camera is the uncertainty with which a system
of photomultipliers and subsequent electronic circuits is able to
locate the position of a scintillation flash in a large-area
scintillation crystal. Therefore, the internal resolution of the
Anger camera cannot be reduced below approx. 3 mm in practice.
The concept of a multidetector
camera is that instead of one large-area scintillation
detector equipped with a number of photomultipliers, many
separate miniature detectors - pixel semiconductor detectors (see §2.5 "Semiconductor detectors") are used, placed in a matrix next to each other. Gamma
radiation is transferred directly here to
electrical signals without the need for scintillators and
photomultipliers. The signal from each of the detector is
processed independently (in
multiplexed mode), whereby the positional
coordinates (x, y) are determined simply by the position (i, j) of the
mini-detector in the detector array, and lead directly into the
pixel array in the computer (the pixel to
pixel ) - fig.4.2.10 :

Fig.4.2.10. Principle of multidetector semiconductor camera.
Left, center: The crystal of a
multidetector camera consists of a large number of regularly
arranged miniature semiconductor pixel detectors. Right:
Special arc configuration of semiconductor CZT detectors and
multi-pinhole collimators for SPECT myocardium.
Photon detection is performed in individual
pixels independently, so the internal spatial resolution is given
by the size (pitch) of the detector pixels (unlike the Anger camera, where the coordinates of
scintillation are determined triangulation according to the
response of different photomultipliers). If
a sufficiently dense grid of pixel detectors is created, we can
achieve a very good internal spatial resolution (even below 1mm); the total
resolution then depends on the collimator used. Optimized
collimators for multipixel semiconductor cameras should
have square apertures the size of pixel
detectors (minus the thickness of the
baffles), which would geometrically overlap
with the detection pixels with their apertures everywhere in the
field of view.
So far, this type of camera has been
produced only with a small field of view of about 5 x 5 cm, for a unique
use for scintigraphy of small objects (small
laboratory animals), now it is beginning to
be produced in the standard size of classic cameras. This
category also includes electronic imaging detectors for X-rays,
so-called flat-panels (described
in §3.2, section "Electronic
imaging of X-rays", flat
panels with "direct conversion", which probably belongs
to the future...). Gradually, planar and
SPECT cameras of standard dimensions with semiconductor detectors
are also being used.
For this semiconductor
gammagraphy (planar and SPECT
"scintigraphy"), semiconductor
CZT (Cadmium-Zinc-Tellur) detectors have
proven. Cadmium and zinc CZT telluride is a
semiconductor detector operating at room temperature,
which converts gamma and X-rays directly into electrical impulses
with high efficiency (physical aspects see
§2.5 "Semiconductor detectors", passage "Cadmium-Zinc-Teluride
(CZT) detectors" ). A comparison of the average basic parameters of a
standard Anger camera (with NaI(Tl)
scintillation crystal and photomultipliers) and
a semiconductor camera with CZT detectors (2.5
mm in size) is in the following table :
| Camera type | Internal spatial resolution | Detection efficiency (for 99mTc) |
Energy resolution | Max. pulse frequency |
| Anger camera with NaI (Tl) | 4 mm | 60 cps / MBq | 10% | 3 . 10 5 cps |
| Semiconductor CZT camera |
2.5 mm | 85 cps / MBq | 6% | 6 . 10 5 cps |
Thus, compared to conventional Anger cameras, semiconductor
CZT cameras have better spatial resolution
and energy resolution, slightly higher detection efficiency
(sensitivity) and shorter dead time of detection.
The use of CZT
detectors for positron emission tomography of PET
is also promising, instead of BGO/LSO scintiblocks with
photomultipliers (see below "Positron
emission tography of PET",
Fig .4.3.5). In addition to better detection efficiency and spatial
resolution, a somewhat shorter coincidence time can be achieved (for better TOF). So far, it is
being tested experimentally on smaller PET models. The advantage
of semiconductor detectors is also theirs independence
from the magnetic field, which allows use in hybrid PET/MR
systems.
In nuclear cardiology, stationary semiconductor
CZT (Cadmium-Zinc-Tellurid) cameras with a
special "cardiofocal" detector arrangement are
beginning to be used for SPECT of the myocardium
( Fig.4.4.10 on the right). The detectors are placed in
the camera gantry along an arc covering an angle
of approx. 90-180°. The detectors are equipped with "multi-pinhole"
collimators directed cardiofocally into the center of the gantry.
Unlike the classic rotary SPECT (described
below "Tomographic scintigraphy SPECT"), data storage takes place stationary,
detectors and collimators are in a fixed position relative to the
patient's body, all SPECT projections are obtained simultaneously.
This achieves higher detection efficiency and faster processing.
However, it is a single-purpose device for SPECT
myocardium in cardiology.
Advanced universal
stationary semiconductor SPECT cameras are being
developed - see below "SPECT Stationary Multidetector Cameras".
Compton cameras
In the paragraph on adverse effects of scintigraphy, we
classified Compton scattering of g- rays in tissue as an adverse
efect that worsens the quality of scintigraphic images.
However, with the appropriate mechanical configuration and
electronic interconnection of two or more detectors, Compton
scattering g in the detection system itself can, in principle, be
used for "electronic collimation" and
imaging of the field of radiation g without the use of
mechanical collimators (using the
Compton scattering for gamma imaging, suggested Everett, Fleming,
Todd and Nightengale in 1977). The
principle of operation of such a so-called Compton camera
is schematically shown in the following figure 4.2.11 :
Fig.4.2.11. Schematic representation of the principle of
electronic collimation using energetic-angular reconstructions of
the paths of primary ( g ) and Compton scattered ( g' ) gamma-ray photons.
The camera itself consists of two (or several)
consecutive detectors providing positional and energetic
information about the detected quantum g :
In the first thin detector 1
(replacing the classical lead collimator) occurs a Compton
scattering of photons of incoming radiation g (by different angles J), which then
continue their movement to the second more massive detector
2, where they are fully absorbed.
In the coincidence mode, the positional coordinates of the impact
of the primary photon g (x1, y1) and the energy E1, transmitted to the electron at Compton scattering in
the first detector are detected, as well as the positional
coordinates of the impact (x2, y2) and the energy E2 of the Compton scattered photon g' absorbed in the second
detector. Based on the geometric comparison of the positions (x1, y1) of the primary and
(x2, y2) scattered gamma
photons, the angle J of the compton scattering is determined. This angle J is then related to
the energy E1 of the Compton scattering and the energy E2 of the scattered
radiation g', which allows (according to the relation for the
angular-energy distribution of Compton scattered radiation Eg ' = Eg / [1 + (Eg / moe c2). (1 - cos J)], given in §1.3) to kinematically reconstruct
the path of the photon to determine the incidence angle j at which the
primary photon g flew to the first camera detector from its source.
Photopeak measurement Eg = E1 + E2 then it makes it possible to
eliminate those unwanted photons which were scattered by Compton
before coming to the first detector, similarly to Anger's camera.
This creates an incident
cone with a vertex at (x1, y1) and an apex angle J, on the mantle of which lie the possible trajectories
of the incoming photon. The set of these incident cone shells
from individual detected photons can then be used for computer
reconstruction of the resulting scintigraphic image of
radioactivity distribution in the scanned object:
in the matrix of the reconstructed image are summation occupied
the "pixels" corresponding to the intersection of
individual conic sections (ellipses, circles), arising from the
projection of incident cones into the plane
(Fig.4.2.11 on the right is an example of the reconstruction of
the image of a point source, arising as an intersection of
elliptical projections of incident cones of photons emanating
from this source).
In the scattering detector 1,
a multidetector system of semiconductor detectors Si, CdTe or
GaAs with a thickness of about 5 mm is used, a high effective
cross section for Compton scattering is required here. The
absorption detector 2 can be an Anger crystal
system NaI(T1) or BGO or LSO with photomultipliers and
electronics evaluating the position of the flashes. However, even
in this second detector, it is advantageous to replace the Anger
camera with a semiconductor multicrystalline detector. In
addition to spatial and energetic resolution, for the good
operation of the Compton camera, high demands are also placed on
the temporal resolution of the coincidence
(similar to PET detectors - see §4.3).
Compared to mechanical collimators, electronic
collimation can lead to a significant improvement
in detection efficiency (sensitivity), as g photons are used
from a much larger spatial angle (electronic collimation, but of
a different kind, is of great importance in positron emission
tomography, see PET below).
Apart from laboratory experiments, Compton's
cameras have not yet been implemented,
they will probably remain only a physical-technical interest....
High-energy gamma cameras
The need to imaging the distribution of high-energy g radiation arises
mainly in two areas :
×
1. Gammagraphic imaging of the distribution
of radioactive substances emitting hard gamma radiation
(their distribution in samples, tissues and organs), or depicting
the distribution of atomic nuclei excited by external
radiation that emit high-energy radiation g during
deexcitation (such as the NSECT method - see "Neutron- stimulated
emission computed tomography"
below). However, this is a relatively marginal issue ...
×
2.
Gamma-telescopic
imaging sources of gamma radiation in space -
supernovae, neutron stars, accretion disks around black holes (see eg "Astrophysical significance of
black holes" in the book Gravity,
black holes and space-time physics ) and other turbulent astrophysical processes; on g radiation from
space, see also §1.6 "Cosmic radiation",
section "Cosmic X and gamma radiation".
Imaging with high-energy gamma rays - hundreds of keV to
tens of MeV - is much more difficult than with soft g -radiation (60-500keV). For such energies, the
collimators have poor spatial resolution and luminosity due to
the significant cross-radiation trough the septa between the
holes, and the scintillation crystals of standard gamma cameras
used are too thin to achieve reasonable detection efficiency. A
suitable solution here is the above-mentioned principle of the Compton
camera, in a modification optimized for high energies. A
simpler type of Compton telescope, used on space
stations to detect g- rays from space sources, consists of a larger ionization
chamber (drift wire or projection) in which are measured the
energy of the scattered g- rays and reflected electrons, as well as the direction
of scattered radiation or reflected electrons.

Fig.4.2.12. Some principles of gamma cameras for high energy.
Left: Combined Compton-Anger high
energy gamma camera. Right: 3-Compton
gamma-telescope with many detection layers.
Fig.4.2.12 on the left
schematically shows the principle of operation of a combined
Compton-Anger gamma camera for high energies. Detetion sensitive
camera volume consists of ionization drift-time
projection chamber (TPC - Time Projection Chamber)
with a gas filling (the ionization detector, see §2.3 "Ionization Chamber"). When a high-energy photon g flies into this working
space, a Compton scattering in the gas filling
mainly occurs, for higher energies also the formation of
electron-positron pairs, followed by annihilation of a
positron with an electron to emit a opposite - pair of gamma
photons with energies of 511keV. The path of reflected or paired
electrons is sensed based on the ionization electrons that these
high-energy particles generate along their paths. They are
detected by a matrix of several hundred miniature pixel
ionization chambers, working in proportional or Geiger
(avalanche) mode. Or semiconductor detectors can be used. This
cell matrix forms a 2-D position sensitive electron detector. The
ionization electrons from the individual paths of the fast
charged particle drift into different chambers (perpendicular
projection of the path into the nearest chambers) for different
lengths of time; by evaluating these geometric and temporal data,
the 3-D path of reflected or paired electrons and positrons in
the chamber space can be reconstructed. The working chamber is
surrounded on all sides by scintillation crystals with
photomultipliers (Anger camera), scanning
Compton scattered and annihilation photons, with scintillation
positioning and radiation energy. By a complex coincidence
evaluation of pulses from the matrix of pixel detection chambers
and from the photomultipliers of the Anger camera, it is then
possible to geometrically reconstruct the direction
(angle) from which the detected primary high-energy photon g arrived - to
realize gamma-ray imaging .
Fig.4.2.12 on the right shows the
principle of a gamma-telescope based on repeated Compton
scattering in layers of position-sensitive semiconductor
detectors. The system consists of several layers of flat
position-sensitive (2-D) detectors, stacked at equidistant
distances. After the entry of the primary g -photon with energy Eg1 is scattered by Compton in one of the detectors, which
is accompanied by a position pulse and an amplitude pulse
carrying information about the energy loss DE1 that the photon left in the detector during scattering.
The scattered photon continues to fly at an angle J1 with energy Eg2 = Eg1 - DE1,
after which it can be further scattered by Compton in another
detection layer, providing the appropriate position pulse and
energy pulse DE2.
The photon scatters by an angle J2 and continues with the energy Eg3 = Eg2 - DE2. Thus, repeated
multiple scattering can occur until the photon leaves the
detection space. Coincidence evaluation of position coordinates
in individual detection layers determines scattering angles J1 , J2 , J3 , ...., evaluation of pulse amplitudes determines
energy losses DE1,
DE2, DE3, ... These data
substitute into Compton 's equations
Eg2 = Eg1 /[1 + (Eg1 /moec2).(1 - cos J1)] ; Eg1 = DE1
+ Eg2 = DE1 + {DE2
+ [DE22+ 4moec2.DE2/(1-cosJ2)]1/2/2} , .... ,
which allows kinematic and geometrical reconstruction of the
photon path - will provide the required value of the angle J of the incident cone,
under which the primary g- photon flew into the detection system. And further
reconstruction by intersecting a set of projections of incident
cones of all registered photons, the resulting g- telescopic
image of the source from which the photons were emitted
is obtained. The advantage of this arrangement is that to
reconstruct the angle of incident g-photon does not need its
complete absorption in a heavy "calorimetric" detector
to determine the total energy. The energy of the incident photon
is determined by measuring the position of the first three
interactions and the energy delivered in the first two
interactions.
Thus, it is sufficient to obtain at
least a 3-fold Compton scattering, the analysis of which can be
used to reconstruct the incidence angle J - hence this system is
sometimes referred to as the 3-Compton telescope.
The analysis of possible further scatterings refines the
reconstruction. In the individual layers of flat
position-sensitive detectors it is possible to use either
ionization wire chambers, or better germanium or silicon semiconductor
drift detectors, which have good energy and image
resolution.
To imaging gamma radiation very
high energies, hundreds of MeV to hundreds of GeV,
special particle detectors of electron-positron pairs
are used in an arrangement similar to Fig.4.2.12 on the right.
The g- rays
first fall on a plate of heavy material (tungsten), where they
are converted into electron-positron pairs, flying almost in the
direction of the original photon g. Their paths are then
monitored by layers of position-sensitive 2-D silicon detectors
(trackers), which determines the direction from which gamma
radiation came. Finally, they transfer their energy to a
calorimetric detector located below the last detection layer,
which detects the energy of the g- quantum.
4.3.
Tomographic scintigraphy
Every living organism is a three-dimensional
object and the distribution of a radioindicator has the same
character. A planar scintigraphic image, which is a
two-dimensional projection of an object, can therefore capture
only part of reality. From the planar scintigraphic image we
cannot find out anything about the distribution of the
radioindicator in the "deep third dimension",
perpendicular to the front of the collimator. Planar
scintigraphic images have serious pitfalls in this respect - the
possibility of overlapping and superposition of
structures stored at different depths. Althout we help
here by displaying in several different projections, the risk of
a false finding or non-detection of an anomaly in the depths of
the organism, covered by another structure, can never be ruled
out. The superposition of radiation from different depths of the
imaged organism further leads to a reduction in the
contrast of the imaging of the lesions, which are
overlapped in the planar image by radiation from the tissue
background thus formed.
To overcome these disadvantages of planar
scintigraphy and to obtain a complex image of structures at
different depths, tomographic scintigraphy *)
has been developed to provide a three-dimensional image
of the radiolabel distribution. One of the main advantages of
tomographic imaging is significantly higher contrast
imaging of lesions (up to 10-fold) that do not overlap with
tissue background radiation on transverse sections.
*) Greek tomos
= section - the tomographic image consists of certain sections,
mostly transverse, a larger number of which create a
three-dimensional image.
Some basic principles, especially geometric
and reconstructive, have all tomographic methods in common. X-ray
transmission tomography CT was described in §3.2 "X-ray
diagnostics", part "Transmission
X-ray tmography (CT)",
where the development of tomographic methods in general is also
mentioned.
Technical development of gammagraphic
tomography
Efforts to achieve in-depth tomography imaging began shortly
after the introduction of scintigraphy in the 1960s and 1970s.
The foreruner of contemporary gammagraphic tomography SPECT in
the 1970s was movement tomography (Fig.4.3.1
left): the examining table with the patient and
the collimator of camera with inclined holes (slant holes)
using the electromotor synchronously rotated in such a
way that, for a layer in a "focal" depth, both
movements were compensated and a sharp image was
obtained, while in the other layers (above and below the focal
plane) the image was motion blurred and thus it was
darker and less distinct. Against the background of these blurred
and darkened areas, sharper and more clearly displayed structures
from the focal plane were better visible. The depth position of
the focal plane was set by the radius of rotation of the lounger
on the eccentric of the lounger motor. However, the quality,
contrast and depth effect of such an image were not great
(completely incomparable with SPECT). An image of only one longitudinal
layer was obtained at a time, in order to create an image of
another focal layer, it was necessary to change the radius of the
sliding rotation of the lounger and start a new acquisition. More
detailed tomographic imaging in multiple layers was therefore
time consuming. This method has long been abandoned.
Fig.4.3.1. Early attempts to implement tomographic scintigraphy.
Left: Movement tomography with rotating slant-hole
collimator and rotating lounger. Middle:
Coincidence tomography using g-g
angular correlation. Right: SPECT
on a stationary planar gamma camera with patient rotation.
Interesting experiments
were also performed with 2-photon coincidence tomography
using g-g angular correlations between
the emission of cascade pairs of gamma photons in some
radionuclides (§1.2, part "Gamma radiation",
passage "Angular correlations of gamma
radiation") - Fig.4.3.1 in the middle. Another gamma detector, or in
a more advanced version another gamma camera with a slit
collimator, in a coincidence connection was attached to
the basic imaging gamma camera at a certain place and at a
suitable angle q (eg 90°). To create the image, only pulses originating
from the simultaneous arrival of a pair of cascading gamma-quanta
into both detectors were registered. Thus, only one longitudinal thin
layer was displayed, defined by the detection angle of the
auxiliary coincidence detector (or a larger
number of independent layers when using a coincidence camera with
a slit collimator). However, the palette of
suitable isotopes exhibiting cascade deexcitation with angular
correlation of the gamma-photons emitted is very limited and the
detection efficiency of the coincidence system has been very low.
This method did not go beyond laboratory experiments; however, in
a sense it can be considered the ideological forerunner of
positron emission tomography. Namely, only a perfect angular
correlation of 180° between a pair of annihilation
photons in electron-positron annihilation, it has found wide
application in coincidence positron emission tomography,
see PET below.
The first attempts at SPECT
gamma tomography were performed in the
1960s and 1980s at a some workplaces with planar Anger cameras (the first tomographic image was presented by Kuhl and
Edwards in 1963). Since the (planar)
cameras at the time did not have gantry and could not rotate, the
patient turned - Fig.4.3.1 right. In
front of a vertically set stationary camera, the patient sat on a
swivel chair with a marked angular scale (goniometer). A planar
image was taken, the chair and the patient were rotated by a
certain angle, another image was accumulated, etc. - approx.
16-64 images for a sequence of angles 0-360°. This was followed
by computer reconstruction by back projection into transverse
sections. This method, despite its mechanical clumsiness,
has in fact already enabled full-fledged SPECT imaging - with the
limitation that at that time not yet sufficiently complex
software for the reconstruction of transverse sections and their
processing had been developed.
The mouting of gamma cameras on gantry
with the rotation of the camera around
the patient then became a truly successful and routinely used
method of SPECT tomography (as described below). Recently, stationary SPECT multidetector cameras without rotation have been developed, which is likely
to replace the clumsy rotating SPECT.
Author's note:
In the 1970s , we also performed early attempts at tomographic
imaging according to Fig.4.3.1 at our Department of
Nuclear Medicine KNsP in Ostrava-Poruba. Our first Pho
Gamma HP gamma camera (Nuclear Chicago) with the CLINCOM
evaluation device from 1974 was equipped with a rotating Slant
Hole collimator and a rotating lounger for motion
tomography (Fig.4.3.1 on the left). Experiments with gg coincidence
tomography we performed on a Pho Gamma HP camera with the
help of a perpendicularly oriented collimated scintillation
probe, connected in coincidence to the flow of scintigraphic
pulses (we did not have an additional gamma camera with a slit
collimator). We also tested the improvised SPECT with a patient
in a swivel chair on a Pho Gamma planar camera, with the then
latest computer evaluation device GAMMA-11 and our own developed
software.
Unlike X-ray
transmission tomography CT, where the image is created by the
passage - transmission - of X radiation through the
body, scintigraphic tomography creates the image by detecting
radiation emitted from a radioindicator
inside the body. Radionuclide emission computed
tomography (ECT) is of two types :
1. Single-Photon
Emission Computerized Tomography
SPECT, using g- radionuclides
registers only one emitted gamma radiation
photon from each radioactive transformation .
2. Two-photon Positron Emission
Tomography of PET, using
positron (beta+) radionuclides, resp. the resulting annihilation
radiation, where two photons emitted during
annihilation are always detected at the same time
(coincidentally).
In both cases, the resulting
tomographic images are obtained by computer
reconstruction after scanning the pulses from the photon
detection. We will discuss both tomographic methods in this order
1. , 2.
Tomographic
scintigraphy SPECT
The most common method of
tomographic scintigraphy is the so-called single-photon
emission computed tomography SPECT (Single
Photon Emission Computerized
Tomography). Its principle is shown in Fig.4.3.2
:
Fig.4.3.2. The principle of capturing
scintigraphic images of the examined object W (here the
brain) at different angles by a rotating
SPECT camera (left) and their computer
reconstruction into the resulting image W* of a
cross section of this object (right).
The basic
principle SPECT
The SPECT tomographic camera differs from the conventional planar
camera only in that the special stand on which
the camera detector is mounted, so-called gantry
circular shape (Gantry = portal,
through load -bearing supporting structure), allows the motor-driven rotation of
the detector around of the examined object *) - the photograph of the SPECT camera is above in §4.2
in Fig.4.2.4 at
the bottom right. To speed up the
acquisition, two detection systems ("double-headed" SPECT camera) are most often installed on the common gantry (there were also cameras with 3 or 4 detectors, but it
didn't prove very well in practice...).
*) Occurs rarely also the
technical construction of a SPECT camera without a gantry.
The camera detectors are mounted on special arms equipped with servomotors,
allowing the detectors to move in space
in different directions and at different angles - with all
"degrees of freedom". By suitable electronic control of
the servomotors, it is then possible to achieve a circular
movement of the detectors around the examined object (around the
bed with the patient) during SPECT.
The new stationary SPECT multi-detector cameras have a completely different principle .
Acquisition of SPECT
Own tomographic scintigraphy SPECT
then takes place in such a way, that the camera gradually orbits
*) around the examined object and at a number of
different angles captures (planar) scintigraphic images
of the examined object - the number of these projections
is usually 32, 64 to 128 images at angles 0°-360° - Fig.4.3.2
left. [ Note:
In some cases, a smaller range of angles is
used - some projections, the quality of which would be degraded
by increased absorption (attenuation) of g- radiation and would not
contribute to the resulting reconstructed images (they could
rather cause deterioration), are not captured. Such is the
situation with myocardial SPECT , which is sensed by a range of angles from 90 to
270°, while the angles between 0-90° and 270-360°,
corresponding to the rear and right side projections, the images
due to a significant attenuation of radiation g are not taken.]
*) The SPECT stationary
multi-detector cameras without
rotation are mentioned below.
Orbiting
detector camera around the object to be examined is usually a stepper
( step-by-step ) - the camera rotates a certain angle
and stops, the corresponding projection is acquired for a preset
time, then it rotates again by a given angular step and the next
image is acquired. Continuous rotation of the
detector with continuous acquisition is rarely used. From the
geometric point of view, may detectors orbit circular
- which is used more often, or elliptical (non-circular),
with event. using the "auto-countouring"
system (mentioned above in the section
"Design of scintillation
cameras"), in order to better "copy" the body surface
and keep the shortest possible distance of the camera collimator
face from the displayed structures (to
achieve the best possible spatial resolution).
Collimators for SPECT
Orbiting cameras during the acquisition of SPECT are usually
equipped with standard collimators with parallel holes,
the same as used in planar scintigraphy: for 99mTc it is mostly HR
collimator, for 131I HE collimator, for 123I MediumEnergy
collimator. Sometimes they are used special collimators
with a different hole geometry: the FanBeam
collimator for SPECT of the brain, or a convergent
collimator for SPECT of the myocardium. All of these
types of collimators have been described in more detail above in
the "Scintigraphic
Collimators". For stationary multidetector SPECT cameras are used Pinhole type
collimators (or special mechanically
movable collimators which, however, it is only a temporary
solution ...).
Reconstruction of SPECT images
From this series of planar scintigraphic images - projections -
taken at different angles (these are planar
projections of the distribution of the radioindicator to
different angles) are then computer
reconstructs the image of the distribution of
radioactivity in the imaginary cross section,
guided by the examined object in a plane perpendicular to the
axis of rotation of the camera - Fig.4.3.2 on the right. SPECT
computer reconstruction methods are described below in the
section "SPECT computer
reconstruction".
Such a reconstruction can be
performed for each row of the image matrix of angularly scanned
images, so that a whole series of "stacked side by
side" cross-sectional images is created in the computer's
memory - a kind of three-dimensional "cylinder" (for cameras with circular field of view) or "cube" (resp. square
- for cameras with a quadrangular field of view), representing a three-dimensional image
distribution of a radio indicator in the examined object. The
cells of this three-dimensional image already have a volumetric
character and are called "voxels" (volume-pixels).
With this three-dimensional image in
computer memory, we can use computer graphics
methods to guide and display sections in any direction
on the monitor - not only primary transverse sections, but also
longitudinal and oblique sections, we can make various geometric
reorientations and other adjustments to show the desired
structure as clearly as possible. Using computer graphics
methods, three-dimensional 3D images can be
created using suitable shading and perspective angular display
with a number of computer effects, which are artificial and may
not directly reflect reality, but are very illustrative and
effective, also for didactic purposes.
Example of 3D-imaging in myocardial scintigraphy.
SPECT
stationary multidetector cameras
The basic disadvantages of standard rotational
scanning of scintigraphic projections at SPECT are clumsiness,
slowness and low detection efficiency.
At each angle, only a small portion of the gamma photons (going in the direction of the current position of the
detectors) are registered, the other
photons emitted from the patient's body are lost. The detectors
slowly move to more and more angles; with a very long acquisition
time, the number of accumulated pulses in the images is
relatively low. We will obtain the required SPECT images only ext
post, after end the measurement and computer
reconstruction. For the rotation method it is not
possible to perform dynamic SPECT scintigraphy (except for myocardial perfusion, where this is allowed
by ECG-gating), or to operatively modify
the acquisition procedure.
Fig.4.3.3. The stationary SPECT camera
detects projections from all angles simultaneously using a large
number of circular multipix detectors. There is no any rotation.
The resulting data can be continuously reconstructed into
cross-sectional images.
To eliminate this disadvantage of
rotary SPECT, it is offered to use a larger
number of smaller imaging stationary detectors
- gamma cameras, placed in a ring around the
examined object, without rotation - Fig.4.3.3
left. All projections are then taken simultaneously from
all angles. The camera is compact, it
does not contain any moving parts, the use of photons for imaging
is much more efficient - even with lower applied activity, SPECT
examination takes significantly less time. Interfering mechanical
phenomena, such as displacements of the center of rotation, do
not apply here. Cameras with multiPinhole
collimators, multiDivergent, or multiParalel
collimators are being developed.
Here, SPECT tomographic images can
be reconstructed and displayed continuously
during the acquisition, Fig. 4.3.3 on the right (similar to planar
scintigraphy and PET ), which also enables dynamic
SPECT scintigraphy. This type of camera is currently
being used in nuclear cardiology for SPECT myocardial perfusion (§4.9.4, section "Scintigraphy
of myocardial perfusion",
see also section "Semiconductor multidetector cameras" above). Stationary
compact SPECT cameras with multipixel semiconductor
detectors (described above "Semiconductor multidetector
gamma cameras")
undoubtedly belongs to the future, surely sooner
or later it will push out cumbersome SPECT
cameras with rotating detectors ..!..
Computer
reconstruction of SPECT
Sinogram,
Linogram
If we successively draw images taken at different angles J, the individual
points of the object in them will describe circles
with different radii (according to the
distance from the center of rotation). X
and Y - coordinates of these circular orbiting points will
describe sinusoidal (or cosine) curves
R.sin J with amplitude
given by distance R from the center of rotation. Their
brightness is modulated by the accumulated number of pulses in
individual pixels of angular projections. The set of all these
graphically represented coordinates of the curves of circulation
for all points in a given section creates an important 2D image
called a sinogram. It is created simply by
gradually taking selected lines (corresponding
to a given transverse section) from the individual projection
images and storing them "on top of each other" in a new
image - a sinogram. This is done for all projections (angles J). Sinogram has two
roles in tomographic scintigraphy :
1. It is used as a data format
(sinogram-file), into which the acquisition of primary
data from individual projection angles takes place at predefined
times per image. Some new gamma cameras (especially PET) can
operatively store data even in LIST mode (without
predefined time per frame), from which the sinogram can be
additionally created, with the possibility of computer editing.
Each row of the acquisition matrix - each transverse section -
has its own sinogram. Cross-sectional images (using the inverse Radon transform) can then be reconstructed from the sinogram data.
2. The sinogram display allows you to check
the correct course of the tomographic examination. Under
normal circumstances, the sinogram of each displayed active site
must have a smooth uninterrupted course ("wavy line").
Any patient's movement (which
may lead to deterioration or artifacts) during
SPECT acquisition is clearly seen on the sinogram as a discontinuity
in the smooth course. Sinograms are also used to test mechanical
disturbances during the rotation of detectors, such as
displacements of the center of rotation (see
below "Adverse effects of SPECT and
their correction",
passage "Mechanical instability of the axis of
rotation"). Based on
sinograms, unwanted movements can be corrected
by software.
 |
Examples of sinograms
(top) and linograms (bottom)
in SPECT scintigraphy. In the middle part there are transverse
sections . a) A point source at a distance R from the center of rotation on the sinogram describes a sinusoidal curve x = R.sinJ. The weak auxiliary source at the center remains motionless on the axis of rotation (x = 0). b) The displacement of the source in the radial direction during the acquisition is reflected in the discontinuity on the sinogram. c) Sinogram of 5 active lesions in Jasczak phantom. d) Example of sinogram and linogram of the SPECT brain for imaging dopamine receptors ("Scintigraphy of receptor systems in the brain") |
In tomographic imaging methods (SPECT, PET, or
MRI), a so-called linogram is sometimes
constructed - an image in which the summed rows from all primary
images are "stacked" as columns linearly
side by side. In SPECT, a linogram is created by summing all
rows in each of the projection images at individual
angles and saving the resulting summation row as a column
in a new image - the linogram. This is done for all projections.
Unlike sinograms, of which there are a large number (for each
transverse section), the linogram is one for the
entire tomographic examination. Computer methods for
reconstruction of cross-sectional images (inverse
Radon transformation) have been developed
by integration along the lines in the linogram. In some cases,
the linogram may also be used to assess the smooth running of the
SPECT examination with respect to movement artifacts or transient
electronic disturbances in the acquisition process.
Note: Universal tomographic
regularities
The regularities and relations between circular planar
projections at angles J and transverse tomographic sections (sinograms, Radon
transformations, reconstruction methods, formulas in Fig.4.34),
outlined in this part, apply not only to SPECT scanning by
physical camera rotation, but also to stationary SPECT, when PET,
CT or NMRI. They are basically universal and are
used in various imaging modalities.
SPECT reconstruction methods
The amount of data accumulated in
individual projections at different angles, implicitly
contains information about the spatial depth distribution. In
order to be able to explicitly display the depth
spatial distribution of the radioindicator in cross sections, it
is necessary to perform a computer reconstruction
of the accumulated "raw" data. Two methods
of computer reconstruction of accumulated planar images from
different angles to the desired transversal sections are used :
1.
Back-projection method
The analytical back-projection method by computer simulates
an inverse process to acquire the SPECT scintigraphy: As
if the camera detector emitted rays of radiation - of an
intensity modulated by the image (accumulated information in the
cell) - from each position (the angle where it was rotating and
from which it accumulated the relevant image) and from each of
its cells, back towards the object under investigation, where
these rays "draw" a cross-sectional image in an
imaginary image matrix located at the center of rotation. The
information contained in one given pixel of the image stacked
from a certain angle is transferred to all the pixels of the
emerging cross-sectional matrix located in a line perpendicular
to the detector. Different "intense" rays from
different angles then "irradiate" and
"occupy" individual elements (cells, pixels) with
differently large numbers as they pass through the created image
matrix, which add up when passing through other
rays (from other angles). In places where most rays of higher
intensity pass, "hot" places with a high accumulation
of impulses are created - they correspond to places with a higher
concentration of radioindicator in the examined object.
Fig.4.3.4. The process of acquisition of SPECT and reconstruction
of the transverse section by the method of filtered back
projection.
Thus, this method uses the back projection of
data from individual planar images into the originally empty
matrix, always at the angle at which the planar image was
created. The resulting matrix - the reconstructed image - is
created by direct addition of these projection data. Simple back
projection has the disadvantage of a higher disturbingly
structured background with the formation of
"star-shaped" artifacts (see below). In practice,
therefore, filtered back projection FBP (Filtered
Back Projectoion) is used, which is a variant of the inverse
Radon transformation, in which suitable filtration is
included. The relevant mathematical formulas are shown in
Fig.4.3.4, where the whole process of acquisition, filtration and
reconstruction of SPECT is shown from a mathematical point of view (3rd dimension is omitted) :
The examined
object (patient), whose cross section has the
distribution of the radio indicator A(x,y), is captured by the
camera in a series of projections at different angles J, thus creating
images of projections p(u). These images are then Fourier
transformed into the frequency domain and
the resulting spectra p(n) are multiplied by a filter composed of a RAMP filter
and a user filter (see "Filters
and filtering"). The
created filtered spectra pF(n) are then converted back to the spatial region by inverse
Fourier transform (filtered images of projections pF(u) are formed), after
which by the back projection (at the same angles
J) the resulting
image of cross section A´f (x, y) is formed.
The filtered back projection method
is the most used because it is relatively fast (fast Fourier transform algorithms are used, the values
of trigonometric functions are calculated in advance for discrete
values of angles, so that common arithmetic operations are then
used). However, in terms of the
relationship between the actual distribution of radioactivity
A(x, y) and the reconstructed cross-sectional image A´(x, y), it
is not exactly a mutually unambiguous representation - the image
is constructed not from local values in pixels, but by superposition
of projection rays. These projection beams are artificial
and leave traces in the resulting image, that do not
correspond to the actual distribution of radioactivity in the
object under investigation. This is most pronounced in the
vicinity of foci of increased deposition of radioactivity, where
converging projection beams form a "star-shaped"
artificial structure - the so-called star
effect. Although this star artifact is effectively
suppressed by a RAMP filter, various
"noodles" or "filaments" are always visible
in the images reconstructed by back projection (below in the figure on the left).
These disadvantages of retrospective projection are largely
eliminated by iterative reconstruction method. The RAMP
filter, which also acts as a "focusing" (emphasizes
details and edges in the image), is used in the reconstruction in
combination with a user "smoothing" filter to reduce
statistical fluctuations, noise, in the image. By a suitable
choice of this filter and its form-factors, it is possible to
achieve optimal contrast, detailing and noise reduction (it is discussed in more detail in the work "Filters and
filtration").
2.
Iterative reconstruction method
Iterative method *) of reconstruction seeks, by means of successive
steps - approximations - such a cross-section image that
would best correspond to the individual scanned projections at
different angles J. It is an algebraic reconstruction technique
(ART).
*) The Latin word "iteratio"
means "repetition"; these are
recurring cycles of successive approximations.
Iterative reconstruction takes place
in the following stages :
The iterations are repeated until a certain
(preset) convergence criterion is met, such as
the required accuracy or a preset number of iterations.
It could be expected that as the number of iterations
increases, the overall image quality will increase. However,
experience shows that this is true for about 4-8 iterations.
A higher number of iterations then only increases the statistical
fluctuations, i.e. the signal-to-noise ratio worsens.
Compared to the
back-projection method, the iterative method has the basic
advantage **) that no star artifacts are formed (RAMP type filters are not used here). Also in areas with low radioactivity (near
background), the cross-sectional images are "cleaner"
and more contrasting - they do not contain "filaments"
as remnants of backscatter beams. Another advantage of iterative
reconstruction is the possibility of introducing some corrections
directly into the reconstruction algorithm - correction for
collimator properties, dependence of resolution on distance from
collimator ...
**) However, "no
wonders" can be expected from the iterative method of
reconstruction when processing SPECT images in routine clinical
practice. - the difference from the back-projection method is
often not even noticeable, as the image quality is primarily due
to insufficient statistics, camera resolution, scattering and
other disturbances (mentioned below) with which no reconstruction
method "will do nothing"...
The iterative method of reconstruction is
much more demanding on the number of arithmetic operations, so it
could be routinely used only with the development of sufficiently
fast computers (using coprocessors) with a high memory capacity.
Improved variants of
iterative reconstruction
In order to streamline and speed up iterative reconstruction,
some newer variants and modifications of the basic iterative
procedure have been developed :
EM (Expectation Maximalization) - finding the
best estimate of the image by statistical methods ........
ML (Maximum Likekihood) - estimating maximum
likelihood principle ......
MLEM ( Maximum Likelihood
Expectation Maximization) - iteration
procedure with a preset number of iterations: before the start of
the reconstruction, the number of iterations is preselected for
which we assume the optimal image quality.
OSEM (Ordered-Subset Expectation Maximalization) - the
set of all projections is first regularly divided into several
smaller groups (subsets) and the iteration step is
applied to individual subsets separately. The sub-iteration of
each subset serves as an input estimate for the iteration of the
next subset. One complete iteration step is an iteration cycle
across all subsets. The product of the number of subsets and the
number of iterations in each of them determines the effective
number of iterations . From a computational point of view,
the OSEM method is approximately as many times faster
as the number of subsets we use.
SART(Simultaneous Algebraic Reconstruction
Technique) - works simultaneously on multiple sections of a 3-D
image ............
OSSART - combination of OSEM and SART methods
............ ... ..... add .........
Hybrid reconstruction of
SPECT-CT ?
Some new SPECT / CT
hybrid systems attempt to improve the quality of SPECT
images through special iterative reconstruction, integrating
SPECT and CT data during reconstruction using local ("zone")
CT density maps of soft tissues, lung or adipose tissue, and bone
tissue. These zone CT density maps define tissue boundaries and modulate
their coefficients ("remodel") the primary
scintigraphic data of the radiotracer distribution. This achieves
a sharper boundary of bone tissues and lesions - provided that
these tissues take up the radiopharmaceutical
(eg 99m-Tc phosphonates). This modulation may also more
significantly show the differentiation between cortical and
spongy bone in the vertebrae and flat bones, or between the
cortex and cavity in the long bones. Simply put, modulation by CT
coefficients gives the SPECT images of the radio indicator
distribution a higher contrast .
A slight improvement in the quality of the
images is visible, but the model dependence is debatable
here (confrontation with classical reconstruction is
desiderable!).
Advantages
of SPECT
Compared to planar scintigraphy, SPECT tomographic scintigraphy
has three advantages :
¨ More
precise determination of the anatomical position of structures
and their shape in a three-dimensional image, when viewed from
different angles.
¨ Better
separate display of lesions lying behind each other at different
depths.
¨ By
suppressing the superposition of radiation from overlapping
layers, a significantly better image contrast is achieved, which
enables more sensitive recognition of small lesions even at
greater depths.
Adverse influences when SPECT and their
correction
As mentioned above, the main advantages of
tomographic scintigraphy are the provision of a clear complete
image "from all sides" (3-dimensional image) and a
significantly higher contrast of the imaging of
the lesions against the tissue background. However, we will also
mention some disadvantages and pitfalls
of SPECT scintigraphy.
As with planar scintigraphy, SPECT
scintigraphy has some adverse and disruptive effects that may
degrade imaging quality. Here are six basic adverse effects, the
first three of which are also known from planar scintigraphy (however, with the SPECT method they manifest themselves
more markedly and in a slightly different way), the last three are specific to SPECT (rotary method).

Note: About the pitfalls and possible errors of correction methods, bassicaly here the same applies as in general scintigraphy - described above in section "Errors and pitfalls of correction methods, correction artifacts".
Use of
SPECT scintigraphy
SPECT tomographic scintigraphy represents a significant addition
(relative to the planar scintigraphy) and improvement to the geometric-anatomical
information on the distribution of the radioindicator in
tissues and organs. It is mainly used in scintigraphy of myocardial
perfusion (§4.9.4 "Scintigraphy of myocardial perfusion") and brain
(§4.9.8 "Perfusion scintigraphy of the
brain"), as well as
receptor scintigraphy of the brain ("Scintigraphy of brain receptor
systems"). Also in other scintigraphic methods, such as skeletal
scintigraphy or tumor localization diagnostics, tomographic SPECT
imaging is beneficial.
Another important
possibility, the specification of anatomical localization,
is the fusion of SPECT + CT images in two-modal
combinations of SPECT/CT (see below the
section "Fusion of PET and SPECT images with CT and
NMRI images"). Scintigraphic
images provide important information about the functional status
of tissues and organs, but are usually unable to provide
sufficient anatomical information about the exact location of
pathological abnormalities (lesions) imaged scintigraphically.
Radioactivity does not enter the surrounding anatomical
structures (eg skeletal), which do not capture the radioindicator and are not
visible in the scintigraphic image. It is therefore optimal to
perform a better and clearer comparison of the character, size
and location of the displayed structures while simultaneous
imaging of SPECT + CT or PET + CT images, where X-rays
of CT provide precise anatomical localization of the examined
structures.
Positron
emission tomography PET
Positron Emission
Tomography (PET) is a method of
scintigraphic imaging of the distribution of positron (b+)
radionuclides, based on the detection of annihilation
photons formed by the interaction of emitted positrons
with electrons in the tissue of a patient, to whom a positron
radionuclide was applied. During the radioactive conversion of a
positron radionuclide, a positron ("positive electron") is
emitted from the nucleus. In the material environment, the
positron gradually loses energy by collisions with the electrons
of atomic shells and zigzags change the direction of motion.
After braking (thermalization) of the positron e+ during a relatively short path, the interaction with
the electron e-
their mutual annihilation occurs -
transformation of the electron-positron pair into two
gamma photons with energies 511keV, which fly apart from
the place of annihilation simultaneously in opposite directions,
at an angle of 180° *) - see §1.6,
passage "Interaction of charged particles -
directly ionizing radiation",
Fig.1.6.1 down.
*) This applies exactly in the center of gravity
reference system of the positron and the electron. The energy of
photons 2 x 511keV is a consequence of the law of
conservation of energy (resting energy of electron and
positron is m0e .c2 = 511keV), the
opposite direction of 180° is a consequence of the law
of conservation of momentum. In the case of collisions
of positrons and electrons of higher energies, the angle of
inclination of annihilation photons would differ from 180°. In
the material environment, however, the positron and the electron
have relatively low velocities at the moment of annihilation, so
that the emitted quantums actually fly in almost opposite
directions, with a maximum deviation of approx. + -2.5°. The
effect of this angular deviation is discussed below in the
section "Spatial
resolution of PET".
Furthermore, own annihilation usually
precedes the formation of metastable bound electron-positron
system positronium. In the case of the so-called
orthopositronium, 3 photons g
can also be emitted, with continuous spectrum. This can only be
observed with positron radionuclides in a sparse gaseous medium;
in a relatively dense tissue environment, this phenomenon is very
rare (for details see §1.5, section "Elementary
particles and their properties",
passage "Positronium").
The path of the emitted positron in
the substance (tissue) is "zigzag" and depends on its
energy. The mean reach or range
of the positron determines the average distance of annihilation
from the point of positron emission, ie from the beta+
radionuclide position. Positrons from the point of emission can
fly isotropically in all directions, so that the points of
annihilation can be anywhere inside a sphere with a radius given
by the range of the positrons. The average range of positrons
thus limits the maximum physically achievable
resolution of PET (discussed below in the
paragraph "Spatial
resolution of PET").
Positron emission tomography uses coincidence
detection of a pair of photons of gamma annihilation radiation
(511 keV energy), which arise during the annihilation of a
positron b+ with an electron and fly out of their place
of origin in opposite directions - at an angle
of 180°. This coincident - simultaneously -
detection of a pair of annihilation photons is used for electronic
collimation of g radiation and subsequent reconstruction of
tomographic images.
Note:
For scintigraphic detection of annihilation radiation, even a
classic scintillation camera with a special "heavy"
collimator with sufficiently thick septa between the holes can be
used in principle. In this mode, however, only one of the pair of
photons is always scanned - it is a single-photon
planar or tomographic scintigraphy (planar or SPECT). However,
the detection efficiency is very low here (only one photon + low
transmittance of collimators + low absorption in a thin NaI(T1)
crystal) and the images have poor spatial resolution (usually
worse than 10 mm) due to coarse collimators. This scintigraphy is
no longer used.
Some alternatives, such as the
multidetector and Compton cameras mentioned above, are still in
the laboratory experiment stage and can only be used for
scintigraphic imaging of small objects.
Development of PET
The basic primary particles used in PET, positrons, predicted by
P.Dirac in 1928, were first discovered by C.Anderson in 1932 in
cosmic rays (§1.5, part "Elementary
particles and their properties"). Coincidence detection of pairs of annihilation quantum
radiation from positron radionuclides for gamma imaging was first
tested by W.Sweet and G.Brownel in their two-detector motion
scanner in the late 1950s, other PET experimental devices were
designed at Univ. of Pennsylvania, the first ring detectors
designed by R.Robertson and Z.H.Cho. A significant impetus for
the development of PET was the synthesis of 18-FDG (fluorine-18
labeled glucose) in 1970 and the discovery of its accumulation in
tumor tissues. In the early 1990s, PET gammagraphy began to be
used clinically in large laboratory centers, and after 2000 it
spread more and more rapidly to clinical workplaces of nuclear
medicine. After 2005, most PET cameras are produced in a hybrid
combination with X-ray CT imaging - PET/CT (later
sometimes also with magnetic resonance PET/MRI) - for advantages
see §4.6, part "Hybrid
tomographic systems". All
complex oncology centers are gradually being
equipped with PET/CT devices.
Coincidence
detection ® electronic collimation of g- radiation
The photons g generated during e+ e-
annihilation have three significant geometric properties :
¨ They fly out of the annihilation site simultaneously
and in the opposite direction - at an angle of 180° ;
¨ They move along straight paths
;
¨ They move at a speed of light
of 300000 km/s, so they can be detected at laboratory scales
practically simultaneously .
These properties enable the
so-called concident detection of pairs of
annihilation photons: we place the measured positron emitter
between two detectors (small enough in size), the
outputs of which are connected to an electronic coincidence
circuit. Only pulses corresponding to the simultaneous
detection of photons in both detectors pass through this
circuit into the evaluation electronic apparatus. Due to the
above mentioned geometric properties, only photons from
annihilations that occurred on a straight line
connection of the sensitive points of both opposing detectors,
can be detected in this way. If annihilation occurs outside this
straight connecting line, then even in the case of detection of
one of the photons by one detector, the other of the annihilation
photons is not captured by the opposite detector - the pulse does
not appear at the output of the coincidence circuit. Thus, when a
pulse appears at the output of the coincidence circuit, it means
that e+ e- annihilation has occurred
at some point on the junction of the two detectors.
If we surround the investigated
object with a positron radionuclide by a larger number of
oppositely placed detectors in a coincidence circuit, we
achieve targeted directional detection of
annihilation g- photons - their electronic collimation,
without the need for physical shielding with a lead hole
collimator.
Fig.4.3.5. Principle of scanning and reconstruction of positron
emission tomography.
Left: Coincident acquisition of
annihilation photons g. Middle: Image
reconstruction. Right: Scintiblock with
pixeled BGO/LSO crystal and 4 photomultipliers (manufactured by Hamamatsu) .
PET scanning principle
The PET scanning principle is schematically shown in Fig.4.3.5.
The PET scintillation camera detector has an annular
arrangement of segments of a large number of small
scintillation crystals in optical contact with photomultipliers
*), which detect flashes caused by the interaction of radiation g. Due to the
relatively high energy of annihilation radiation g 511keV, BGO
or LSO material with higher density and higher
detection efficiency in the area of higher energies g is used in
scintillation crystals, instead of the usual NaI(Tl) - see §2.4. "Scintillation detection and
spectrometry", section "Scintillators and their properties". The diameter of the
detector ring is usually 60-80 cm.
*) Individual scintillation crystals (cut
into pixels with dimensions around 4x4mm)
are fixed in scintiblocks (Fig.4.3.5 on the
right) together with photomultipliers, it is described below.
The
investigated object W, in which the b+ -radioactive substance is distributed, is
located inside the detection ring of the PET camera (Fig.4.3.5 on
the left). If a radioactive b+ -transformation of
the radioindicator nucleus occurs at a certain point, the
radiated positron e+ after practically 1-3 mm (depending on its kinetic
energy *) movement in the tissue by ionization braking
practically stops and when interacting with the electron e- annihilates:
e+ + e- ® 2 g, where both
quantums of annihilation radiation g1 and g2 with energy 511keV
will fly away in opposite directions (ie at an angle of 180°),
pass through the tissue and are coincidentally registered
by an annular scintillation detector in two places (angles j1 and j2 , in the picture
marked: j1 ® x1
, j2 ® y1). The sensing ring of
the detectors located around the object to be examined thus
detects those photons, which have fallen at the same time on the
opposite points of the ring. The connection of these places, the
so-called coincidence line or response line,
passes through the point where e+ e- annihilation occurred. The set of these coincidence
lines from individual pairs of detected annihilation photons (xi , yi) then serves to reconstruct
the image of the distribution of the positron radionuclide in the
investigated object - in Fig.4.3.5 on the right.
*) This range of positron
radiation in the tissue determines the basic limit
below which it cannot be reached with the resolution
of PET imaging. For the most commonly used 18F, the range of positrons in the tissue is about 0.9 mm,
which is substantially less than the actual resolution of the PET
apparatus. It is discussed in more detail below in the section
"Adverse effects of PET".
Differences
between PET versus planar and SPECT scintigraphy
The main difference from conventional planar or SPECT
scintigraphy is that PET detectors are not equipped with lead
collimators with many holes, as collimation is performed
electronically, which leads to significantly higher
detection efficiency of PET compared to SPECT (where most of the
radiation is absorbed in the collimator septa). Another
difference is that the imaging detector of the SPECT camera must rotate
around the examined object (patient) in order to store partial
projections at different angles (this is
the case with existing SPECT cameras; with newly developed stationary SPECT cameras , acquisition from all projection angles takes place
simultaneously - as with PET). For PET, the
detectors do not rotate around the patient, they
are stationary - ring detectors store data from
all projection angles simultaneously. The
resulting image can then be reconstructed continuously
during the acquisition.
Coincidence PET with
double-headed rotating cameras for SPECT
In the mid-1990s, some scintillation camera manufacturers (first Adac
, then Picker , Elscint , GE and
others) developed special electronic circuits that allowed to
perform positron emission tomography on conventional two- (or 3)
- headed cameras used for SPECT. Both heads,
placed opposite each other and without collimators,
rotated around the object under investigation as in the
acquisition of SPECT, but the pulses were fed to a special coincidence
device which recorded and evaluated pulses corresponding
to the simultaneous detection of 511 kV annihilation photons by
both opposing detectors. The software of the evaluation device
then performed the reconstruction of the transverse sections in
the same way as for PET.
This solution initially seemed very promising, as it
would allow to perform PET even in workplaces that do not have
expensive single-purpose equipment, a universal double-headed
SPECT camera supplemented with suitable electronics would be
enough, possibly using a thicker scintillation crystal. However,
experience from practical use has shown that this is a sub-optimal
solution, which with its poorer detection efficiency and
resolution, it cannot compete at all with single-purpose PET
cameras with a ring detector. Therefore, the manufacturers of
scintillation cameras soon withdrew from this
solution and offer separately classic double-headed cameras for
SPECT and separately PET cameras with a ring arrangement of
detectors.
Three
types of coincidences in PET
In the coincidence detection of annihilation photons, there can
be basically three cases where two photons g are detected
simultaneously :
¨ True
coincidences
- direct detection of pairs of photons always coming from one
e+ e- annihilation. The
annihilation site is located exactly on the line between the
opposite detectors, which during the reconstruction creates an
image of the radio indicator distribution. For not very high
frequencies (count rate) the number of true coincidences
increases practically linearly with activity in
the field of view, at higher frequencies it grows more slowly due
to dead time and at very high frequencies it even decreases due
to overload by random coincidences
(paralyzable dead time effect).
¨ Scattering
coincidences
- one or both simultaneously detected photons succumbed to Compton
scattering, which deviated their angle.
The annihilation site does not lie on the junction of the
detectors that registered this pair of photons. The percentage of
scattering coincidences increases with the (electron) density of
the material environment and their number again increases
essentially linearly with activity in the field of view (similar to true coincidences) .
If only one of the annihilation photons hits one of the detectors
and the other escapes outside the opposite detector after Compton
scattering, no coincidence is recorded.
¨ Random
coincidences
- this is the detection of photons g originating from different
annihilations, which accidentally hit
the opposite detectors simultaneously (within
the time resolution of coincidence). The location of neither of
this twoo annihilation do not lies on the junction of the
detectors that registered it. The number of random coincidences
is proportional to the square of the activity of
the positron emitter in the field of view.
Only true coincidences
produce a correct gammagraphic picture of the positron
radionuclide distribution. Scattering and random coincidences are
parasitic (the relevant coincidence lines are false,
they do not reflect the actual distribution of the positron
radioindicator - this is the so-called combinatorial
background) and degrade image quality -
reduce contrast and increase noise.
Newer types of PET cameras consist of several
coaxial rings of detectors arranged side by side, which
allows the simultaneous scanning of several transaxial sections;
the field of view in the axial direction is approx. 15 cm for
current devices. In this arrangement, two types of scanning are
used :
In the so-called 2D
method, shielding baffles are inserted between
the individual detection rings, so that the coincidence lines are
scanned separately from each cross section - only in the plane of
the rings, perpendicular to the system axis.
In the so-called 3D
method, no septa are inserted between the detector rings, and
coincidence sensing also takes place "obliquely" from
the directions between the planes of the individual rings - the
coincidences from the detectors in the different rings are also
evaluated. Thus, significantly more photons can be captured, ie
achieved higher sensitivity. However, there is
also an increased probability of accidental coincidences (see
below), so this method can only be fully utilized with cameras
with faster detectors based on LSO scintillators.
For imaging larger parts of the body or
for full-body imaging, PET cameras are equipped
with an examination bed with a motorized controlled
movement. The computer system then combines the scanned
data from several patient positions during reconstruction into
one large whole-body tomographic image.
Scintillation Detectors for PET
Scintillation
Crystals
As mentioned above, at a relatively high energy of 511 keV
annihilation gamma radiation, conventional NaI(T1) scintillation
crystals have low detection efficiency. Higher density
scintillation materials are more suitable for PET to achieve high
detection efficiency with not too large a crystal thickness - to
achieve high detection efficiency and good spatial resolution of
scintillation localization by a photomultiplier system in the
camera's ring detector. It is also highly desirable to have a short
scintillation duration (scintillation afterglow) so that
a narrow coincidence window can be used - high time
resolution to reduce random coincidences (and the possibility of using the TOF method - see
below). To detect gamma radiation, a number
of scintillation materials with different properties have been
synthesized (see §2.4, section "Scintillators and their properties"). In principle, several
types of scintillators are applicable for PET :
| Scintillator : | NaI (Tl) | BaF2 | LaBr3 (Ce) | YAlO3 (Ce) (YAP) |
LuPO4 (Ce) (LPO) |
Gd2 SiO5 (Ce) (GdSO) |
Bi4 Ge3 O12 (BGO) |
Lu2 YSiO5 (Ce) (LYSO) |
Lu2 SiO5 (Ce) (LSO) |
Lu Fine Silicate (LFS) |
LuAlO3 (Ce) (LuAP) |
| Density [g/cm3] | 3.67 | 4.89 | 5.1 | 5.55 | 6.2 | 6.71 | 7.13 | 7.1-7.4 | 7.41 | 7.35 | 8.34 |
| lmax [ nm ] | 415 | 220/310 | 360 | 350 | 360 | 440 | 480 | 420 | 420 | 425 | 380 |
| scint. afterglow [ns] | 230 | 0.8 | 16 | 30 | 24 | 60 | 300 | 41 | 40 | 33 | 11/28 |
| h [photon/MeV] | 4.10 4 | 1.8.10 3 | 6.3.10 4 | 1,6.10 4 | 1,3.10 4 | 8.10 3 | 6.10 3 | 3.10 4 | 3.10 4 | 3.2.10 4 | 9,6.10 3 |
In practice, heavier BGO
scintillators are used, more recently LSO (possibly LYSO modified), which
has the advantage of a significantly shorter scintillation
afterglow. LYSO scintillators have similar
properties to LSO; the yttrium component causes
technologically easier growth of single crystals. A higher
percentage of yttrium (LYSO also occurs on
the composition of Lu0.6 Y1.4 SiO5 : Ce), but reduces the
density and the detection efficiency in comparison with the
LSO.
Based on LSO, the LFS
(Lutetium Fine Silicate) scintillator was further
developed, which has a finer crystal structure and in
addition to basic lutetium, silicon, and oxygen (LSO) with doping
Ce, it also contains carefully tested small impurities of some
other elements such as Ca, Gd, Sc, Y, La, Eu, or Tb. This results
in slightly better energy resolution and shorter scintillation
afterglow.
Scintillator LaBr3: Ce5% (is hygroscopic) with a very fast scintillation is tested in terms of TOF
(see below).
Internal radioactivity
of LSO scintillators
A minor disadvantage of lutetium -based
scintillation detectors (such as LSO and LYSO) is the higher
radiation background due to the internal
radioactivity contained in the scintillator. In addition
to the basic stable isotope 175Lu,
natural lutetium also contains 2.6% of the long- lived radioisotope
176Lu with a half-life of 3.8.1010 years is also
contained in the luterium - see §1.4, passage "Lutetium".
This natural "contaminant" is irremovable. During its
radioactive decay, beta and gamma radiation is emitted, which is
internally detected with high efficiency and causes an internal
radiation background in each detector *) about 40
pulses/sec / l gram LSO (more detailed
analysis was performed in §2.4, part "Scintillators and their properties", passage "Internal radioactivity of LSO
scintillators"). Beta radiation is
fully absorbed in each individual crystal independently, so it
does not manifest itself in coincidence measurements (random
coincidences are negligible here). However, gamma-ray beams,
especially 300 keV photons, can fly out of individual LSO
crystals and hit other detectors, where they can be detected
immediately - creating a coincidence event contributing to the
background in the PET image. The background thus formed is
negligibly small in relation to the fluxes of the measured
annihilation radiation of the order of 106 photons/s. in clinical scintigraphy. However, certain
problems may arise in experimental studies of PET with
low activities of the order of kBq units at long measurement
times (animal PET).
*) It is interesting that a
typical PET camera, consisting of about 190 blocks of LSO
crystals with a volume of about 50 cm3, contains a total internal radioactivity of 176Lu of about 2.4 MBq!
Each 50 cm3
scintillation detector produces about 12,500 pulses/s. radiation
background, which significantly burdens the electronic reading
circuits. However, when coincidently measuring higher activities
(approximately 100 MBq in patients), this is practically not
applied in the resulting images. However, this
"parasitic" radiation can be used for continuous calibration
and tuning of PET detectors, without the use of external
phantom sources..?..
Photodetectors for PET
Two types of photodetectors are used in PET to capture and
electronically register light flashes from scintillation
detectors :
× Photomultipliers
are the most commonly used and proven electronic light signal
sensors from scintillation detectors - they are described in
detail in §2.4, section "Photomultipliers". They have high and linear gain, low
signal-to-noise ratio, short output signal pulse (short dead
time). Their partial disadvantages are the complexity of the
design, the need for high voltage, larger dimensions (they cannot
be miniaturized too much), higher cost, relatively low quantum
efficiency and sensitivity to the magnetic field.
× Semiconductor detectors
are a modern alternative to photomultipliers. Their main
advantages are: small compact dimensions (miniaturization), high
quantum efficiency, low voltage, lower cost, insensitivity to
magnetic fields. Two types of semiconductor photodetectors are
used for scintillation sensing :
- Photodiodes are formed by p- and n-type
semiconductors in close contact in the p-n junction. They are
connected in inverse polarity to voltage (in the reverse
direction). The impact of the photon of light excites
electron-hole pairs in the semiconductor material, whereby a
current pulse passes through the diode. At higher voltages,
secondary electron-hole pairs also form and signal amplification
occurs. If the electric voltage is set just around the breakdown
voltage of the p-n junction, there will be an avalanche-like
increase in electron hole pairs when the photon strikes - it is
avalanche photodiode, operating in the so-called Geiger
mode.
- Silicon "photomultipliers"
SiPM are multipixel avalanche
photodiodes - multipixel photon counters, each element of which
works independently in Geiger mode. The output signal is
proportional to the number of pixels that have been hit by light
photons, and thus the number of photons detected in the flash,
they have spectrometric properties (they are described in more
detail in §2.4, section "Photomultipliers",
section "SPM
Semiconductor Photomultipliers").
Detector blocks for
PET
Scintillation crystals with photomultipliers (or semiconductor
photodetectors) are assembled into compact scintiblocks
in a PET camera, distributed around the circumference of the
circular gantry. Each such scintiblock is formed
by a square 2D array of crystals (BGO or LSO), connected to
photomultipliers by means of a light guide - Fig.4.3.5 on the
right. The array of crystals is usually formed from one
single-crystal using sections separated with light-reflecting
material. The usual configuration consists of a crystal measuring
5x5 cm
and 3-5 cm thick, cut into an array of 8x8 partial crystals
("pixels"), to which 4 photomultipliers with a diameter
of approx. 2 cm are attached via a light guide (in Fig.4.3.5 cutout at the top in the middle, in more
detail in the right part of the picture).
When the photon g of radiation hits one of the crystals, the resulting
scintillation light is shared by all four photomultipliers.
Information on the exact position of the flash
(x, y coordinates) in the crystal field is obtained by electronic
analysis of the ratio of pulse amplitudes at the
output of individual photomultipliers, similar to a classical
planar gamma camera (described above in
§4.2 "Scintillation camera",
Fig.4.2.1; each PET scintiblock can be considered a simple "Anger
mini-camera"). One ring of
the detector is usually formed by made 48 scintiblocks, arranged
close together in a circle with a diameter of about 60-70 cm
(gantry); the whole camera contain 3-5 such parallel rings.
As mentioned above, instead of
photomultipliers, the multicrystal scintillation can
electronically scaned using arrays of semiconductor photodiodes,
or better with SiPM photomultipliers. The near future probably
belongs to compact scintiblocks LSO-SiPM,
LYSO-SiPM (or perphas LaBr3 -SiPM). For more distant development in PET (instead of BGO/LSO scintiblocks with classical
photomultipliers or SiPm) there are promising multipixel fully semiconductor
detectors (eg based on CZT). In addition to better detection efficiency and spatial
resolution, a slightly shorter coincidence time (for better TOF) can be achieved.
So far, it is being tested experimentally on smaller PET models.
The advantage of semiconductor detectors is also theirs independence
from the magnetic field, which allows use also in hybrid PET/MR
systems.
Reconstruction of PET images
During the acquisition, a large number of coordinates of
coincidence lines (in the order of millions of coincidence
detections) are scanned; data are stored in the form of so-called
sinograms. By computer reconstruction
of these linear projections of coincidence sites, images
of cross-sections are created and from a set of
transverse sections, computer reorientation can be used to create
sections at any angle, or 3D images (similar to SPECT,
above). For the reconstruction, either the (filtered) back
projection method is uses, which however, can produce
"star" artifacts around positive lesions, or more
computationally demanding iterative reconstruction,
providing higher quality images without these artifacts. Another
advantage of iterative reconstruction is the ability to
incorporate various properties of specific devices and methods
(such as homogeneity, attenuation, noise, resolution) directly
into the reconstruction procedure. Reconstruction methods,
analogous to SPECT, have been described above in the section
"Computer reconstruction of SPECT".
................? add
special modifications of reconstruction procedures? ........
PET imaging properties
Compared to classical single-photon planar and SPECT
scintigraphy, two-photon coincidence tomography of PET has two
basic advantages: significantly higher
detection efficiency (sensitivity) and slightly better
spatial resolution :
Detection efficiency (sensitivity)
of PET
The absence of classical collimators and registration of photons
of annihilation radiation simultaneously from all
directions, using electronic collimation, leads to significantly
higher detection efficiency (sensitivity) of PET gamma
cameras compared to classical Anger cameras, where the vast
majority of gamma photons are not detected (flies
"into empty space" or is absorbed in the septa of
collimators).
The detection
efficiency or sensitivity h of
instrument for detection and spectrometry of ionizing radiation
is generally a ratio between the number of detected pulses and
the number of incoming radiation quanta; relative and
absolute efficiency is introduced, often expressed in %
(it was defined and physically discussed in
§2.1, section "General physical and instrumental effects in
detection and spectrometry",
section "Detection efficiency and sensitivity"). However, in gamma cameras, where the source of gamma
radiation is a radionuclide, the sensitivity -
detection efficiency - is usually quantified in a special way:
as the number of pulses detected by the camera per unit time (per
second) - [cps], relative on unit of
activity [kBq, MBq] of the radionuclide used in the
displayed source; for the planar/SPECT scintigraphy is usually 99mTc, for PET it is 18F.
Only exceptionally is it expressed in % (detection
efficiency-sensitivity in classical gamma cameras is discussed in
§4.5, section "Sensitivity ( detection
efficiency ) of a scintillation camera"). For the scintillation
cameras, the detection sensitivity is related to the
radioactivity of the examined object: the detection efficiency h, or sensitivity,
of the imaging system is quantified as the pulse frequency N[imp./s]
measured by a scintillation camera with a (point) radiation
source g
(located at the desired place in field of view), relative to the
activity unit A[MBq] of the source: h
= N / A. It is expressed in units [imp. s-1 MBq-1], or [cps/MBq]
or [cps/kBq].
Detection
efficiency - sensitivity - of PET cameras are determined by
several physical, geometric and technical factors, which can be
divided into two categories :
l Detection efficiency hd of annihilation radiation 511keV in the detection elements of the PET ring. This
"physical" detection efficiency hd of annular
detectors depends on the thickness of the
detection material h , its density and
the atomic number - trough the linear attenuation factor m
for gamma 511keV is given by the coefficient (1-e-
m
. h)
(detection efficiency of scintillation
detectors is discussed in §2.4 "Scintillation detection and gamma
radiation spectrometry", section
"Scintillators and their properties"; scintillation materials suitable for gamma
511keV were discussed above in the section "Scintillation
detectors for PET"). It also depends on the amplitude analyzer window
setting, scintillation afterglow and dead time. At greater
distances from the center, there is also a slight decrease in the
detection efficiency due to the oblique angle the impact
of most of the annihilation photons on the detectors. We include
all these other individual influences in the factor f
. In our case of coincident two-photon detection
of PET in two opposite detectors with detection
efficiency hd, the resulting detection efficiency will be
given by the product hd . hd , ie it appears in the quadrate
hd 2 = [f . (1 - e - m .h)] 2.
l Geometric efficiency hg
the PET registration of 511 kV annihilation photons is given by
the spatial angle of projection at which the
annihilation photons from the activity source are detected. Each
radionuclide source emits radiation isotropically
in all directions - up to a spatial angle of 4p. Around the point
source, located in the middle of the detection ring of radius R,
we can draw an imaginary spherical surface of this radius R
- trough its surface 4pR2
will pass all photons emitted from the source (if the detectors were placed densely on this spherical
surface, the geometric detection efficiency would be 100 %). By circular detection ring width S, which has a
surface 2p R.S, however, passes out of this total number only a part
of the photons, given by the area ratio of 2p R.S/4p R2 = S/2R. If the PET camera has N parallel rings
of width S and radius R, the geometric efficiency
will be hg = N.S / 2R
(if we neglect the gaps between the
detectors and somewhat oblique angles from the center to the
peripheral rings). Increasing the diameter
of the ring 2R reduces the overall projection solid angle and
thus the geometric efficiency. On the contrary, with the
increasing number of N detection rings in a PET camera,
the projection angle widening and thus increases also the
geometric detection efficiency.
By multiplying
these two partial factors of detection and geometric
efficiency, we can obtain the resulting relationship for the total
detection sensitivity h of the PET
camera :
h =
[f . (1 - e - m
. H )]2
. N . S / 2R ,
where f is the fraction of detected photons in the
photopeak with the specific setting of the PHA analyzer window (with possible angular dependence in the peripheral
parts), h is the thickness of the
detectors, m is the linear attenuation factor of the detector
material used for gamma radiation 511keV (usually
BGO or LSO m = ....) , R
is the radius of the detection ring, S is its width, N
is the number of detection rings.
Current standard PET cameras with
three detection rings with a diameter of about 70 cm, each
consisting of 48 scintiblocks BGO/LSO 5 x 5 cm and a thickness of
about 5 cm, achieve a detection sensitivity of about 7-10
cps /kBq 18F (for classic Anger planar or
SPECT cameras sensitivity is only about 0.04-0.3 cps /kBq
99mTc, depending on the collimator used - almost 30-100
times lower).
Spatial resolution of PET
Replacement of mechanical collimators by electronic
collimation also leads to a somewhat better spatial
resolution of PET compared to conventional Anger
cameras.
The spatial
resolution (abbreviated resolution) of a
scintigraphic image is the
smallest distance [mm] of two point radioactive sources in the
displayed object, which are still distinguishable from each other
in the scintigraphic image as two images. We can determine it as
the width of the PSF profile in the image
of a point or line source in half the maximum height of the
profile, converted to a spatial scale in the object [mm] - it is
called FWHM ( Full
Width at Half Maximum - overall width at half maximum; resolution for
classical gamma cameras is discussed in §4.5, passage "Spatial resolution") .
 |
||
| Fig.4.3.6. Physical and
geometric effects on positional resolution in PET
imaging. a) Range of positrons h in the tissue (an example of three ranges in different directions is marked - strongly increased) and flight deviation of annihilation photons from 180°. b) Projection-geometric degradation of resolution due to width d of detectors. c) Cros-radiation of annihilation photons between detection elements causes radial "astigmatism" in images of peripheral parts. |
The spatial resolution of PET imaging is again
determined by a combination of several physical, geometric, and
technical factors :
¨ The range of positrons in the tissue prior to positron annihilation represents
the primary physical limit for PET resolution.
Positrons are emitted from nuclei at high speed - with a kinetic
energy of hundreds of keV to several MeV, so from the site of
radionuclide deposition positrons to fly in the
tissue to a certain distance (approx. 0.5
mm-6 mm, depending on the radionuclide) before
braking (thermalizing) and meeting with electrons (via
positronium) annihilate on a pair of 511keV
photons. Therefore, since the positions in which annihilation
photons are generated are somewhat different (and each time different) from the
position of the original parent nuclei, there is some blurring
of position. The magnitude of this blur depends on the
positron radionuclide used - on the maximum and mainly the mean
energy of the emitted positrons, determining their mean range h in
the tissue (Fig.4.3.6a). For some positron
radionuclides used, the following is :
....... table ..............
¨ Angular blurring due to incomplete braking of positrons.
Electron-positron annihilation in the tissue then occurs with a
certain residual kinetic energy (different each time), so that in
the laboratory reference system the angle of radiation of
annihilation photons will be slightly different from 180°, on
average by + - 0.25°. This angular uncertainty - variability
causes a small geometric blur, which is
proportional to the radius R
of the detection ring, with a value of 0.004 . R .
¨ Size of detectors - width d of detection elements is the dominant factor of projection-geometric
degradation of resolution. Opposite detectors of finite
(non-zero) dimensions detect radiation not only from a single (central, axial) coincidence lines, but from
the whole cone of angles. This leads to a geometric variability
of the coincidence line with respect to the actual position of
the annihilation, the half-width of which is d/2
(Fig.4.3.6b).
¨ Accuracy of decoding the position of
scintillation within the
scintiblock of detection elements, using a significantly lower
number of photodetectors (eg 4
photomultipliers per 64 detection scintillation elements). The inaccuracy of this decoding (optical
multiplexing) somewhat degrades the
resolution. For this contribution, the value of the half-width of
approx. d/3 was empirically determined.
¨ Cross-radiation of
annihilation photons between detection elements - penetrating annihilation g of 511keV radiation can
interact with several different (adjacent) crystals. This can
cause a detected signal even in another neighboring crystal than
the one on which the photon primarily strikes. As a result, the
coincidence line may be incorrectly assigned to one of the
adjacent detection elements. This effect occurs when annihilation
photons hit the detection elements in an oblique
direction, which occurs from sources farther from the
center (for sources in the center r = 0 it
does not manifest itself and the projection of coincidence lines
remains narrow, given only the size of the detection element) - Fig.4.3.6c. These obliquely
incident photons can interact with several different crystals,
depending on the depth of penetration into the
scintillation material. The radial projection of the source is
thus extended by the trigonometric factor k
. r / Ö(r2
+ R2), wherein the coefficients k a
given depth of penetration annihilation photons into
scintillation material- the half-layer of photons 511 keV
absorption in the material of the detector h1/2 = ln2
/ m , where m is the linear
attenuation coefficient gamma 511 keV in the material
scintillator - Fig.4.3.6c.
This creates a kind of radial "astigmatism"
*) - asymmetric blurring of images of peripheral sources, more
distant from the center of the ring r = 0. For detection crystals
made from BGO or LSO scintillators, an approximate value of 12.5
was measured for the coefficient k. This effect is clearly
visible in Fig.4.3.7 on the right, in images and profiles of
peripheral point sources at distances r = 34 and 30 cm, partly
also for r = 20 cm (allusively already
manifests at r = 10 cm).
*) It is a bit similar to astigmatism
in optics - imaging defect (aberration) in
converging lenses, manifested in objects at greater distances
from the optical axis, or in optical systems asymmetrical to the
optical axis.
¨ Reconstruction algorithms for creating the resulting images of radioindicator
distribution using a set of coincidence lines show minor errors
and variations. Manifests a non-uniformity of the density of
coincidence lines with respect to the position of sources inside
the detection ring, different types of reconstruction algorithms
and filtering. During the reconstruction, a certain common additional
coefficient of degradation of resolution *) is arises, for
which the range of approx. 1.2-1.5 was empirically determined; we
will use an approximate value of 1.3 here.
*) In this physical analysis we mean standard
"classical" reconstruction algorithms of filtered back
projection or iterative reconstruction of OSEM. We
do not consider special reconstruction algorithms with built-in resolution
recovery, design modifications and PSF modeling or filtering
using inverse MTF to artificially
improve resolution. Here we are interested in the purely physical
properties of PET images, not the possibility of
their additional computer improvement (which, however, can be
useful in practice...).
These effects
lead to several contributions to the response function of the PSF
point source, which are approximately Gaussian in shape. By their
quadratic summation (geometric
average) we can then obtain the resulting
relationship for the total spatial resolution of
the PET image :
FWHM
= 1,3 . Ö [(d/2)2 + h2
+ (0,004.R)2 + (d/3)2 +
(12,5.r)2/(r2+R2)] ,
where FWHM is the resulting half-width of the
response function of the point source, ie the total
resolution, d is the size (width) of the
detection element, h is the mean range of the positrons, R
is the radius of the detector ring of the PET camera, r is
the radial distance of the source emitter from the center of the
ring (all dimensions are in millimeters).
Current standard PET cameras with
three detection rings about 70 cm in diameter, each consisting of
48 scintiblocks 3 cm thick with detection elements about 5x5mm in size, achieve
spatial resolution in the middle of the ring in transverse
sections around 4.2-5 mm
(classic planar/SPECT cameras they reach such a resolution only
close to the front of the collimator, in practical scintigraphy,
where the distance - depth - of the lesion is around 10 cm, but
the resolution cannot be achieved better than 10-12 mm).
Small animal PET cameras with a diameter of
approx. 20 cm with detection elements with a width of approx.
0.5-1 mm achieve an even significantly better resolution of
approx. 1-1.5 mm .
 |
| Fig.4.3.7. PET images of point sources
18F located at different
distances r from the center of
the detection ring. By analyzing the ROI and profile
curves with these images, the values of detection
efficiency h
and spatial resolution FWHM were
measured (we measured on a PET camera GE
Discovery IQ at KNM FN Ostrava) . At the last peripheral point source at a distance of r = 34 cm, part of its image was already cut off by the edge of the field of view. The measurement was performed using a simple arrangement described in the work "Phantoms and phantom measurements", part "Tomographic phantoms", passage "Simple improvised phantom for measuring the imaging properties of a PET camera". |
Our measurement of spatial resolution and detection sensitivity on PET images of point sources, located at different distances from the center of the detection ring, is marked in Fig.4.3.7. The effect of radial astigmatism can be clearly seen in the images and profiles of peripheral point sources at distances r = 34 and 30 cm, partly also for r = 20 cm (allusively are visible already at r = 10). For similar reasons (due to the oblique angle of incidence of most of the annihilation photons on the detectors) there is also a slight decrease in the detection efficiency at greater distances from the center.
TOF
- time localization of the annihilation site
The basic (conventional) PET method described above does not give
any information about the annihilation site on the coincidence
line, all pixels on the coincidence line are assigned the same
annihilation probability, the image is formed only by
intersections of coincidence lines. However, increasing the speed
of electronics and the introduction of detectors with high time
resolution (such as LSO scintillators) gradually allows the use of another important
"information channel" of annihilation radiation for PET:
it is measuring so-called TOF (Time Of
Flight) - flight time of photons g
from the annihilation site to the detectors. These photons fly in
opposite directions at the speed of light c = 300000 km/s. If
annihilation occurs in the middle of the coincidence line
"0", both photons are detected exactly at the same
time. However, if an annihilation occurred off-center, at a
distance Dx, the photon g1 will have a flight
time TOF1
= x1/c to
the detector, while the second photon g2 will fly a slightly different time TOF2 = x2/c - see Fig.4.3.8.
From the time difference t2 - t1 = TOF2 -TOF1 it is then possible to determine the radial
coordinate Dx of the annihilation site on the
coincidence line: Dx = c. (t2 - t1) /2 .
 |
Fig.4.3.8 Time localization of the annihilation site x1, x2 on the coincidence line by electronic analysis of the difference in flight times of annihilation photons DTOF in positron emission tomography. |
If the coincidence detection of annihilation
radiation has a sufficiently short time resolution,
the time difference between the detection of
both annihilation quanta g can be measured, which allows (at least in principle) to
determine the place on the coincidence line Dx, where
annihilation occurred and from where both photons were emitted *
) - Fig.4.3.8. This introduces additional information about the position
of the detector response into the system.
*) If we could measure the
time differences of annihilation photon arrivals with picosecond
accuracy, this information would be enough to determine the sites
of annihilation and achieve PET imaging directly. There would
then be no need to reconstruct by the quantifications of the
intersections of the coincident rays, but the cross-sectional
image could be stored directly
(in polar coordinates). These would no longer be coincidence
lines, but coincidence points. However, for it
we do not yet have fast enough electronics and detection
technology...
The time resolution of existing
instruments does not yet allow accurate localization of
annihilation sites, but even the approximate location of the
annihilation photon radiation site could shorten the segment of
response line, improve the reconstruction procedure, and improve
the signal-to-noise ratio in the resulting images. A
general analysis of the SNR signal-to-noise ratio in
scintigraphic images and its effect on lesion recognizability was
performed above in the section "Scintigraphic
image quality - lesion recognizability". There it has been shown that this ratio SNR =
(A-B)/ÖB,
where A is the number of useful pulses and B is the
number of background pulses. If at PET we have the total number
of background pulses BD on the whole concidence line of length D (given
by the diameter D = 2.R of the detector ring), then in its
portion FWHMTOF , selected by the width of the TOF length resolution
window, this number of background pulses will be reduced to BTOF=BD.(FWHMTOF/D), while the
number of useful pulses A remaining the same; this applies
to all coincidence lines. Thus, the use of TOF
localization of the annihilation site on the coincidence
line leads to an improvement in the
signal-to-noise ratio by a factor of SNRD/SNRTOF = [D/FWHMTOF]1/2.
TOF has no direct effect on
improving the spatial resolution FWHM of the PET camera, if the
PET image is reconstructed using the intersections of the
coincidence lines - this follows from the above geometric
analysis according to Fig.4.3.6. Only if the length resolution of
FWHMTOF
could be reduced to a few millimeters, the reconstruction of PET
could take place with significant use of the parameter Dx according to
Fig.4.3.8, and TOF would thus also affect the spatial resolution
of PET (in the extreme case of a perfect
TOF, its length resolution could even be decisive for the
resulting spatial resolution of PET - however, this is not
"threatening" yet..!..).
TOF is still in the stage of
technical development. The initial enthusiasm has not yet been
fulfilled, the method is rather a promise for the future
for the next generation of PET cameras. For current types of PET
cameras (2010-20) with installed TOF, the TOF time resolution is
about 500-600 picoseconds, which corresponds to the possibility
of resolving the annihilation site on the coincidence line of
about 15-18 cm. The TOF parameter is so far only minimally
usable in clinical scintigraphic diagnostics. TOF
analysis will be relevant only when its length resolution from
the current 15 cm can be improved to about 5-2 cm...
An improvement in TOF time
resolution to less than 400 ps can be expected with the
introduction of special scintillators (such
as lanthanum bromide LaBr3) and modern photodetectors
(silicon photomultipliers SiPM). Data are loaded and
reconstructed in LIST-mode format, iterative reconstruction
procedures (3D list mode TOF MLEM, OSEM, ...) have built-in
special correction algorithms, containing data from calibration
measurements. So far, however, "no miracles"
can be expected.!.. - TOF will probably remain mostly a physical-technical
interest for a long time...
Adverse
effects at PET and their correction
As with planar and SPECT scintigraphy, there are some adverse and
disturbing effects also on PET imaging, which worsen the quality
of the images. We will mention here several significant adverse
effects, of which the first four are also known from planar and
SPECT scintigraphy, the others are specific for two-photon PET :
The same applies to the pitfalls and possible errors of correction methods, as in the section "Errors and pitfalls of correction methods - correction artifacts" in general scintigraphy.
Construction design of PET gamma cameras
The basis of each PET gamma camera (for
which there is a less suitable name "PET scaner")
is a circular ring of detectors
with a diameter of 60-80 cm, registering pairs of photons of
annihilation gamma radiation with energy 511keV in coincidence
mode from opposite directions. The ring consists of a large
number of detectors (mostly scintillation), whose scintiblocks (see
Fig.4.3.5 on the right) are mounted in
several parallel concentric rows on a gantry,
through the inner cylindrical "tunnel" of which moves
the lounger with the patient. The movement of the lounger is
driven by a servomotor, ensuring precise computer-controlled movement
so that the images captured by the rings from the individual
parts of the body are folded into the resulting PET image (sometimes even whole-body),
including online fusion with X-ray CT images.
 |
Fig.4.3.9. PET/CT positron
emission tomography examination room at the Department of Nuclear Medicine, University Hospital Ostrava. In the middle is the basic PET / CT device (GE Discovery). Aiming and navigating laser pointers for radiotherapy planning are installed on the sides and ceiling of the laboratory. In the back of the right there is a contrast agents applicator for CT on the stand. |
Current PET devices are two-modality -
PET/CT to assess the exact anatomical location of imaged
lesions by fusion with CT X-ray images (or PET/MRI for fusion with nuclear magnetic resonance
images). In addition to the PET ring, a CT
ring (or MRI) is also installed on the same gantry,
through which the bed passes in a controlled manner and simultaneously
with the PET imaging, it also in-line creates CT
images (or MRI) of the patient.
Beside the physiological-anatomical correlation,
CT images also provide density maps for the correction of
attenuation of gamma annihilation radiation in tissues at PET
detection.
The device
sometimes includes optical aiming and navigation lasers
for precise localization of lesions when defining ROI
within the irradiation plan using PET images.
Use of PET scintigraphy
The areas of clinical use of positron emission
tomography in nuclear medicine are intended, similarly to
emission planar and SPECT scintigraphy, mainly by the properties
of relevant radiopharmaceuticals, here
radiopharmaceuticals labeled with positron radionuclides (these radionuclides and radiopharmaceuticals are
briefly described in §4.8 "Radionuclides and
for scintigraphy"). The most important area of PET use is oncological
diagnostics - finding out the location and nature of tumors,
which accounts for more than 90% of all PET examinations (§4.9.6 "Scintigraphic diagnostics in
oncology" and §3.6,
section "Diagnosis of cancer"). To assess the precise
anatomical localization of the displayed lesions, is used fusion
of PET with X-ray CT images - twoo-modality PET/CT,
or with MRI images (PET/MRI).
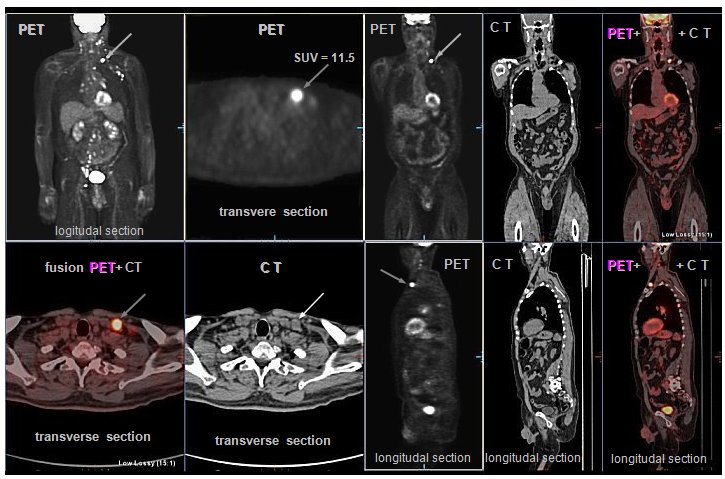 |
Fig.4.3.10.
Example of PET / CT scintigraphy with 18FDG in a patient with lymphoma. (PET / CT images were
taken by |
At a general level, PET works very well in the
field of assessing the metabolic activity of tumors,
proliferation, tissue hypoxia, the density of expressed receptors
in cells.
Specifically, herein used pharmacokinetic
properties especially 18F-deoxyglucose FDG (hereinafter
also 18FLT,
18F-choline)
which is selectively uptake
in tumor cells with increased metabolism of carbohydrates -
appears metabolic cellular activity of tissues (whereas X-ray and ultrasound displays only
morphological page). Malignant tumors are
usually characterized by glucose hypermetabolism. This
method is therefore also suitable for monitoring the
response of tumor tissue to therapy by imaging
metabolically active tumor tissue as opposed to inactivated
cells; it is possible to monitor the therapeutic response - the
"success" of therapy. Among other things, it is able to
recognize tumor recurrence from other processes (eg from the consequences of previous tumor treatment), see §3.6, section "Modulation of radiation beams". Monitoring of the
therapeutic response by PET consists in comparing the metabolic
activity of the tumor before the start of treatment and
after the application of therapy. The change in tumor metabolism
occurs before the change in its dimensions,
assessed by morphological X-ray or sonographic imaging methods.
PET can also be used for detection inflammatory process
in the organism (§4.9.6 "Oncological
radionuclide diagnostics. Scintigraphy of inflammation"), in cadiology for the
diagnosis of myocardial viability (§4.9.4 "Nuclear
cardiology").
The metabolic activity
of tumor lesions is often quantified in PET images using SUV
values - from a general point of view, it was discussed above in
§4.2 "Quality of scintigraphic imaging", section "Quantification
of positive lesions - SUV".
There were discussed some physical and biological factors that
may skew the absolute SUV quantification and
recommended relative SUV quantification to
compare the metabolic activity of lesions in specific patients
before and after therapy. In the case of PET imaging with 18F-FDG, the blood
glucose level also adds to this - its increased value
reduces the accumulation of FDG, which underestimates the
SUV.
PET (/CT)
has thus become an important functional imaging method in the
primary diagnosis, staging, assessment of therapeutic response,
recurrence search or re-staging of a number of oncological
diseases. PET images can also be advantageously used for
radiotherapy planning. It is discussed in more detail in §3.6, section "Diagnosis of cancer".
For PET scintigraphy with the most
commonly used 18F-FDG is a problem of physiologically variable
(sometimes quite high) accumulation of FDG in a number of
healthy viable tissues, especially in the brain and myocardium (see Fig.4.3.10). Therefore, PET with FDG is not suitable for the
detection of brain metastases or minor perfusion defects of the
myocardium. Non-specific increased accumulation of FDG is also
observed in inflammatory processes, wound healing, after surgery.
The displayed site with increased glucose uptake may not always
be a tumor...
Therefore, is promissing the use of
other radiopharmaceuticals and positron radionuclides (§4.8, passage "Radionuclides and
radiopharmaceuticals for PET")
such as gallium 68
Ga, zirconium 89
Zr , iodine 124 I , copper 64 Cu (for PET)
and beta- 67
Cu (for therapy), scandium 44
Sc (for PET) and beta- 47
Sc (for therapy), or mixed alpha-beta+ terbium 149
Tb (for both PET and
alpha-therapy). These radionuclides can be
used to label mainly monoclonal antibodies for
PET diagnostics and to perform subsequent biologically targeted
radionuclide therapy - theranostics (§4.9, passage "Combination of diagnostics and
therapy - teragnostics").
An interesting
application of PET has recently appeared in the so-called hadron
radiotherapy (§3.6 "Radiotherapy", part
" Hadron
radiotherapy "), where
irradiation with high-energy charged particles in the irradiated
tissue causes, among other things, nuclear reactions,
during which positron radionuclides are formed.
When irradiated with accelerated carbon nuclei 12C, a positron
radionuclide 11C is also formed, the distribution of which can be
visualized by the PET method. With a PET camera installed on a
hadron radiotherapy irradiator, we can monitor the dose
distribution in the target tissue and in the
surroundings - so-called in-beam
PET monitoring - and thus control the
course of radiotherapy (see Fig. 3.6.6 in §3.6).
PET is
also used in neurology to diagnose brain
activity and perfusion. The area of the brain that is active has
an increased accumulation of radiopharmaceuticals, which can be
used to assess brain activity and its association with some
psycho-neurological disorders (including
Alzheimer's disease). Furthermore, it is a
scintigraphic diagnosis of inflammatory processes
and examination of the myocardium, where the perfusion
and viability of the myocardium can be assessed on the basis
of the consumption of special positron radiopharmaceuticals (see below §4.9.4, section "Myocardial
perfusion").
For clinical
applications is very important the fusion combination of
PET scintigraphy with X-ray CT imaging (anatomical - §3.2, part "Transmission X-ray tmography CT"), which provides
visualization of morphological and anatomical structures with
high spatial and density resolution. This information obtained
from CT can be used to increase the accuracy of the location,
extent, and nature of the lesions found in PET images. X-ray CT
thus complements the functional information
obtained by PET with the help of a radiopharmaceutical, with
localization anatomical information. For modern
devices, this is implemented online in a two-mode hybrid PET/CT
system - see below §4.6, section "Hybrid
tomographic systems". This combination also allows good correction for
absorption (attenuation) of the annihilation g radiation in
tissue. Recently, there is also a hybrid combination of PET/MRI.
Positron
emission mammography (PEM)
The PET method using suitable
tumor-accumulating radiopharmaceuticals (usually
18 FDG or
FLT) is naturally also used in the
diagnosis of breast cancer. However, the
specific anatomical proportions of the breasts and the properties
of mammary lesions have led to efforts to develop smaller
single-purpose - dedicated, optimized - PET
imaging devices that would have a higher resolution for
small lesions typical of breast cancer. And also a shorter
acquisition time than with whole body PET and the application of
lower radio indicator activity. Basically, two technical
solutions of these specialized devices for PEM positron
emission mammography have been developed :
- The
first with its design resembles a classic X-ray mammography with compression,
only the X-ray tube and the detector are replaced by two flat
PET imaging camera detectors (in Fig.4.3.11 on the left), between which a breast is inserted with suitable
compression.
- The
second system is an small annular PET detector
of circularly arranged scintiblocks (approx. 48), of
significantly smaller dimensions than whole-body PET (approx. 20 cm diameter), usually one ring into
which uncompressed breast is inserted. The
breast hang freely inside the detector located under the lounger
with the hole on which the patient lies - Fig.4.3.11
on the right.
Fig.4.3.11. Technical design of PEM positron emission mammography
instruments.
Left: Compression PEM mammogram with
flat PET detectors. Right: Ring PEM
mammogram with loosely inserted breast without compression.
In both cases, coincidence
detection of a pair of annihilation photons by opposing detectors
is performed, with computer reconstruction (in the PEM ring it
creates the cross-sectional images, as in classical PET). The
advantage of these optimized PEM devices is better spatial
resolution (approx. 2-3 mm), allowing to detect even small
lesions in the breast (in case of good
accumulation even under 1 cm).
Although small PEM devices are significantly cheaper
than large universal (full body) PET cameras, the positron
emission mammography method has not become more widespread (unlike the widely used X-ray mammography - §3.2,
section "X-ray mammography"). One of the reasons is a
positron radiopharmaceutical with a short half-life, which is
difficult to access outside the larger workplace of nuclear
medicine. It serves only as additional method to X-ray,
sonographic or MRI mammography. However, in order to
visualize the more complex extent of the disease, it is still
necessary to perform PET imaging on a larger scale, including
nodes and potential metastasis. PEM is a specialized peripheral
method that is sporadically used mainly in the USA and Japan in
some larg complex oncology centers...
Specialized PEM devices in the world are
supplied by only two manufacturers: CMR Naviscan,
California, USA and IHEP - GaoNeng Medical Equipment,
Hangzhou, China .
| -------------------- minor physical-technical interest ------------------- |
Neutron Stimulated Emission Computed
Tomography ( NSECT)
NSECT (Neutron Stimulated Emission Computed
Tomography) is a new (and so far experimental) method of spectroscopic
imaging of the concentration of certain elements in an
organism using neutron interaction. Unlike
conventional emission computed tomography SPECT or PET, gamma
radiation is not emitted by radioactive isotopes, but by stable
isotopes in which the emission of g- radiation (characteristic
energy) is stimulated by inelastic scattering of
fast neutrons, by which the analyzed area is externally
irradiated. These stable isotopes may either be a natural part of
the tissue under investigation or may be introduced as molecular
indicators (similar to contrast agents or radioindicators), eg by
a metabolic pathway.

Fig.4.3.12. Principle of neutron stimulated emission computed
tomography NSECT.
The analyzed area (sample, tissue) is
irradiated with a beam of fast neutrons (energy
approx. 7-10 MeV) from a suitable collimated neutron source -
electronic neutron generator (§1.5, part "Accelerators", passage "Accelerators as neutron
generators") or radioisotope source ( .....). These neutrons collide
with the nuclei of the atoms of the irradiated material, and
there are basically three types of interactions (see §1.6, passage "Neutron
radiation and its interactions")
. For our purposes, the inelastic
scattering of neutrons is important, in which the
neutron transfers part of its kinetic energy to the nucleus and
this causes an increase in its internal energy - excitation
of the nucleus. When the nucleus returns to its
original state (deexcitation of the excited nuclear levels), a gamma
radiation photon is emitted with a
precisely determined characteristic energy,
given by the type of nucleus. These energies of secondary g- radiation from
excited nuclei range from tens of keV to about 6 MeV. By spectrometric
detection of this g-
radiation it is possible to determine which
elements are represented (according to the energy of the
line g)
and in what relative concentration (according to the intensity -
the number of photons in the respective peak). The spatial
distribution of these g-emitting nuclei can be determined
by gammagraphic detection (gamma camera) *). Or with a
spectrometric detector we can detect gamma radiation at
different angles. Computer maps of spatial distribution
of concentrations of specific chemical elements in the examined
tissue can be created by computer reconstruction of positions
(angles) and energies of this neutron-stimulated g- radiation.
*) The energy of g- photons emitted
from excited levels of stable nuclei during neutron excitation is
usually too high for imaging by standard gamma
cameras. They are hundreds of keV to several MeV (eg for 16O the Eg = 6MeV, for 12C is Eg = 4.5MeV). For
such energies, gamma camera collimators have poor spatial
resolution and luminance, and the scintillation crystals used are
too thin to achieve reasonable detection efficiency; also the
spectrometric properties are not good. Therefore, spectrometric
detectors not providing spatial information, but only the energy
spectrum, are used in current experimental methods. Information
on the position of the analyzed atoms is obtained either by
rotating the detector equipped with a collimator and scanning
from different angles, or by rotational scanning of the examined
object by closely collimated neutron beams. In this second
method, the path of the neutron beam defines the geometric
position of the examined volumes and the spectrometric detector
integrally scans all photons emitted by excited nuclei along the
path of the neutron beam (ie the part of
the photons that enters the detector).
Unwanted background pulses can be significantly reduced by using
a coincident spectrometer circuit, triggered by the pulse mode of
a neutron generator. This is followed by computer reconstruction
of data from individual projections. The resulting image is
basically 4-D : for each voxel of the 3-D image,
information about the energy of g- radiation ® representation of
various elements is also stored. By selecting a specific energy
(energy window), an image of the distribution of the
corresponding specific element is obtained.
Note: For the gammagraphy of this hard g- radiation, in
principle can be used special Compton cameras
(described above in the section "New and
alternative physical and technical principles of gamm-ray imaging", passage " High
Energy Gamma Cameras"), which are
also still experimental...
NSECT can in
principle show the distribution of all elements and their
isotopes, except hydrogen (whose nuclei do not have excited
levels and therefore, there is no stimulated g- emission) and
helium (which has too high an excitation energy of 25MeV).
Neutrons are penetrating particles, so structures in the depth of
the organism can be excited and displayed, with possible
correction of the absorption (attenuation) of the primary neutron
radiation as well as the registered stimulated g-radiation. The
diagnostic potential of NSECT is due to the fact that the
relative proportions of different elements, including trace
elements, are different for different tissue types. It also
differs slightly between healthy and tumor tissue. The method has
so far been tested in the early diagnosis of breast and lung
tumors. Apart from laboratory experiments, NSECT has not
yet been implemented, it will probably remain only a
physical-technical interest ...
Note:
NSECT has some analogies and common aspects with other methods of
neutron analysis of materials, especially neutron
activation analysis NAA (INAA), described in §3.4, part
"Neutron activation analysis". For special purposes of biological research is
occasionally used neutron activation analysis in vivo:
the relevant part of the organism is irradiated with neutrons
(from a reactor or neutron generator), followed by a standard gammagraphic
imaging of the distribution of induced beta
radioactivity accompanied by gamma photons, mapping the
distribution of the test substance in tissues and organs.
4.4.
Gated phase scintigraphy
In our organism (as well as in all higher
animals) there are two important organs
that work periodically in terms of time :
- The heart , which by regular contractions - systole
and diastole of the ventricles and atria - acts as a
"pump" to ensure the circulation of blood in
the body.
- The lungs , which, through their breathing
movements - shrinking and expanding, inhaling and exhaling
- carry out the exchange of air and oxygenation of the blood
in the body and the removal of carbon dioxide.
These periodic events are not
exactly regular and constant, their frequency fluctuates
and varies individually, depending on the health and mental state
and especially the physical load. The heart frequency at
rest is about 55-75 pulses/min., the respiratory frequency around
15-20 breaths/min. However, with intense physical exertion, it
can also increase 2-3 times - the need for faster blood pumping
through the heart and faster exchange of oxygen and CO2 by breathing.
During this periodic activity, there
are a relatively rapid movements of individual
parts of the heart and lungs towards each other and with respect
to the surrounding tissues and organs. These movements can be
disturbing during scintigraphic diagnostics - they cause motion
blur of the respective structures in the scintigraphic
image.
In scintigraphic analysis of own periodic
actions in an organism, this periodicity can be
advantageously used in a methodological approach called gated
or triggers scintigraphy. In addition to
scintigraphic impulses, another electrical signal is also
recorded from the camera - an ECG or a respiratory signal - which
suitably controls (triggers, gates) the course of the
acquisition.
Phase
scintigraphy of fast periodic processes - cardiac activity
Dynamic scintigraphy of the rapidly
time-varying distribution of radioactivity encounters
fundamental physical and technical problems. In order to
faithfully capture the dynamics of the monitored process, it is
necessary to use the best possible time resolution,
ie a high frequency of short-term frames. The statistical
character of radioactive decay then leads to significant statistical
fluctuations of the measured pulses in the image.
Relative statistical fluctuations are given by the expression 1/ÖN, where N
is the number of pulses in the image cell accumulated over one
frame. At high time resolution, the storage time of one image is
very short (of the order of 10-2 s), the numbers of accumulated pulses are small and
statistical fluctuations are very large *). The solution is not
an enormous increase in applied radioactivity (this is usually not possible for other reasons,
especially radiohygienic), because due to
the dead time, the detection device is not enough to effectively
process such a fast flow of pulses.
*) For accurate capture of cardiac
activity, it is necessary to divide the heart cycle into very
short time intervals; since the cycle lasts approximately 1
second, the acquisition time of one frame should be approximately
0.03 seconds. With this extremely short measuring time, the
statistical fluctuations of the recorded pulse frequencies are so
large (tens of %) that they do not allow the individual images to
be evaluated. In such pictures, it would not even be possible to
know which organ it is - only a shover of chaotically scattered
dots would be visible.
Thus, at first glance, it seems
completely impossible to perform a detailed dynamic scintigraphy
of one cardiac cycle. Fortunately, however, there are two
favorable circumstances :
1. Cardiac activity is a periodic
event (this is true at least approximately) ;
2. Cardiac activity is accompanied (or
triggered) by electrical signals, that can be
detected externally .
In the case where the observed
event is periodic, ie the distribution of
radioactivity is a periodic function of time, the situation is
significantly more favorable. If we denote the scintigraphic
response function f(x, y, z, t), where x, y, z are positional
coordinates, t is time, then the following will apply to
the periodic process: f(x, y, z, t) @ f(x, y, z, t + k.T), k =
0,1,2, ...., T is the period ("@"means that equality is
valid only on average, except for statistical fluctuations in
decay and registration). The dynamic scintigram of such a process
is then in principle given by the scintigraphic sequence of
images of only one period (cycle). And conversely, the
periodicity of the process offers the possibility to create a
dynamic study of one cycle (periods) with a very high time
resolution and at the same time with satisfactory
"statistics": we measure several hundred individual
cycles in succession with a high time resolution as they follow
each other, and then synchronously compose (added up) the results
frame by frame based on periodicity to create dynamic study of
only one cycle :
FN (x, y ,z ,t)
= k=1SN f [x ,y, z, t+(k-1).T] , t Î < 0,T ) .
Such a synchronously composed study FN(x, y, z, t) will be called a phase dynamic
scintigraphic study - it is a study of one
"average" or "representative" cycle, composed
of N common cycles of periodic process.
This can be done directly (without
additional information) using a computer if the period T
is exactly known and constant. In practice, however, this is
usually not met, eg the heart rate fluctuates somewhat. From
statistically strongly scattered data, the computer does not
completely "recognize" the individual phases of the
periodic event and then has nothing to compose synchronously.
Therefore, it is also necessary to input certain synchronization
pulses (marks) to the computer from the outside, which
make it possible to pinpoint the end of one cycle and the
beginning of the next cycle. In the case of cardiac activity,
such synchronizing or gating pulses can be signals from the ECG
(R-waves), by means of which the computer always
"recognizes" the end of one and the beginning of the
next cycle.
 |
| Fig.4.4.1. Left: Schematic of
creating a gated phase dynamic scintigraphy of the
cardiac cycle based on scintigraphic data from the camera
and synchronization derived from the R-wave of the ECG. Right: Images from many different heart cycles are added synchronously to form a series of images capturing a single average cycle. |
The principle of construction of the phase dynamic study of the cardiac cycle is shown in Fig.4.4.1. The computer program divides the time interval between two R-waves into short intervals of length Dt = T/(number of frames per cycle), where the number of frames per cycle is usually chosen 32, sometimes 16. Signal derived from the R-wave (electronically from its leading edge) determines the beginning of the cardiac cycle. Scintigraphic pulses corresponding to the beginning of the cardiac cycle in the interval 0 to Dt are recorded in the first image in the computer's memory. In the time from Dt to 2.Dt, the pulses are stored in the second frame, in the time from 2.Dt to 3.Dt to the third frame, etc. In the same way, the duration of the next cardiac cycle is divided, the beginning of which is signaled to the computer by another R-wave from the ECG; pulses registered during the first interval Dt are added to the first image of the previous heart cycle, pulses registered from Dt to 2.Dt are added to the second image of the previous cycle, etc. This process is repeated many times, forming a phase dynamic study of one average cardiac cycle in the computer's memory.
Cycles selection and
excluding
As is well known, the heart rhythm is never completely regular,
the heart rate and the period are more or less variable,
even arrhythmias can occur. Only those cycles whose period does
not differ too much from the average period need to be taken into
account in the calculation. Irregular cardiac cycles, ie those
whose duration is different from normal regular cycles, should be
excluded from the record. These false cycles,
caused by extrasystoles or other heart rhythm disorders, would
distort the overall dynamics of the average cycle - it would no
longer be a representative cycle. The limits for selecting the
"correct" cycles are usually chosen to be ± 10% of T.
It is necessary to exclude not only such an incorrect cycle with
an anomalous period, but also cycle following it, as it may not begin
at the correct stage of end-diastole. Due to the slightly
fluctuating cycle length, the accumulated number of pulses in the
last phase images is artificially reduced. In order not to
distort the dynamics of the terminal section of the phase curves,
an appropriate correction is made based on the number of cycles
that contributed to the individual phase frames (the last few points of the phase curves are multiplied
by factors > 1, inverse to the ratio of the number of cycles
contributed to these last phase frames).
LIST-mode acquisition
The method of acquisition into image matrices described above is
sometimes referred to as frame-mode. In earlier
generations of acquisition computers, where a sufficiently large
operating memory was not available, acquisition in the so-called LIST-mode
was used: the coordinates (x,
y) of individual pulses were sequentially stored in the memory as
they came one after the other. Synchronization pulses from the
ECG were also recorded into this continuous data stream under
appropriate coding. Conversion to scintigraphic images
(re-framing) and construction of the own phase study was then
performed additionally. The advantage of
LIST-mode was that the data could be subsequently re-framed with
different selection of correct cycles, which is important in some
heart rhythm disorders (such as bigimenia), when the correct
phase study cannot be obtained in frame-mode. LIST-mode has been
practically abandoned for dynamic scintigraphy for many years,
but now it is being used for some iterative tomographic methods (§4.3, section "Computer reconstruction of SPECT", "Reconstruction of PET images", "TOF - time
localization of the annihilation site") .
First-pass phase
scintigraphy
The above-described method of construction of phase dynamic
scintigraphy of the cardiac cycle is performed in situations
where blood carrying a radioindicator (eg 99mTc- labeled erythrocytes) is evenly and steadily mixed
in the bloodstream - the so-called stady-state
blood pool method. We will briefly mention the construction of
phase scintigraphy of the cardiac cycle using the first-pass
method, where the radioindicator is applied to the circulation as
a compact bolus. Acquisition from the camera
into the computer's memory starts when the bolus arrives in the
heart chamber and ends before recirculation begins (when the
structures would already overlap).
 |
Fig.4.4.2. Construction of a phase dynamic study of the cardiac cycle in first-pass radionuclide ventriculography. The "pulsated" curve represents the time course of radioactivity in the left ventricle during the first bolus flow. |
Fig.4.4.2 shows the time course of
radioactivity in the left ventricle during such a measurement.
The curve is "pulsated" due to the periodic filling and
emptying of the chamber by blood, bearing radioactive bolus. The
construction of the phase dynamic study of the cardiac cycle is
performed in a similar way as with the steady-state method, but
only a few cycles can be taken into account - starting with the
bolus arrival in the left ventricle and ending with the onset of
recirculation, when the images of the chambers would already
overlap.
The advantage of the first-pass method is that the
radioactivity is contained only in the chamber, so on the one
hand the problem of correction on tissue and blood background is
eliminated, on the other hand it allows scintigraphic
"view" of the heart chamber even in such directions, in
which at steady-state method would overlap the images of the
right and left ventricles and possibly and other structures. The
main disadvantage of the first-pass method compared to the
steady-state method is the small number of cycles from which the
phase study is created; therefore, the image quality is not very
good due to statistical fluctuations. In addition, such a study
may not represent a representative cardiac cycle, as selection of
the "correct" cycles is not feasible here and
acquisition is performed immediately after injection of a
radiolabel, when central hemodynamics are affected by stress.
From the quantitative parameters, therefore, only the ejection
fraction can be objectively evaluated. The first-pass method is
now rarely used to construct phase scintigraphy of the cardiac
cycle. Used only bolus radiocardiography (§4.9.4, section "Dynamic bolus angiocardiography").
The method of phase (gated) scintigraphy is practically exclusively used in nuclear cardiology (§4.9.4 "Nuclear cardiology"). It is both radionuclide ventriculography (§4.9.4, the "equilibrium gated ventriculography"), whose comprehensive analysis program VENTR is described in §3.1 "Radionuclide ventriculography" books "OSTNUCLINE - Comprehensive assessment of scintigraphy", in recent years, the mainly SPECT myocardial perfusion (gated myocard SPECT - §4.9.4, part "Scintigraphy of myocardial perfusion").
Author's
note :
We have been engaged in research and development of methods of
scintigraphic phase dynamic studies with high time resolution at
our workplace since 1976, practically in parallel with the
development of these methods in leading laboratories in the
world. An electronic device for R-wave detection and implantation
of synchronization pulses into a computer was designed. We
developed a program for the reconstruction and mathematical
evaluation of radionuclide ventriculography on a small computer
device Clincom (operational memory
only 12k!), which was probably the most
complex procedure in this area at that time; then served
as the basis for a comprehensive program VENTR ( "Radionuclide ventriculography ") on
the GAMMA-11 device and later on a PC, the OSTNUCLINE system.
Several dynamic phantoms were also constructed for this research
and development work (starting with a rotating gramophone disc
and ending with a flexible dynamic phantom of heart pulsation and
circulatory pumping); some of them are described in the work
"Phantoms
and Phantom Measurements in Nuclear Medicine", part.4. "Dynamic phantoms".
4.5.
Physical parameters of scintigraphy - imaging quality and phantom
measurements
The task of scintigraphy is to provide a quality, ie objective,
detailed and accurate imaging
of the distribution of radioactivity in the examined object, both
spatially and temporally
(dynamic scintigraphy). We have mentioned above several
limitations and adverse effects of a physical
and technical nature that limit the
possibilities and quality of scintigraphic imaging ("Adverse effects of scintigraphy"). To assess the quality of
scintigraphic imaging, its optimization and detection of possible
errors and defects, it is necessary to analyze
and test the physical properties of
scintillation cameras. As with any complex measuring instrument,
the scintillation camera's properties can be described by several
physical parameters :
Spatial resolution of a gamma camera
A scintillation camera is an imaging device, so
the most important parameter is its distinguishing
ability, or spatial or positional
resolution (given in length units - millimeters) :
| Spatial resolution |
| The spatial resolution of a scintigraphic image is called the smallest distance [mm] of two point radioactive sources in the displayed object, which are still distinguishable from each other in the scintigraphic image as two different objects . |
| Equivalent definition : |
| By spatial resolution we mean the width of the FWHM profile in the image of a point or line source in the middle of the maximum height of this profile, converted to the spatial scale in the object [mm] . |
The spatial resolution is thus given by the half-width of the image profile of the point or line source; it is called FWHM (Full Width at Half Maximum). Two point radiation sources can be distinguished from each other in the scintigraphic image, only if the distance between them is at least FWHM - Fig.4.5.1 :
Fig.4.5.1 Spatial resolution of scintigraphic imaging
- analysis of images of point sources, which are displayed as
"blurred" scattering circles.
a) By a "blurred" image of a point
source we lead a profile curve PSF
(Point Spread Function), its half-width FWHM
indicates the resolution of the display. b, c, d, e)
Images of two point sources located at different distances from
each other. If this distance is greater than FWHM, these sources
are displayed as two separate objects. When approaching in to a
distance equal to FWHM and smaller, this two images already merge
into one - the sources can no longer be distinguished
from each other. g) Schematic representation of
the interweaving, superposition and merging of images of two
closely spaced point sources (on PSF profile curves) -
corresponds to the situation according to Fig. e)
.
Note: It was measured with point
sources with a diameter of approx. 1mm, 50MBq 99mTc, on a Nucline
MB9201 camera close to the front of the HR collimator, matrix 256
x 256,
zoom 2x, with
strongly enlarged image sections, approx. 4x. Slight deformations of the
circular shape of the images of point sources were caused by
small geometric irregularities of the holes of the HR collimator (which are visible at this high magnification, but do
not manifest themselves in practical scintigraphy).
In addition to FWHM, the resolution of the
camera is sometimes characterized also by the parameter FWTM
(Full Width at Ten Maximum), which is the width of the image profile of the line
source in tenths of the maximum height of the profile. Of course,
this value is higher: in situations without a
scattering environment, it is approximately FWTM @ (1.8 - 2) x FWHM, in the presence of a tissue (or aqueous)
scattering environment, it is approximately FWTM @ (2 - 2.5) x FWHM.
Spatial resolution
FWHM <--> modulation transfer function MTF
It should be noted that the FWHM value determined with PSF or LSF
may not to capture the quality of the display
completely objectively in terms of resolution! Scattered
radiation and cross-radiation trought the collimator septa mainly
expands the lower part of the PSF, lower than 50% (see Fig.4.3.3d, and Fig.4.5.4e),
so it may not affect the value of FWHM. For a completely detailed
physical analysis of the distinguishing properties of imaging
systems, the so-called modulation transfer functions
(MTF) are used - see the work "Theory of scintigraphic imaging and
modulation transfer functions",
which take into account all points of PSF.
Terminological note:
The spatial resolution of a gamma camera is sometimes abbreviated
to resolution. Please do not confuse with
spectrometry energy resolution (....) or time
resolution (as the detector dead time is
sometimes called "Detector
dead time") - it's
something completely different..!.
The spatial
resolution of a classic single-photon gamma camera - planar,
SPECT - is determined by two components :
1. Geometric resolution of collimator
Rcolim ,
which depends on the hole diameter d and
the length of the holes - channels L of
the height (thickness) of the collimator, significantly also on
the distance h of the displayed object
from the collimator :
Rcolim ~ d. [1 + (h + m) / L] ,
(4.5.1)
where the width of the gap m between the rear face of the
collimator and the camera crystal (its
center) is still manifested - Fig.4.5.2a.
The resolution of the collimator is manifested by the fact that
each point (point source) in the object is geometrically
projected on the camera detector as a small blurred
circular trace with a diameter dependent on the Rcollim - Fig.4.5.2b.
|
|
| Fig.4.5.2
Two basic components of the spatial resolution of
a gamma camera - a collimator and a crystal +
photomultipliers. a): Trigonometric analysis of the collimator resolution. From each hole of the parallel collimator we can draw an imaginary cone defining the area from which gamma radiation can pass through this hole to the camera detector (radiation from places outside this cone is absorbed by the lead septa of the collimator). As the distance from the collimator increases, this detection cone widens, thus deteriorating geometric spatial resolution of the image projected by the collimator onto the scintillation crystal of the gamma camera. b): The resolution of the collimator is manifested by the fact that each point (point source) in the object is geometrically projected on the camera detector as a small blurred circular trace with a diameter depending on the distance from the collimator. c): Approximate representation of the internal resolution of the camera detector, related to statistical fluctuations of detected scintillations, blurring X, Y coordinate pulses and Compton scattering of gamma photons. d): 99mTc point source display at different distances h from the front of the collimator HR - degradation of FWHM resolution with distance .. |
|
The spatial resolution of the collimator
improves with increasing the length of the holes - channels
(thickness of the collimators) and decreasing the diameter of the
holes. Collimators with small and longer holes have better
resolution (and at the same time less
dependence on distance). The spatial
resolution of the gamma camera significantly deteriorates
with the distance *) of the displayed structure from the
front of the collimator (Fig.4.5.2b, and
Fig.4.5.6 on the
left). The gamma camera (front of the collimator) should
therefore be placed as close as possible to the
surface of the patient's body.
*) For collimators with
a different arrangement of holes (described
above in §4.2, section "Scintigraphic
collimators") the geometric situation is more complicated, but
basically the same rule applies to the deterioration
of the spatial resolution at a greater distance
from the collimator face - Fig.4.5.6 on the left.
Transverse
radiation trough the collimator partitions
For the correct imaging function of the collimator, it is
necessary that gamma radiation passes only through the holes,
while the partitions between them would not transmit radiation.
However, this cannot be fulfilled 100%, a certain part of the
radiation penetrates even through the septa. Especially at higher
energies gamma may cause transverse radiation of
gamma rays trough collimator septa, if these partitions between
holes are thinner than is optimal for the gamma energy used.
Transverse radiation trough the septa impairs the
contrast of the scintigraphic image. If the low-energy
LEHR collimator, optimized for 140keV 99mTc, were used for scintigraphy with 111In or even with 131I., we would get an
image with greatly degraded contrast! The effect of
transverse-radiation trough of septa and its influence on the
quality of scintigraphic imaging is analyzed in Fig.4.5.3 :
Fig.4.5.3 Transverse radiation of gamma photons trough septa of a
collimator and its influence on the quality of a scintigraphic
image.
a) Schematic representation of the aborption of
low-energy gamma radiation in lead septa between the collimator
orifices and the partial transverse radiation of high-energy
gamma through the collimator septa.
b) The transverse radiation of photons of higher
energy trough the collimator septa causes the expansion of the
edge parts of the point source image (red
part of the PSF curve).
c) , d) , e) Images of
point sources of radionuclides emitting various energies of gamma
radiation - 99mTc (140keV), 111In (245keV), 131I (364keV), recorded with a LE HR collimator for low
energies.
f) Phantom Jasczak, filled with 111In and displayed with a gamma camera with a collimator
Medium Energy (top) and a low-energy collimator LE HR (bottom).
Radiation trough the LEHR septum completely degrades the contrast
of the image here - an almost invaluable scintigram.
Note: The typical
"star-shaped artifact" of diagonal transverse radiation
is due to the geometric configuration of the holes and lead
partitions, which are projected somewhat narrower in the diagonal
direction. For different types of collimators, the shape of this
artifact may be somewhat different, depending on the details of
the geometric design of the openings and partitions.
The proportion of radiation penetrating the
barrier between the apertures - transmission factor, is
e-m .stran, where m is the linear absorption coefficient of the collimator
material (lead) for the required gamma energy and stran is the shortest
path that gamma radiation can penetrate the barrier from one hole
to adjacent hole. For a collimator with the diameter of the holes
d , their length L and the thickness of the baffles
s, the shortest
path of transverse radiation trough the baffle stran = s.L/(2d + s), so that the
transmission factor is e-m
.s.L/(2d + s). Optimization
of partition thicknesses between the holes is performed on
the basis of the requirement for a sufficiently low value of the
transmission factor (most often 0.05); this leads to a condition
for the transmission factor e-m
.s.L /(2d + s) < 0.05
(described in §4.2, passage "Scintigraphic
collimators"). This gives a
limitation for the thickness of the collimator baffles s > (6.d/m) /[L - (3/m)].
Effective length of the collimator holes
In the formula (4.5.1) for spatial resolution, we did not
consider transverse radiation trough the collimator septa.
If transverse radiation occurs, it causes a seemingly effective
shortening of the actual length of the collimator holes in
terms of geometric collimation. Therefore, the so-called
effective length of collimator holes Lef = L-2.m-1 sometimes introduce, where m is the linear
coefficient of attenuation in the collimator material
(lead); it is a correction for the transmission of photons
through two opposite baffles between the holes. The introduction
of Lef
instead of L in (4.5.1) describes the deterioration of
resolution by transverse radiation. However, this is not very
important, because the PSF does not have a Gaussian shape here,
it is widened in the lower part and leads to a
deterioration of not so much the FWHM resolution value,
as the image contrast, as seen in Fig.4.3.5d,
e).
2. Internal resolution of the camera
detector Rint
Internal
(proper, intrinsic) resolution is
given by the accuracy with which the system of
photomultipliers and related electronics is able to locate
the position of scintillation in the crystal. At the quantum
level, the internal resolution is influenced by statistical fluctuations
in the production of light photons after the interaction of g- radiation in the
detector and variations in the number of electrons emitted from
the photocathode and dynodes of the photomultipliers. These
fluctuations "blur" the
amplitudes of electrical signals from photomultipliers and thus
the values of the resulting coordinate pulses X, Y - Fig.4.5.2 c.
Using a larger number of photomultipliers with higher quantum
efficiency and good optical contact with the crystal leads to
somewhat better internal resolution.
The thickness of the crystal
also has a negative effect here, in two ways. On the one hand, it
is a geometric "blur" of the positions of
light flashes registered by photomultipliers - scintillations
occur at different depths, and the system of photomultipliers
evaluates their positions X, Y somewhat differently. Furthermore,
it is the multiple Compton scattering of g- photons in the
detector, which also causes uncertainties in the X,Y-localization
of the interaction site of primary gamma-photons. A thinner
crystal and a larger number of photomultipliers allow you to
achieve better resolution. For these reasons, thin
scintillation crystals about 0.7-1.8 cm thick are used. Current
scintillation cameras, optimized for g 140keV, have a crystal
thickness of mostly 9.5mm and achieve an internal resolution of
2.5-3.5 mm.
The total resolution
of the R gamma camera (external -
extrinsic)
is then given by the geometric sum
of both subcomponents: R = Ö(R2int + R2collim). However, in practice, the total resolution is not
calculated according to this relationship, but is measured using
the point or line sources placed in the field of view of the
camera with the given collimator ("Phantoms
and phantom measurements in nuclear medicine", section "Measuring
the positional resolution of the camera").
In practice, it is given in the
first place for each camera its internal
resolution, which is determined from the
production technology - typical values of internal
resolution for newer cameras are about 2.5-4 mm. The internal
resolution represents the limit value of the resolution,
below which at the given camera can no longer be reached, and
which can only be approached using an ultra-high resolution
collimator.
Furthermore, the total
resolution of the camera with individual
collimators for the given distances of the source from the
collimator (usually 10 cm), or even in the presence of a
scattering environment (scattering
environment between the radiation source and the detector - water
and tissues, which is always present in scintigraphic imaging of
radioactivity in the body, somewhat worsens
spatial resolution and more markedly worsens a contrast in the
image).
These values of the total resolution
are different, for LE HR collimators (high resolution), optimized
for 140keV 99mTc, at a distance of 10 cm from the front of the
collimator, it is about 8-10 millimeters. For collimators for
higher energies, the overall resolution (in
10 cm) is worse, about 12-15 mm. As
analyzed above, the spatial resolution of the gamma camera
significantly deteriorates with the
distance of the displayed structure from the collimator
front. The gamma camera (front of the
collimator) should therefore be placed as
close as possible to the patient's body surface when
scanning.
Influence of scattered
radiation
Compton scattering of gamma radiation in the
material environment - in the patient's tissue, also contributes
to the deterioration of the image quality (the physical nature is described in §1.6, section
"Interaction of gamma radiation and
X", passage "Compton
scattering"). Scattered
radiation primarily impairs the contrast of
scintigraphic imaging, to a lesser extent the spatial resolution
of FWHM. This effect is analyzed in Fig.4.5.4 :
Fig.4.5.4 Compton-scattered gamma radiation in
scintigraphy and its influence on the quality of
scintigraphic image.
a) If, coincidentally, the photon is
scattered in the tissue at such an angle that the scattered
photon passes through the collimator orifice and is detected by
the camera crystal, then these scattered photons g´ can be detected from a false
location - is detected gamma photons
seemingly coming from another places, from where it was
originally radiated during the radioactive transformation.
b) These false scattered photons g´ have a lower
energy than the "true" direct and primarily
detected photons g (part of the energy was transferred to the electron e- when
scattered in the substance), so they
usually do not fall into the photopeak. By carefully setting
the analyzer window to the photopeak of the given
radiation g, we can therefore largely eliminate the
Compton-scattered radiation g´.
c) , d), e) Images of point
source without scattering medium (c) and with scattering medium
in photopeak measurement (d), and including Compton scattering in
a wide analyzer window (e).
f), g) An image of the Jasczak water phantom with a
narrow photopeak window and a wide window, including scattered
radiation (deterioration of the image
contrast can be seen) .
Note: Spatial resolution of
PET
For two-photon cameras of coincidence positron emission
tomography PET, the physical principle of imaging and
analysis of spatial resolution is different - it
was described above in §4.3, passage "Spatial
resolution of PET" (spatial resolution of PET cameras is generally somewhat
better than conventional Anger cameras).
The measurement of the
spatial resolution of the camera
can be performed in two ways :
¨ Quantitative
physical measurement
- by analyzing images of point and line sources, through which we
conduct profiles - sections, thus obtaining PSF
or LSF curves. From them, we then directly
determine the value of the half-width-resolution FWHM
in [mm] (or by a more complex analysis of
the so-called modulation transfer function MTF ....
"...") . For practical
determination of the resolution, it is more appropriate to use a line
source, by image of which we can conduct independently
of several LSF profiles, or sum these profiles and thus achieve
smaller statistical fluctuations.
 |
| Fig.4.5.5. Measurement of positional
resolution of a gamma camera. Left: Line source (capillary) and two point sources for measuring positional resolution. Middle, right: The measurement was performed with a filling solution of 99mTc at distances of 0, 5, 10, 15 and 20 centimeters from the front of the collimator HR of the camera Nucline TH. The degradation of FWHM resolution with distance can be seen in the images and profile curves. |
¨ Visual
evaluation of phantom images
- most often they are so-called Bar-phantoms placed to a
planar homogeneous source (mostly 57Co), or vessels of complex structure, filled with a 99mTc solution (eg Jasczak
phantom ). It is a more or less qualitative
evaluation, the value of the resolution is rather estimated from
the images; however, it is usually sufficient for practice and
comparison. Performing of both methods of resolution measurement
is described in the work "Phantoms and
phantom measurements in nuclear medicine", section "Measurement of positional resolution of the
camera".
Sensitivity (detection efficiency) of
a scintillation camera
Detection efficiency or sensitivity S
of devices for detection and spectrometry of ionizing radiation -
radiometers - is generally defined as the ratio
between the number of detected pulses (quanta
registered by the detector) and the number
of incoming radiation quanta; the relative and absolute
efficiency is introduced, often expressed in % (physically defined and discussed in §2.1, section
"General physical influences
and instrumentation for the detection and spectrometry", passage "Detection efficiency
and sensitivity").
Detection efficiency of the classic
single photon gamma camera - planar, SPECT - is determined by two
components :
1. Geometric transmittance
(aperture) of the collimator for gamma radiation
indicates, what part of the incoming gamma photons the collimator
passes on to the camera detector (unlike photons which are absorbed in the collimator
septa). It depends in principle, on what
part of the total area of the collimator is occupied by the
through holes and what part of the absorbend lead baffles between
them. According to the trigonometric analysis in Fig.4.5.2a, the geometric
transmitance Scollim of the parallel collimator is :
Scollim = (d/L)2 . [d2/(d + s)2] . Kg . [100%] ,
(4.5.2)
where d is the diameter of the holes, s thickness
of the baffles, L is the length of the holes-channels
given by the thickness of the collimator. The geometric factor Kg depends on the shape
and arrangement of the holes and partitions (for
circular holes in a hexagonal arrangement is Kg = 0.24, for hexagonal
holes in a hexagonal arrangement is Kg = 0.26, for square holes in a quangangular arrangement
is Kg =
0.28). Conventional LE HR collimators have
a geometric transmitance of about 1.2%, LEAP about 2%, HS about
2.2%. ..............
Note: In the
equations for spatial resolution (4.5.1) and detection efficiency
of the camera (4.5.2) we did not consider transilumination
gtrough collimator septa. If it occurs, it leads to a
deterioration of the image quality (see Fig.4.5.3), but at the
same time to an increase in detection efficiency. However, this
is a negative phenomenon, the quantification of which in physical
parameters is irrelevant ...
Independence of gamma camera detection efficiency on distance
The intensity of the radiation decreases with the square of the
distance from the source (this is exactly
the case for a point emitter). Therefore,
the detection efficiency of conventional radiometers is
significantly reduced for greater distances from the measured
sources. However, for gamma cameras with parallel collimators,
the detection efficiency (sensitivity) does not depend on
the distance of the displayed source from the collimator
front! In formula (4.5.1) the parameter h of distance does
not appear. The display of the point source in a wide range of
distances 0-30cm from the front of the collimator in Fig.4.5.2 d,
although it does shows a deterioration of spatial resolution and
decreasing image brightness, but the total number of pulses is
the same in all images, area (integral) under PSF is the same for all distances.
This surprising behavior is due
to the specific properties of geometric collimation
for parallel collimators. We can clearly illustrate this
according to the schematic drawing in Fig.4.5.2 a,b as follows:
As the source moves away from the collimator front, the number of
photons incident on the individual holes decreases
quadratically as 1/h2. However, the number of holes through which radiation
can pass to the detector increases quadratically
in proportion to h2. These two opposing trends cancel each
other out, so that the total photon flux - the efficiency of
the collimator - does not change with the
distance between the source and the collimator.
Note: This rule does not
apply to special convergent or Pinhole
collimators, the detection efficiency here changes
significantly with distance - it increases or decreases (see the section "Imaging
properties of special collimators"
below).
2. Internal detection efficiency of
the crystal and photomultipliers of the camera
Sint ,
indicating which part of the gamma photons incident on the
detector (i.e. passed through a collimator), is actually detected by the system of
scintillation crystal, photomultipliers and analyzer, in the form
of pulses creating the scintigraphic image. It depends on the thickness
and conversion efficiency of the scintillator,
the gamma radiation energy, setting the window
width of the analyzer to the photopeak. The photopeak
detection efficiency of a standard gamma camera detector with a
9.5 mm thick crystal for 140keV 99mTc is about 80%, for 364keV 131I then about 30%.
Overall - system
detection efficiency
- sensitivity of the camera S is then
given by the product of both of these components Scollim .
Sint ; while doing so the main determining component is the
efficiency of the collimator. However, in gamma cameras, where
the source of gamma radiation is a radionuclide,
the sensitivity - detection efficiency - is usually quantified in
a special way: as the number of pulses detected by the
camera per unit time [per second] - cps,
referred per unit of activity [kBq, MBq] of the
radionuclide used in the displayed source; for the planar/SPECT
scintigraphy is usually 99mTc, for the PET 18F. Only exceptionally is it expressed
here in %.
In scintigraphic diagnostics, we are
mostly concerned with the relative assessment of
the distribution of the radioindicator in various parts of the
examined object. In the case of so-called quantitative
scintigraphy, however, we may also be interested in the absolute
activity of the radioindicator in the investigated area.
In order to determine this real activity from a scintigraphic
image, we need to know the efficiency
(sensitivity) of radiation detection g of
the used radionuclide by a scintillation camera. We also need to
know the detection sensitivity of the gamma camera to determine
the optimal applied activity of the radio
indicator to obtain sufficiently high-quality scintigraphic
images.
In the case of scintillation
cameras, for practical use, the detection sensitivity is
related to the radioactivity of the examined object :
| Detection efficiency (sensitivity) of a scintillation camera |
| The
detection efficiency, or sensitivity S, of the
gamagrapfic system is quantified as the pulse frequency N[imp./s]
measured by a scintillation camera with a
point radiation source g (located at
the desired field of view), relative to the
activity unit A[MBq] of the
source: S = N / A . It is expressed in units [imp. s-1 MBq-1 ], or [cps/MBq] or [cps/kBq] . |
It is given for a specific type of radionuclide
and collimator. Most often, the sensitivity for planar and SPECT
cameras given for radionuclide 99mTc, for PET cameras 18F.
For different radionuclides, the sensitivity of a scintillation
camera generally has different values, depending on the yield of
gamma photons [%] (number of gamma quanta/100 conversions of the
radionuclide) and their energy [keV].
The basic physical
measurement of the detection efficiency of a gamma
camera - at a given distance and location of the field of view -
is performed with a point source of the required
radionuclide. We can thus perform detailed measurements of the
dependence of the detection efficiency on the distance in
different places of the field of view (as
can be seen in the right part of Fig.4.5.6).
Another way of measuring the "averaged" sensitivity is
with a planar source, which lies entirely in the
field of view (this method is especially
suitable for cameras equipped with a parallel collimator) - in the image of the planar source are averaged
event. local sensitivity inhomogeneities and
measurement error may be somewhat reduced. According to the
recommended NEMA procedure (to ensure good
accuracy and reproducibility) we determine
the sensitivity of the camera by placing a 10cm diameter bowl
with 99mTc
solution with exactly known activity in the middle of the field
of view - approx. 10MBq, a layer of solution up to 1cm. We
accumulate a scintigraphic image with the given collimator and in
the required configuration (acquisition
time min. 100sec), in which we determine
the number of pulses in the ROI of the bowl image and convert it
to 1MBq and 1sec.
In addition to the actual detection
efficiency of the scintillation crystal of the camera on
the given gamma radiation, the resulting, total - system
sensitivity depends decisively on the collimator
used. For universal collimators of the LEAP type, the sensitivity
of scintillation cameras for 99mTc is around 150-300 cps/MBq, for high-resolution (HR)
collimators only about 50-100 cps/MBq 99mTc. As discussed above, for parallel
collimators, the registered number of pulses is virtually independent
of distance, while for convergent and Pinhole
collimators. (§4.2, part "Scintigraphic
collimators") the dependence of the detection sensitivity on the
distance from the collimator face is very significant - Fig.4.5.6
on the right (it is derived below in the
section "Imaging properties of special
collimators"; the independence of
the detection efficiency over distances is maintained with these
special collimators only for sources with a homogeneous
area distribution of activity exceeding the field of
view).
For PET positron emission
tomography cameras, which use electronic coincidence
collimation instead of mechanical collimators, the detection
sensitivity is significantly higher, approx.
7000-10000 cps/MBq 18F - see §4.3, passage "Detection
efficiency (sensitivity) of PET".
Fig.4.5.6. Dependences of the spatial resolution FWHM (left)
and the detection efficiency of the S (right)
gamma camera on the distance of the source from the front of
different types of collimators. In the box on the far right, the
entire detection efficiency curve for the convergent collimator
is plotted up to a distance of 70 cm, capturing a significant
maximum in the focus and the subsequent decrease.
Note: These
curves are only approximate and are more or less illustrative.
They were created by comparing and interpolating a series of
measurements of point and line sources 99mTc with different collimators on cameras PhoGammaHP,
Nucline MB9201 and TH, Symbia T. Specific values of resolution
and sensitivity may differ slightly for individual cameras of
different types and manufacturers, but dependency trends
are captured objectively .
Influence of the material
environment
The analysis of the detection efficiency
(sensitivity) of the gamma imaging was performed from above in a
situation without a substance-absorbing environment - in
vacuum or in air. However, in practical
scintigraphy, there is a tissue environment
between the imaged structures with distributed radioactivity in
the organism and the gamma camera, with which gamma radiation
interacts, which mainly leads to the absorption
and attenuation of gamma radiation. During the
passage of the tissues from the point of origin towards the
camera detector, a certain amount of radiation g is absorbed
during the interaction with the tissue substance - due to the
photoeffect and the Compton scattering in the tissue. It leads to
exponential decrease in the count frequency of N
detected photons g with increasing depth h of the radiolabel distribution in the body:
N = No .e -m .h, where m is the linear attenuation coefficient, depending on the
radiation energy g and on the tissue density (for g 140keV 99mTc this absorption
coefficient is m @ 0.15 cm-1). This loss of gamma-ray by absorption, also called attenuation,
is manifested in scintigraphic images by an artificial reduction
the number of pulses from structures deposited at
greater depths, compared to structures closer to the surface. In
such a case, the statement that the detection efficiency
(sensitivity) does not depend on the distance of the
displayed source from the (paralell) collimator face no longer
applies. Here, the detection efficiency decreases
significantly with the distance - depth - of
the displayed source !
An approximate
dependence of S ~ R-2
applies between the sensitivity of the camera S and its
total spatial resolution R (= FWHM) (for
parallel collimators it follows from the comparison of formulas
(4.5.1) and (4.5.2) ). So the better
the resolution of the imaging system, ie the smaller R =
FWHM, the lower its sensitivity - and vice versa. When
trying for high resolution (using a UHR collimator), this leads
to a lower pulse density in the image and therefore to higher
statistical fluctuations (higher noise). In other words, resolution and sensitivity
they compete with each other - collimators with better
resolution have lower sensitivity and vice versa.
Imaging
properties of special collimators - convergent and Pinhole
Imaging properties - display scale, spatial resolution and
detection efficiency (as well as linearity) - of these special
collimators differ significantly from basic collimators with
parallel holes. Above all, collimators with parallel
holes projected the displayed radioactive structures
onto the detector crystal in an unchanged size - on a 1:1
scale, while special collimators provide an enlarged
or reduced display, depending on the distance of
the source from the collimator: just this
dependence of the magnification ratio - "optical
zoom" is the main reason for their use. Spatial
resolution it although does basically worsens with
distance, but at a different "pace" than with parallel
collimators. The detection efficiency
(sensitivity) of parallel collimators is practically independent
of distance, while that of special collimators increases or
decreases significantly with distance (as can be seen in Fig .4.5.6 on the right). We will give
an overview of the imaging properties of these collimators
according to Fig.4.5.7 :
Fig.4.5.7 Geometric arrangement of holes and imaging properties
of collimators: Parallel, Convergent and Pinhole.
Parallel collimator
Display scale: M = 1 -
projects an image without resizing on the camera detector,
display 1 : 1 .
Spatial resolution : Rcolim ~ d. (1 + h/L)
(formula (4.5.1) ) -
deteriorates with increasing distance from the collimator,
approximately linearly.
Detection efficiency (sensitivity) :
Scollim =
(d / L)2 .
[d2 / (d + s)2 ]. Kg . [100%] (formula (4.5.1)) is independent of the distance from the
collimator. The imaging properties of parallel collimators were
discussed in detail above at the beginning of this chapter "Physical
parameters of scintigraphy" in the
sections "Gamma camera resolution" and "Gamma camera detection efficiency".
Convergent collimator
Display scale: M = (f + L)/(f.h) - provides magnification of the
image depending on the distance h of the source from the
collimator.
Spatial resolution : Rcolim ~ [d . (L + h) / L] . (cos
q)-
1 . [1 - (L / 2) / (f + L)] deteriorates with
distance in a manner similar to a parallel collimator.
Detection efficiency (sensitivity)
: Scollim = (d / L)2
. [d2 / (d + s)2 ] . [f2 / (f -h)2] . Kg . [100%] . With a convergent
collimator, the detection efficiency increases with distance
from the collimator. Significant maximum - up to
30 times higher than at the front of the collimator! - reaches in
the focus (which is
usually at a distance of about 40-60 cm),
from where gamma radiation passes into the detector through all
the holes of the collimator; behind the focus, the
detection sensitivity decreases -
see the curve in the box in Fig.4.5.6 on the right. However, this area of long distances is not usable for
practical scintigraphy, as there is already poor spatial
resolution (and the structure of holes and
partitions can be disturbing, when is magnified projected on the
detector) .
Convergent collimators show an optimal
combination of resolution, efficiency and display scale at a
distance of about 15-20 cm, which corresponds well to the size
and depth of the heart. They were therefore often used in
nuclear cardiology - at ventriculography
and scintigraphy of myocardial perfusion (§4.9.4 "Nuclear
cardiology").
Note:
The opposite - divergent - hole configuration is in divergent
collimators (now no longer used), which provide image
reduction. A divergent collimator basically arises when
we turn the convergent collimator and "deploy it in the
opposite direction" on the camera detector.
Pinhole collimator
Display scale:
M = L / h - provides reduction
or enlargement of the image, according to the distance
h. The image is mirror- inverted.
For larger distances h > L the image is reduced,
for smaller distances h < L from the collimator the image is enlarged.
Spatial resolution: Rcollim = d . (L
+ h) /L is very good
at small distances (with a hole diameter d
= 2mm, at distances up to 10cm, a resolution of Rcollim approx. 3mm and
a total FHHM resolution of around 4-5mm is achieved). At greater distances, the resolution deteriorates, but
is still better than other collimators.
Detection efficiency (sensitivity)
: Scollim = (d / 16.h2 ). cos3 q . The detection
sensitivity of a gamma camera with a Pinhole collimator is
relatively high only in close proximity to the aperture (at 3 cm it is about 500 cps/MBq),
but it decreases sharply with distance. At greater
distances it is already very low (at
10 cm it is about 50 cps/MBq, at 20 cm only 10 cps/MBq), for practical scintigraphy it is completely insufficient
(perhaps only for monitoring high
therapeutic activities 131I) .
Due to these imaging properties, the
Pinhole collimator is suitable for scintigraphy of small
organs, especially the thyroid gland - see §4.9.1 "Thyrological radioisotope
diagnostics", where it provides an enlarged image with very good
resolution and sufficient detection efficiency.
Convergent and Pinhole collimators
show a certain inhomogeneity and nonlinearity of the
image- resolution and detection efficiency
differ somewhat at different points of view, even at the
same distance h from the collimator front. These
differences depend on the radial distance of the display
source from the axis of the collimator, which is expressed at a
trigonometric analysis of the angle q
between the collimator axis and the line connecting the source
and its image. Deviations in the values of resolution and
sensitivity are given by the cosine of the angle q. In
practical scintigraphy, while maintaining optimal configurations,
these deviations are not very significant...
Imaging
properties of the collimators with different geometric
arrangement of the holes are most clearly seen at images of
linear orthogonal grid (its
construction is described in "Phantoms and phantom
measurements in nuclear medicine" image "Grid") :
For a collimator with parallel
holes (such as LE HR left) we get a linear
imaging of the grid everywhwre, only for a greater distance from
the front of the collimator, the spatial resolution deteriorates
(blured grid). With a convergent collimator
(such as a SmartZoom with the convergent center part) the image
of the center part increases with increasing
distance. With the Fan Beam collimator (which is
convergent in the transverse direction, parallel in the axial
direction), the grating espands only in the transverse
direction with increasing distance, it remains the same
in the axial direction.
The most striking dependence on the
object distance exhibits the collimator Pinhole:
tightly close to the opening we get the image magnified
many times, with increasing distance the zoom decreases and for
distances above approx. 20cm the image is already reduced.
Of all the images is also seen a
general trend of deteriorating resolution (and thus
contrast in the image) with the distance from the front of the
collimator.
Homogeneity (uniformity) of
the camera's field of view
The scintigraphic image is created in the gamma camera in a very
complex way, the signals go through a number of precisely tuned
electronic and electro-optical components. However, the
individual links in this chain may show some changes, which may
cause deviations and defects in the images created.
Another important parameter of the
quality of scintigraphic imaging - homogeneity
(also called uniformity) indicates, whether
individual places in the field of view are imaged with the same
efficiency (sensitivity). By inhomogeneity
of the displayed field we mean local artificial changes
in accumulated number of pulses, caused by local
changes in the sensitivity and linearity of the image.
Inhomogeneity is usually caused by different sensitivity of
individual photomultipliers or their different spectrometric
settings, deviations in the adjustment of electronic circuits,
defects or inhomogeneities in the collimator or scintillation
crystal.
Field homogeneity characterizes the
camera's ability to provide an accurate (ie,
homogeneous) picture of a homogeneous
distribution of radioactivity. By irradiating the camera's field
of view with a homogeneous flux of photons of radiation g, we obtain an image
of a homogeneous source, which should also be completely
homogeneous (except for statistical
fluctuations). Possible inhomogeneities in
this image are seen visually, but they can also
be expressed quantitatively, mostly in
percentages :
| Homogeneity of the camera's field of view (integral) |
| The
homogeneity of the camera's field of view is the maximum
deviation of the actual image created in response to the
homogeneous irradiation of the camera detector, from the
ideally homogeneous image : H = 100[%] . (Nmax - Nmin ) / Nmean , where Nmax is the maximum, Nmin minimum and Nmean the average (mean) number of pulses accumulated in the pixels of the homogeneous source image. |
The overall homogeneity of the field of view
thus defined is referred to as integral homogeneity.
Since the human eye is more sensitive to differences in
the brightness of neighboring areas in the visual
assessment of images, the so-called differential
homogeneity may also be useful for evaluating the
homogeneity of the image. The following criterion was adopted for
its quantification :
Differential homogeneity
is the ratio of the largest difference in the
number of pulses in adjacent cells (row and
column) in the homogeneous source image, divided by the average
number of pulses in the image Hdif = max(Ni - Ni-1) / Nmean . To reduce the
effect of statistical fluctuations, the determined number of
pulses is averaged over 5
cells.
Whole and central field of view
It follows from the design of the scintillation camera, that the
quality of the scintigraphic image is usually best in the central
part of the field of view, while in the peripheral parts it may
be somewhat degraded. Therefore, homogeneity (and sometimes other camera parameters) is often determined separately for the entire
field of view (UFOV - useful field of view) and
separately for the central part of the field of
view (so-called CFOV - central field of view). 75% of the entire
field of view is usually taken as the central part. For quality
and correctly adjusted (calibrated, tuned) cameras, the integral homogeneity in the central field
should not be worse than about 3,5%, and in the whole field of
view up to 5%; differential inhomogeneity in the central field
should be in the range of 1.5 - 3%.
Similar to resolution, the
homogeneity of the scintillation camera is recognized by :
¨ The internal homogeneity
of the camera detector (intrinsic)
- is given by the homogeneity of the scintillation crystal and
its light response, light collection, sensitivity and adjustment
of individual photomultipliers. It is measured by homogeneous
irradiation of a crystal without a collimator.
¨ Overall homogeneity of
the camera ("external" - extrinsic)
- given the internal homogeneity of the camera detector +
homogeneity (or inhomogeneity, defects) of the used collimator. It is measured with a
collimator attached, a homogeneous flat source
is displayed, most often 57Co.
Visual field
inhomogeneity correction
The inhomogeneity of the field of
view of the camera can be reduced or eliminated in two steps :
1. Careful adjustment
- matching the individual photomultipliers to the same
detection efficiency (same photopeak position), so-called tuning.
In earlier analog cameras, this was done manually using potentiometers
in the preamplifiers of the individual photomultipliers, with
check on the oscilloscope screen. Current digital cameras have a computer
procedure, which for each photomultiplier uses ADC
<--> DAC converters to adjust the gain so that the top of
the photopeak of the radionuclide is exactly in the middle of the
set analyzer window.
2.
Computer correction
using a suitable matrix of correction coefficients
g ij to
correct the remaining inhomogeneous response of the detector -
Fig.4.5.8. The accumulated numbers of pulses A ij in the individual
elements (i, j) of the original uncorrected image are multiplied
by the correction coefficients g
ij from the correction matrix, thus
creating an image *A ij corrected for inhomogeneity :
*A
ij
= A ij . g ij .
 |
Fig.4.5.8. Computer correction of
gamma camera image inhomogeneity. Left: Image a ij of a homogeneous source, showing significant inhomogeneities. Middle: Matrix of correction coefficients g ij . Right: Multiplying by correction factors creates a corrected image *a ij that is already homogeneous. Note: Instead of the usual luminance modulation, an isometric display is used here, where the height of the elements (pixels) above the base is proportional to the number of pulses contained. The curves at the top are cross-sections, taken through the center of the images. |
The matrix of correction coefficients g ij is obtained from
the scanned image h ij of a homogeneous source (which we know should ideally be homogeneous -
constant) as its normalized inverse
matrix. The correction coefficients g
ij for individual elements (image cells - pixels) i, j are
calculated as the ratio of the average number [pulses/pixel] in the whole field
of view W to the number hij
[pulses/pixel] in a given image location
(i, j) of a homogeneous source :
g
i j
= ( i, j Î
W S h ij ) / (N. h ij
) ,
where N = WS i +WS j is the total number of
elements of the visual field image W. In places
(i, j) of the field of view with reduced detection efficiency,
the correction coefficients g ij are slightly higher than "1", in places of
higher efficiency they are slightly lower than "1".
The image of the homogeneous source
must be obtained under the same physical conditions *) as the
images that we want to correct with the resulting matrix. This
correction matrix g ij is stored in the memory of the acquisition computer and
its accumulated number then multiplies the
accumulated number of pulses at a given location of the field of
view during scanning (acquisition).
*) On what the homogeneity of the field of view
depends :
The homogeneity of the gamma
camera imaging depends (in addition to the
mechanical, detection, optical and electronic properties of the
device) also on a number of parameters and setting
conditions - on the width and symmetry of the analyzer window
setting, on the radiation energy, on the amount of scattered
radiation, on the frequency of the pulses, on the collimator
used. It can also change over time due to instabilities in the
detector and electronic circuits. If a sufficient number of
accumulated pulses in the image (information density) is not
achieved, statistical fluctuations may also appear as
inhomogeneity - the correction matrix must therefore be recorded
with the highest possible number of pulses, min. 10,000
imp./pixel. These important aspects of measuring and correcting
inhomogeneity are discussed and documented on experimental
scintigraphic images in the section "Testing and calibration of camera image
homogeneity", section
"Dependence of inhomogeneity on physical
conditions".
Scintigraphic
digital cameras have both of these operations 1.
and 2. covered by the procedure calibration homogeneity
and tuning of photomultiplier tubes.
Regular testing of the
homogeneity of the gamma camera imaging
Virtually all disturbances and anomalies in the imaging
properties of the gamma camera are most sensitive
manifest in homogeneity of the field of view. To ensure
high-quality scintigraphic imaging, it is therefore necessary to
perform regular homogeneity testing - and of
course also after each electronic intervention in the circuits of
photomultipliers, amplifiers and ADCs. In case of degraded
homogeneity, it is necessary to adjust or recalibrate the
photomultipliers (tuning), updating the correction matrix, in case of gross
abnormalities electronic intervention or repair. It is useful to archive
the results of homogeneity testing for a long time, or to plot
them graphically, for the analysis of the time trend
and to reveal the causes of possible deterioration of
homogeneity.
How homogeneity
measurements are performed using point and planar sources (and
recommended testing intervals) is described in the work "Phantoms
and phantom measurements in nuclear medicine", section
"Testing and calibration of camera
image homogeneity".
Linearity
of gamma camera imaging
Another parameter of scintigraphic image quality indicates
whether the spatial scales and proportions in the object are
displayed faithfully and without distortion -
linearly. It is therefore the ability of the camera to display
the distribution of radioactivity without positional distortion,
to display the line source as an exact line. Special phantoms are
used to assess (and possibly quantify) the linearity of the
scintigraphic image, in which a regular geometric
structure of the radioactivity distribution is realized.
It can be either a system of a larger number of regularly
quadrangularly distributed point sources, or a system of linear
(straight line) sources (so-called bar-phantom,
mostly transmission). The most perfect
phantom for the analysis of linearity of scintillation camera
imaging is the cartesian linear grid - it is described in the work "Phantoms and
phantom measurements in nuclear medicine", passage
"Analysis of linearity of gamma
camera imaging".
The scintigraphic image of such a
regular geometric structure should also show geometric
regularity. Possibly nonlinearity of
imaging wil be reflected in this image as distortion
and irregularities in the geometric arrangement.
We can monitor them either visually or evaluate them
quantitatively :
| Linearity of scintigraphic imaging (spatial) |
| The
linearity of the scintigraphic image is characterized by
the maximum deviation of the scintigraphic image of the
linear distribution of radioactivity from the exact
linear form : L [mm] = max (X - X lin ) , where X are the actual coordinates in the image and X lin are theoretical coordinate values corresponding to the exact linear course . |
Sometimes linearity is also expressed as a
percentage, ie L = 100[%] .max (X - X lin ) / Xlin. Linearity is analyzed in two "X"
and "Y" directions perpendicular to each other.
As with resolution and homogeneity, linearity is also given for
the whole and central field of view, or in addition to the total
(absolute) linearity, the differential linearity is also given.
The spatial linearity of the display should be better than about
4 mm for high-quality and correctly adjusted cameras.
Linearity <---> Homogeneity
The linearity of the image and the
homogeneity of the sensitivity of the field of view of the
scintillation camera are closely related.
Irregularities in the efficiency of registration of
scintillations from different places of the scintillation crystal
of the camera by a system of photomultipliers will be reflected
in the image as geometric nonlinearity and at
the same time as inhomogeneity in the density of
registered pulses. It can be said that under normal circumstances
the nonlinearity of the image is the main source of image
inhomogeneity. Deviations in the regular arrangement and size of
the holes and baffles in the collimator can also
contribute to the inhomogeneity of the scintigraphic imaging,
especially in the case of mechanical damage to the collimator.
In practical testing of the
properties (quality) of a scintillation camera, the linearity of
the image is rarely determined, as it is difficult and, in
addition, a small change in linearity (which would be difficult
to demonstrate in targeted linearity measurements) is
significantly more manifested in the inhomogeneity
of the field of view. The only case of visually
observable systematic nonlinearity is
scintigraphic images with convergent and Pinhole
collimators (§4.2, section "Scintigraphic
collimators").
Tomographic
resolution, homogeneity and linearity
For all the above parameters of the classical scintillation
camera, we had in mind the usual planar
scintigraphic imaging. The quality of the tomographic
image is basically described by the same physical
parameters as in the planar image. However, the planar parameters
of the SPECT *) scintillation camera detector cannot always be
transferred directly to tomographic images of transverse
sections, which arise from a complex reconstruction procedure
from many planar images at different angles. Although the
parameters of the camera detector are also decisive for the
quality of tomographic images, some other physical and technical
aspects also cooperate here.
*) Of course, there is no planar image for
the PET camera, all parameters are measured in tomographic mode,
on images of transverse sections - see §4.3, section "Spatial
resolution of PET".
The spatial resolution of the camera
in the planar image is also decisively reflected in the
tomographic image. The radial tomographic resolution
in the transverse section image is approximately (1.1-1.3) times
the total resolution of the camera, but it can be possibly
aggravated by mechanical shifts of the center of rotation during
the acquisition of SPECT examination. The resolution in the axial
direction is given directly by the resolution of the camera with
the collimator used (at a given distance of the displayed
structure from the front of the collimator).
Possible local defect in
the homogeneity of the camera, it is projected as an annular
artifact in the rotation of the camera in the
cross-sectional image. The inhomogeneity in the cross-sectional
image can then also be caused by the absorption of g radiation
(attenuation) depending on the depth of deposition of the
respective radioactivity distribution in the tissue.
Tomographic resolution and homogeneity are
measured or evaluated (mostly visually) using special aids - phantoms,
most often cylindrical in shape, containing tubes (line sources),
various rollers and balls of various sizes, as well as free space
for homogeneous distribution of the radio indicator. The most
commonly used is Jasczak 's phantom. The phantom is
filled with a radionuclide solution (usually 99mTc or 18F), its SPECT or PET
scintigraphy is performed and the resolution and homogeneity are
evaluated on the reconstructed images of transverse sections in
the appropriate places in a manner analogous to the planar
images. Tomographic phantoms are described in the work "Phantoms
and phantom measurements in nuclear medicine", section "Tomographic phantoms".
Energy resolution and dead time of
the camera detector
In addition to the above basic parameters - spatial resolution,
homogeneity and linearity of images, which have a primary effect
on scintigraphic image quality, for the scintillation camera are
also assesed detection parameters, describing
its properties in terms of scintillation detection and radiation
gamma spectrometry. Although these parameters are secondary and
auxiliary, they can indirectly affect the quality of the display.
Their adverse changes may also indicate a malfunction of the
scintillation camera.
The energy resolution
of a scintillation camera not only allows the separation of
different lines of gamma radiation (eg when
simultaneously imaging two isotopes), but
mainly determines the ability of the camera detector to separate
Compton - scattered radiation g from direct non - scattered
radiation (discussed above in the section
"Spatial
resolution of the gamma camera",
passage "Compton - scattered radiation" , Fig.4.5.4).
With the correct adjustment of photomultipliers, the total energy
resolution of classic gamma cameras (Anger
type) is about 9-12% (for
new semiconductor CZT cameras it is about 5%).
Dead time
(sometimes called time resolution) is the time
for which the detector processes the signal from the arrival of
one detected quantum of radiation and is not able to register any
other quantum. In scintigraphy, it can manifest itself to sources
with high activity, ie with a high flux of
photons of radiation g - at a frequency of many tens of thousands of registered
photons per second. The dead time of the camera leads to a violation
of the linearity of the dependence between the activity
in the source and the registered frequency of pulses in the
image, which may distort the results of the analysis of the
dynamics of the investigated processes. For quantitative dynamic
studies, especially radiocardiographic studies, the need for a correction
for dead time may arise. The important thing here is overall
dead time of the whole system camera + computer. For older types
of cameras, the total dead time was about 5 ms, for newer cameras it is
already reduced to about 1 ms. Overloading the gamma camera with high radiation
intensity also leads to deterioration of imaging
properties - resolution, homogeneity, image contrast.
All registered photons of all energies contribute to the dead
time, ie not only the corresponding photo peak in the analyzer
window, but also Compton scattered radiation.
Note:
For details on the paralyzable
(cumulative) and non-paralizable nature of dead time, as
well as methods for its measurement and correction
for dead time, we can refer to Chapter 2, passage "Dead
time of detectors".
Energy resolution and dead time are
measured by the spectrometric methods described
in Chapter 2 "Detection and spectrometry of ionizing
radiation", in particular in §2.4
"Scintillation detectors".
The issue of measuring the
imaging properties of gamma cameras and the practical
implementation of testing is discussed in a separate work
" Phantoms and phantom
measurements in nuclear medicine ".
4.6.
Relationship between scintigraphy and other imaging methods
Scintigraphy is just one of several other imaging
diagnostic methods used in medicine. Each of these
methods has its uses, its advantages and disadvantages. In
principle, diagnostic imaging methods can be divided into two
groups :
¨ Anatomical-morphological
,
which show mainly the size and structure of tissues and organs.
However, anatomical imaging lacks a functional aspect - it does
not allow to recognize the biological nature of the displayed
pathological structure.
¨ Functional-metabolic
,
which map blood circulation, metabolism, drainage, accumulation
and other organ functions. However, functional imaging usually
does not allow the exact localization of a pathological event or
lesion in the organism - missing here the "background"
of other structures, that are not displayed (because they do not
have the appropriate "function"). In addition,
functional imaging generally has a lower position resolution than
anatomical imaging.
To make a correct diagnosis, it is
necessary to assess both anatonic-morphological and functional
and metabolic symptoms of the disease. Only the combination of
both mentioned images will make it possible to recognize the
biological character of the depicted deposit and its exact
location.
To clarify the position and role of scintigraphy in
the spectrum of other diagnostic methods, we will briefly compare
the principles and diagnostic
capabilities of the most important imaging methods.
X-ray
imaging
The oldest and most frequently used imaging method so far is X-ray
imaging (see §3.2 "X-ray diagnostics"),
whether it is planar or tomographic CT imaging. The penetrating
X-rays generated in X-ray tube pass through the examined object
(organism tissue), while part of the radiation is absorbed
depending on the tissue density, while the
remaining part passes through the tissue and is displayed
either photographically or on a luminescent screen, or more
recently by electronic detectors. This creates an X-ray
image of the examined tissue, which is a shadow
density image showing differences in tissue density.
In certain cases, the contrast of the image can be artificially
increased by applying suitable contrast agents.
In addition, tomographic X-ray CT imaging provides images of transverse
sections with high resolution
(approximately 1 mm), from which a three-dimensional image of the
examined area can be composed.
Ultrasonic sonography
Ultrasound is a mechanical (acoustic) wave of a
substance (air, liquids, solids) with a frequency higher than the
sound audible to the human ear, ie higher than 20 kHz. In matter,
a wave propagates by oscillating its particles around an
equilibrium position. In gases and liquids it propagates as longitudinal
waves, in solids it can also have the character of transverse
waves. In medical diagnostics, ultrasound with a frequency of
1-15 MHz is usually used. At higher frequencies, better spatial
resolution can be achieved (due to the shorter wavelength), but
more ultrasound is absorbed in the tissue.
Ultrasound sonography or ultrasonography
is based on the propagation of sound waves of
high frequency (several MHz), ie ultrasound, in
the elastic environment of tissues and its reflections on
inhomogeneities. The speed v the propagation of a
wave in an elastic medium is given by the relation v = Ö(M/r), where M
is the elasticity (Young's modulus of
elasticity) of the medium and r
its density (specific
gravity). When an ultrasonic wave strikes an area with different density
or elasticity - the acoustic interface,
there are changes in the speed of propagation, refraction and
reflection of the wave (related to the
well-known Huygens principle). The
reflected ultrasonic waves carry information about the presence
of structures of different density and elasticity. Ultrasound
sonography creates an image of these structures in the examined
tissue by echolocation *) of reflected
ultrasound waves. The reflected signals - acoustic echoes
- correspond in their time sequence to the spatial distribution
of reflecting structures in the investigated environment.
*) Echolocation
is a way of obtaining information at a distance, where a sound
is transmitted to the monitored environment,
which is partially reflected from a possible
object back to the place of transmission and is captured and
evaluated there. From the time delay which
elapses from the moment of sound transmission to the moment of
receivivg the reflected wave (echo), the distance
of the reflecting object can be determined. In nature, this
principle is used by dolphins and bats for orientation and
searching for food. In marine technology, so-called sonar
is used, among other things to measure the depth of the sea. A radar
works on a similar principle of radiolocation, which
uses electromagnetic waves instead of sound - radio waves.
Transmitting piezoelectric crystal
of the probe, pressed into mechanical contact with the body
surface (good passage of waves into the
skin is ensured by a layer of special gel),
is periodically deformed by the action of an alternating electric
voltage applied to its opposite electrodes, and this mechanical
disturbance (vibration) emits an acoustic wave into the tissue.
In water and tissue, sound waves propagate at an average speed of
1550 m/s. As ultrasound passes through the substance, it is
absorbed, scattered, bent, and partially reflected back.
Reflection occurs at the interface of tissues
with different densities and elasticities, in which ultrasound
propagates at different speeds - ie tissues with
different acoustic impedances *). The reflected
ultrasonic waves return and cause vibrations of the piezoelectric
crystal (transducer) in the receiving part of the ultrasonic
probe, which generates an alternating electrical signal of
appropriate frequency, amplitude and time delay at the crystal
electrodes, which is further electronically processed.
*) The so-called specific acoustic
impedance is important for the propagation of ultrasound
in tissue, which is the product of tissue density and ultrasound
speed: Z = r .v = Ö(M. r). It gives the specific "wave resistance" in
the propagation of ultrasound in analogy to Ohm's law of
electricity. The acoustic impedance Z defined in this way
is somewhat analogous to the reactance in electronics
(capacitive or inductive). Viscosity the environment
leading to the absorption and attenuation of ultrasound is
analogous to the active ohmic resistance. The greater
the difference in acoustic impedances, the greater the intensity
of the reflections - echogenicity.
The probe attached to the body
surface transmits short (millisecond) ultrasound
signals at fast regular intervals, the electronic receiving
probe records the reflected signal ("echo")
and the electronic apparatus evaluates the time and position differences
of the transmitted and reflected signal and creates an image
of structures on the screen according to their density
and elasticity (so-called echogenicity
or acoustic impedance). Ultrasound
images of echogenicity are displayed on most probes primarily in
the form of a circular segment in polar coordinates
(r, j)
centered at the point of attachment of the receiving probe. The
radial coordinate r - the depth in the tissue
- is derived from the time delay Dt between the
transmitted ultrasound signal and the reception of its
reflection: r [mm] =
1.55 . Dt [ms] (at
the average speed of ultrasound in the tissue approx. 1550 m/s).
Angle j it
is determined for simple devices with one receiving crystal by
rocking turning of the probe (manual or motorized), for probes
with more directional receiving crystals it is determined
electronically. The brightness of the individual
points of the sonographic image is modulated by the intensity
of the received reflected ultrasound signal (this
intensity should be corrected for the depth absorption of the
ultrasound, see below), ie the echogenicity
*) of the corresponding sites in the tissue. The sonographic
image thus captures the spatial distribution of
structures with different densities and elasticities in
the examined tissue.
*) Formations that reflect
ultrasound more or less than the surrounding tissue are called hypoechogenic
or hyperechogenic. Higher or lower echogenicity
is not in itself a "diagnosis", but it is an important
feature by which the character of the examined area of tissue can
be determined.
Some technically advanced systems
have a computer transformation of the image into the usual Cartesian
coordinates, providing a more illustrative presentation.
The rectangular view is provided by probes with a linear
arrangement of a plurality of receiving elements.
The signal coming from a greater depth is significantly attenuated
by absorption in the tissue *) (double attenuation -
transmitted and reflected signal), so for objective display, a correction
of intensity for attenuation is performed, either time (longer
signal reception time from greater depth) or computer.
*) For absorption of
ultrasound in the environment occurs by the fact that due to the
internal friction of the oscillating particles, part of the
mechanical energy of the waves changes into heat. The rate of
absorption of ultrasonic waves is determined by the exponential
law I(d) = I0 .e - m .d , wherein I0 is the original (initial) intensity, I(d) the intensity
at depth d , m coefficient of absorption. The
absorption coefficient m depends on the type of substance (its
viscosity) and on the frequency. In most
substances, the attenuation by absorption is directly
proportional to the square of the frequency.
The great
advantage of ultrasonography is the simplicity
of its implementation, non-invasiveness and
unpretentiousness for patients. The method is completely safe and
harmless (ultrasound intensity reaches a maximum
of 1 mW/m2),
it does not burden the body with ionizing radiation. Therefore,
in diseases related to morphological and anatomical changes,
ultrasound examination is usually included at the beginning
of the diagnostic chain. Ultrasonography is also widely
used to evaluate the course of gravidity.
Doppler
ultrasonography
Modern sonographic instruments also allow the analysis of
the frequency of the received ultrasound signal:
the frequency of the signal reflected from a moving
object is slightly increased or decreased due to the Doppler
effect *), depending on whether the object is moving
toward or away from the receiver. The Doppler frequency shift of
the reflected ultrasound can be then used to modulate
a common echogenic anatomical image (color modulation is used)
and thus obtain a velocity map of the movement
of structures and fluid flow in the examined object. With the
help of this so-called Doppler ultrasonography,
it is possible in cardiological diagnostics (Doppler
echocardiography) to detect, for example, movements of heart
walls and valves, or jets of blood from under the heart valve
during regurgitation. It is also possible to monitor the speed
of blood flow in the venous system.
*) Doppler effect :
If the wave source moves of a certain constant frequency fo towards the observer
(receiver), this observer registers a higher frequency f
than the source actually emits. Conversely, when the source moves
away from the observer, the registered frequency is lower than
the actual one. The difference between the actual fo and the observed f
frequency (Doppler frequency shift) increases in proportion to
the velocity V of the source relative to the observer: f =
[1 + (V/v)] . fo , where v is the speed of propagation of a given
wave. This rule also applies when the source of the received wave
is the reflection of the wave from a certain
moving object (including a flowing liquid). By measuring the frequency
difference of the primary transmitted wave and the
reflected wave ("echo") we can thus determine the speed
of movement of the reflecting object.
Nuclear
magnetic resonance -
analytical and imaging method
Nuclear magnetic resonance (NMR)
is a very complex physical-electronic method, based on the
behavior of magnetic moments of atomic nuclei
under the action of an alternating radio frequency signal in a
strong permanent magnetic field. This originally analytical
method was later improved and developed as an important imaging
method .
Note: We have
included nuclear magnetic resonance among nuclear and radiation
methods, even though it does not contain any ionizing radiation.
However, it is a method based on the findings of nuclear
physics - the properties of atomic nuclei. A physical
phenomenon called nuclear magnetic resonance - NMR,
was investigated in the 1940s (F. Bloch,
E.M.Purcell) and was initially used in
chemistry as sample NMR spectrometry . In the
1970s and 1980s, NMR imaging methods also began
to develop (pioneers were P.Lauterbuer,
P.Manfield, A.Maudsley, R.Damadian, 1977) -
see below.
We will try to briefly outline
the principles and methodology of NMR. However, due to the
considerable principal and technical complexity of NMR
(only scintigraphy can partially compete with it), we must
observe the maximum brevity ...
Physical
principle of NMR
Phenomenon of nuclear magnetic resonance it can
generally occur during the interactions of atomic nuclei with an
external electromagnetic field. Each nucleon (proton and neutron)
has its own "mechanical" angular momentum - spin
(nucleons belong to fermions with spin 1/2, see §1.5 "Elementary
particles"). According to the laws
of electrodynamics, this rotational angular momentum of nucleons
creates - induces - its own elementary magnetic
moment mp
= 1.41.10-27 J / T, equal to 2.79
times the so-called Bohr nuclear magneton *) - it is discussed in more detail in §1.1, passage
"Quantum momentum, spin, magnetic
moment", paragraph " Magnetic moment ". Due to the spins of their
nucleons, atomic nuclei therefore generate a very weak magnetic
field - they have a certain magnetic moment m . However, only
atomic nuclei with an odd nucleon number have spin and magnetic
moment, because the spins and magnetic moments of paired protons
and neutrons cancel each other out - they are zero. The magnetic
moment of the nucleus is formed by an unpaired nucleon - a proton
or neutron. Magnetic resonance imaging can therefore be observed
only in nuclei with odd nucleon numbers -
especially hydrogen 1H, then in 13C, 15N, 19F, 23Na, 31P, etc.
*) Nuclear magneton mN is a
physical constant expressing the proton's own
dipole magnetic moment induced by its spin: m N = e.h
/2mp
, where e is the elementary electric charge (proton,
electron), h is the reduced Planck's
constant, mp is the rest mass of the proton. In the
system of SI units, its value is approximately mN = 5.05.10-27
J /T. It is analogous to the Bohr
electron magneton me = e.h / 2m e, which, however, is 1836 times larger,
in the ratio of the mass of the proton and the electron. It is
interesting that even a neutron, although electrically uncharged,
has a non-zero magnetic moment mn = -0.966.10-27
J /T somewhat smaller and of the opposite sign
than a proton. It turns out that the magnetic moment of nucleons
has its origin in their quark structure (§1.5., part "Quark
structure of hadrons" and
§1.1, passage "Magnetic
moment").
Magnetic
moments of nuclei in a magnetic field
Under normal circumstances, due to the thermal motion of atoms,
the directions of spins and magnetic moments of individual nuclei
are chaotically "scattered", their orientation is
random and disordered (Fig.3.4.4a), elementary magnetic fields
cancel each other out on average, on a macroscopic scale the
substance shows no magnetic properties (we
do not mean ferromagnetic substances, where it is the effect of
electrons in atomic shells) . However, if
we place the analyzed substance in a strong magnetic
field (of intensity or induction B of
the order of several Tesla), the magnetic moments of the nuclei
are oriented in the direction of the vector B of
this external magnetic field (at least
partially).- the magnetic moment of the
nuclei is parallel to the magnetic field lines (Fig.3.4.4b). The
stronger the magnetic field, the more perfect this arrangement
*). Outwardly, this results in non-zero magnetization
vector M in the direction of the external magnetic field
induction B. The magnitude of the magnetization
vector is proportional to the strength of the external magnetic
field B and the percentage of concordantly
oriented mag. moments of nuclei in matter. A sufficiently strong
magnetic field B is now mostly realized by means
of a superconducting electromagnet, the winding
of which must be permanently cooled by liquid helium (physical principles of superconducting magnets are
briefly discussed in §1.5, section "Electromagnets in accelerators", passage "Superconducting
electromagnets").
*) However, the extent of this
arrangement is actually very small ! In commonly
used magnetic fields 1-3T, for every 1 million hydrogen nuclei,
only about 7-20 nuclei are on average in a state of uniform
orientation. The vast majority of nuclei are as a result of
thermal motion, it is oriented in different directions, including
the opposite one (this is expressed by Boltzmann's law of
distribution.) In this sense, it is necessary to take Fig.3.4.4b
only as a symbolic scheme, which shows only those few nuclei that
acquire concordant orientations.
Since
conventional material, e.g. water or tissue, contains about 1022
hydrogen nuclei per 1 gram, even a small excess of oriented
nuclei provides a measurable magnitude of the magnetization
vector and the radio frequency response signal.
Larmor
frequency, radiofrequency excitation and relaxation
In the magnetic field B, the nuclei (with a
non-zero magnetic moment m) behave as magnetic dipoles, which are acted upon by a
pair of forces m.B . This will cause the core to rotate
the axis of its magnetic moment around the direction B
- it will perform a precessional movement (similar to the precessional movement of a gyroscope or
children's "spinning top" around the vertical direction
in the gravity field) by the so-called Larmor
frequency
wL = g . B , or fL
= g .B /2p ,
where g is the gyromagnetic ratio of the nucleus, which
is the ratio of the magnetic moment of the nucleus and its
"mechanical" moment of inertia [ rad
· s -1 · T -1] .
The precession movement occurs when the external magnetic field
changes or the angle of the magnetic moment in this field changes
and lasts as long as the mag. the moment does not stabilize in
the rest position.
If we send a
short alternating electromagnetic signal into
such a magnetically polarized substance by means of another coil
(high-frequency - HF, or radio-frequency - RF) (whose frequency resonates with the above-mentioned Larmor
precession fL
of a given type of nucleus in a
magnetic field), the direction of the
magnetic moment of the nucleus temporarily deviates
from the direction determined by the vector B of
the external magnetic field (Fig.3.4.4c) *). The deflection of
the magnetization vector is caused by the magnetic component of
the excitation RF pulse. The angle of this deflection is
proportional to the amplitude (energy) of the RF pulse and its
duration. The most commonly used RF pulses are 90° or 180°.
*) Fulfillment of
the resonance condition: The nuclei are
able to efficiently receive energy from an alternating
electromagnetic field only if the Larmor frequency of the nucleus
precession and the frequency of the electromagnetic pulse are the
same. The preceding nuclei thus resonate with an
electromagnetic pulse at a given Larmor frequency - hence the
name "magnetic resonance".
After the unwinding of the
excitation, signal occurs relaxation (at a constant rotation Larmor frequency) at which they emit electromagnetic waves
with decreasing intensity until the magnetic moment of the spiral
return back again in the direction B. These
electromag. waves will induce alternating voltage in the receiving
coils - "echo" radiofrequency
signal **). This relaxation signal (sometimes
referred acronym FID - Free Induction Decay) , has a sinusoidal course with exponentially decreasing
amplitude (see below Relaxation times). It is a useful signal that carries information about
the inner structure of the analyte. Frequency of
this signal is equal to the above-mentioned Larmor precession and
for a given force B of the external magnetic
field is determined by the gyromagnetic ratio g of the nucleus, ie the type of nucleus,
the amplitude of the relaxation signal is
proportional to the concentration of nuclei of
the given species- thus nuclear magnetic resonance can be
used to analyze of the composition of
substances : what elements and in a what concentration
are contained in the sample. E.g. for hydrogen nuclei (protons)
the gyromagnetic constant has the value g = 2.675.10-8 s-1 T-1 and in the magnetic
field of induction 1Tesla Larmor's NM the resonant frequency is
42.574MHz, at 1.5T it is 63.58MHz - the area of radio
waves (short waves) . For heavier nuclei is proportionally lower .
**) Phasing of a
large number of nuclei : The NMR receiving coils
are, of course, not able to detect the relaxation radiation of
one or a few nuclei. To obtain a measurable signal, deexcitation
of a large number of nuclei (> about 1012 ) is required,
namely synchronously and at the same phase ! If
phasing disruption occurs, the MNR signal drops sharply or
disappears (cf. below "Relaxation times - T2").
General note:
Quantum behavior: For the sake of clarity, we have not
yet explicitly included the quantum behavior of
the magnetic moment, we considered its continuous
behavior. The orientation of the magnetic moment vector of nuclei
in a magnetic field actually acquires discrete quantum
states - parallel (0°), perpendicular (90°) and
antiparallel (opposite, 180°) with the direction of the vector B magnetic
induction of an external magnetic field. The basic, energetically
lowest state is parallel, while the perpendicular or antiparallel
configuration has a higher energy- excited state. From
the fundamental to the excited state of the magnetic moment, the
nuclei pass by absorbing a quantum of
electromagnetic energy, which must be exactly equal to the
difference in energy between the two states. The respective
frequency corresponds to the resonant Larmor frequency.
During deexcitation, an electromagnetic signal of the same
frequency is then emitted . The precession
rotation of the magnetic moment of nuclei in a magnetic field is
again just our model idea of how to clearly explain the behavior
of nuclei in a magnetic field ...
Fig. 3.4.4. Nuclear magnetic resonance -
simplified schematic representation.
a) The magnetic moments of the nuclei in the analyte
normally have chaotically scattered directions.
b) By the action of a strong magnetic field B,
the mag. moments of nuclei partially orient in the direction of
the vector B .
c) By sending a RF electromagnetic field, these oriented
nuclei deviate from the B direction, eg by 90°.
After switching off this RF field, a relaxation occurs, during
which the deflected nuclei when its return at precession rotation
will emit an electromagneic NMR signal with exponentially
decaying amplitude.
d) Simplified schematic diagram of NMR imaging
equipment. For simplicity, only one radio frequency (RF) coil is
drawn, which electronically switches alternately to transmit and
receive modes; usually there are separate transmitting and
receiving RF coils. (ADC =
analog-to-digital converter, DAC = digital-to-analog converter) .
Radio
frequency coils
RF coils are a kind of "antennas"
of the NMR system, that transmit excitation RF
signals towards the analyte, or receive response
RF signals from the relaxing nuclei in the analyte. In principle,
the same coil can be used as the transmitting and receiving coil,
which is electronically switched to the transmitting and then to
the receiving mode (as symbolically drawn
in the diagram in Fig.3.4.4d). However,
better detection of the response NMR signal can be achieved by
using a separate receiving RF coil. Due to the relatively high
Larmor frequency (tens of MHz), RF coils have a very simple
design: they are formed by a loop of wire of circular or
rectangular shape, which is placed close to the analyzed material
(sample or area of interest in the organism). Sometimes they are
suitably shaped (bent into a saddle or
cylindrical shape) to achieve better
homogeneity of the RF signal in the analyzed area.
A short but very strong radio
frequency alternating current, of high amplitude,
is introduced into the transmitting coil in
various time sequences, instantaneous power up to tens of kW. In
the receiving coil, a response signal is then induced from the
relaxing nuclei, on the contrary, with a very low
amplitude (of the order of millivolts), which for
further electronic processing must be significantly amplified
in a narrowband high-frequency amplifier. For NMRI imaging (see
below), special RF receiving coils of various sizes and shapes
are used to tightly encircle the analyzed area - for imaging the
brain, joints, spine, etc.
NMR
spectroscopy and analysis
NMR spectroscopy is performed in such a way, that the
frequency of the excitation RF signal gradually increases, this
signal intermittently supplies the coils in the transmitting
mode, there is always a switch to the receiving mode and the
intensity of the RF signal is measured - echo -
transmitted by a sample placed in the magnetic field Bo during the back
relaxation of the magnetic moments of the nuclei. The frequency
at which the resonant maximum occurs, the Larmor frequency,
determines the type of nucleus (the highest is
for hydrogen - 42.6 MHz for B = 1Tesla), the intensity
of the resonant maximum determines the concentration
of the relevant atoms in the sample. All nuclei of one isotope,
inserted into the same magnetic field, should resonate at the
same frequency by themselves. However, if the atoms of these
nuclei are part of chemical compounds, the
distribution of electrons in their environment differs and these
electrons cause electromagnetic shielding of the nuclei.
The effective magnetic field acting on the nucleus is then no
longer Bo, but B = Bo . (1- s), where the
shielding factor s , describing the shielding intensity, slightly depends
on the chemical composition of the analyte. This change in the
effective magnetic field causes a so-called chemical
frequency shift in the NMR signal spectrum .
Another effect affecting the
fine structure of the NMR spectrum is the mutual interaction of
the nuclei of neighboring atoms mediated by valence electrons. As
a result of these interactions, the splitting of the resonant
maxima of the studied nuclei is observed into 2-4 lines at a
distance of about 20 Hz - there is a multiplicity of
signal .
Detailed analysis of
frequencies, intensities and multiplicities in the NMR spectrum
can therefore provide information on the chemical
composition and structure of organic
and inorganic substances. Modern NMR spectrometers are computer
controlled, and the induced NMR signal is analyzed using a Fourier
transform .
Relaxation
times
After switching off the high-frequency excitation field, the
deflected nuclei relax in the magnetic field -
they return in a spiral path to the original equilibrium state in
the direction Bo (which we refer to here as the "z" axis),
which is observed in the receiving coil as a free reverberation
of the induced RF signal with an exponential decrease in
amplitude. The rate of this relaxation (or fading time) is
influenced by the interaction of nuclear spins with surrounding
atoms and the mutual interaction between nuclear spins. The NMR
signal also encodes information about the surrounding atoms and
molecules - information about the chemical composition
and structure of the substance. The decay time
of the resonant signal is characterized by two relaxation
times T1 and T2 .
Relaxation time T1 , sometimes
called spin-lattice (the name
comes from the original use of NMR for the analysis of solids
with a crystal lattice) , represents the
basic time constant of relaxation of magnetic
moments of nuclei from the deflected position to the equilibrium
position in the direction of the permanent magnetic field. It
captures the speed at which the deflected core releases energy to
electromagnetic waves and the environment during relaxation,
while the longitudinal magnetization in the z-axis direction
returns to the original value of Mo
according to the exponential law: MZ = Mo.(1 - e -t / T1) . It is defined as
the time, during which the longitudinal magnetization at
relaxation reaches (1-e)- times the original value Mo, whereby the signal
drops to 63% (if the excitation of the magnetic moment of the
core by 90° was performed).
The relaxation time T2 , sometimes
called spin-spin, expresses the time constant with
which, due to the mutual interaction of spins and magnetic
moments of adjacent nuclei, leading to the dephasing of the
precessional motion of magnetic moments, the magnetization
decreases in the transverse direction x-y: M XY = Mo
XY e - t / T 2 . T2 is defined as the time during
which the transverse magnetization MXY decreases e-times.
Note:
The receiving coil in the MRI actually detects a shorter
relaxation time marked T2* after the excitation
pulse has ended. In addition to the relaxation time T2, it is
caused by a steeper decrease in the transverse component of the
material magnetization due to small changes in the inhomogeneity
of the magnetic field, leading to desynchronization. In MRI
imaging, this phenomenon is usually negative, it can be corrected
or eliminated in the so-called "spin-echo
sequence" - see below.
The
relaxation times T1 and
T2 are the result of
the interaction of resonant nuclei with their surroundings and
characterize the chemical properties and structure of the
investigated material. In medical use, they are often
significantly different for healthy and tumor tissue.
In the most commonly used external
magnetic field of 1.5 T, the relaxation times T1 and T2 of water and some human tissues (in the physiological
state) have the following approximate values :
| Tissue type: | water | oxygenated blood | non-oxygenated blood | fat | muscles | proteins | gray matter brain | white matter brain | liver | kidneys |
| T 1 [ms] | 4300 | 1350 | 1350 | 250 | 880 | 250 | 920 | 780 | 490 | 650 |
| T 2 [ms] | 2200 | 200 | 50 | 70 | 50 | <= 1 | 100 | 90 | 40 | 70 |
Relaxation times are
characteristic of different substances and tissues - they depend
on the concentration of nuclei, temperature, size of molecules,
chemical bonds. It can be seen from the table that, for example,
hydrogen nuclei tightly bound in fat or protein molecules relax
much faster than protons weakly bound in water molecules.
NMR
imaging - MRI
The NMR method originally served as an analytical method
for the composition and structure of samples. Advances in
electronics and computer technology in the 1970s and 1980s made
it possible to use the NMR signal to create an image of
proton density in an object under investigation. This
created the NMR imaging method (NMRI - Nuclear
Magnetic Resonance Imaging; the word "nuclear" is often
omitted and the abbreviation MRI is used) -
Fig.3.4.4d.
In order to be able to detect
NMR signals separately and locally from
individual places of the examined object (organism or tissue) and
use it to create an image , it is necessary to
ensure spatial-geometric coding of coordinates
in the examined object. This can be achieved by superimposing an
additional gradient magnetic field in the
direction of the X, Y, Z axis on the main constant homogeneous
field Bo. These gradient magnetic fields in the direction of
each X, Y, Z axis are generated by a respective pair of gradient
coils. By changing the gradient magnetic field, we
achieve that the magnetic resonance will always occur in a different
place of the examined object. By this gradient magnetic
coding of spatial coordinates we can then perform NMR imaging.
Gradient coils
are "additional" electromagnets located in suitable
places inside the main strong electromagnet. They are wound with
copper wire or metal tape, dimensioned for relatively high
currents of tens or hundreds of amperes. Gradient coils are
supplied in pulse sequences with a relatively strong current
(approx. 500A) from electronically controlled sources, which
allow fast and accurate setting of the strength and direction of
the excited magnetic field - an additional gradient field. They
produce gradients in the range of about 20-100 mT /m. In order
for MRI imaging not to take an enormously long time, the rate of
gradient changes needs to be relatively high - it reaches about
100-200 Tm-1 .s-1; it requires a certain
voltage (approx. 50-300V) to overcome the inductance of the
gradient coils - the power supplies of the gradient coils are
relatively robust (power). Strong current surges in the gradient
coils when interacting with the magnetic field cause mechanical
vibrations, which causes considerable noise
during MRI. Longitudinal gradient coils (in the Z
direction ) have turns wound in the same direction as the main
coil, X (gradient in the left-right direction) and Y
(gradient in the up-down direction) are formed by saddle-shaped
coils with vertically wound turns.
Note
first the longitudinal gradient field Bz(z) in the Z
direction. His superposition with the main mag. field Bo causes the actual
"local" value of the magnetic field B
= Bo + Bz(z) to depend on the z coordinate : B
= B(z). If we send a high-frequency pulse of a
certain frequency f to a sample placed in this slightly
inhomogeneous gradient magnetic field, the magnetic resonance
signal will be transmitted by atomic nuclei only from a thin
layer of the sample with coordinate z , for which
the resonance condition f = g .B(z) /2p is satisfied. By varying the frequency f of
high-frequency excitation pulses, or the intensity of the
longitudinal gradient field Bz, is changes the
position of the layer, in which the magnetic resonance response
signal is generated. In this way, information about the
dependence of the spatial distribution of the density of the
nuclei in the direction of the Z axis is captured - the
electronic-geometric coding of this coordinate is achieved - the
layer z .
The representation of the spatial distribution of the
density of nuclei in a given layer z in the transverse
directions X and Y is then obtained by the action
of another, transverse, gradient magnetic field in the direction
of the X and Y axis, whereby the investigated layer decomposes
into elementary volumes - "pixels", in
which is determined intensity of the relaxation NMR signal, and
also its decay times. By changing these gradient fields, data are
obtained for individual sites in the z layer and their
computer reconstruction yields a cross-section image
of the proton density in the examined layer z
(Fig.3.4.4d right). By electronic analysis of relaxation times of
the NMR signal is also generated cross-sectional images in the
relaxation times T1 and
T2 (referred to as T1 or T2 - weighted images). The set of cross-sectional
images for different values of the z-coordinate then creates a 3-dimensional
tomographic image of the investigated
area in proton density and relaxation times in individual "voxels".
Using computer graphics, it is then possible to create images of
any sections of the examined area, which are brightly modulated
in a wide range of shades of gray (from white to black), to
distinguish the structure of tissues and organs.
The basic subject of NMRI
imaging is hydrogen nuclei - imaging of proton
density and relaxation times. This is why NMRI is sometimes
referred to as "hydrogen topographic imaging".
The intensity of such an NMR image mainly reflects the amount of water
at each locationin the examined tissue and the nature of the
binding and distribution of hydrogen molecules in the cells and
extracellular space, as well as the distribution of fat and
proteins. Based on these structural differences, different
tissues can be distinguished from each
other in MRI images - such as water, muscle, fat, gray matter and
white matter in the brain.
In general, two basic
information is captured locally in NMRI images :
1. Density distribution of nuclei
producing nuclear magnetic resonance - most often the proton
density PD of hydrogen in the tissue. PD images
essentially capture the anatomical structure of
tissues and organs, and are largely similar to CT X-rays, which
map the electron density of tissues.
2. Distribution of relaxation times
T1 and T2 related to the chemical
composition and structural state of the
tissue in individual places. Such images are called T1 and T2 - weighted
.
About to what extent to which
the proton density PD and the times T1 and T2 will
be represented in the resulting MRI image, - how and with what
this image will be modulated - "weighted"
- is determined by pulse sequences: time
sequence of transmitted RF pulses and "echo" response
signals (will be discussed in more detail
below) .
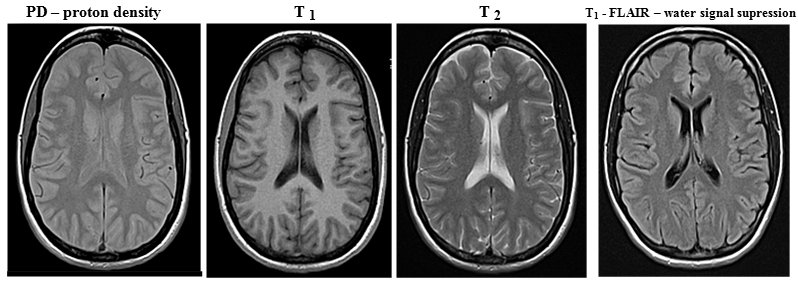
Fig.3.4.5 MRI images of the brain (transaxial
section, without pathology) in proton density, relaxation times T
1 and T 2 and in a special FLAIR sequence
to suppress the water signal.
(MRI brain images were taken by Jaroslav
Havelka, MD, head of the MRI RDG department at the University
Hospital Ostrava )
Proton densities and especially
relaxation times are different not only for
different types of tissues (see table above), but also differ
depending on the physiological or pathological condition of the
same tissue. This makes NMRI imaging an important diagnostic
method in medicine, including in the field of tumor
diagnostics.
Note:
As with X-ray diagnostics, NMRI also uses contrast agents
to increase the contrast of images of certain structures (eg
cavities or blood vessels), but not on a density but on a
magnetic basis - ferromagnetic compounds, mostly
based on gadolinium .
Pulse sequence in NMRI
In medical MR imaging, it is desirable to create images with
sufficient high contrast between different
tissue types so that the MRI radiologist can best answer the
clinical diagnostic question. Optimal image contrast between
different tissues with different densities and rexation times can
be achieved by suitable excitation of magnetic moments of nuclei
and subsequent measurement of their response MR signal:
by setting parameters of pulse sequence - time
sequence of transmitted electromagnetic excitation pulses RF and
subsequent measurements of the "echo" of the
electromagnetic signal emitted by the relaxing nuclei. The first parameter here is the intensity
(energy) of the transmitted radio frequency excitation pulse (RF),
which determines the predominant angle of deflection (tilt) of
the magnetization vector of the analyzed nuclei - 90° or 180°.
The higher the excitation intensity radiated into the analyzed
target tissue, the higher the percentage of reversal of the
magnetic moment of the nuclei and the stronger the response
signal and more time is required for relaxation. Another
parameter is the time interval TR , in which we repeatedly
apply individual radiofrequency excitation pulses. The shorter
this interval, the less time there is for T1 relaxation. The
third parameter is the time TE (echo time) between the excitation
pulse and the detection of the response resonant signal. The
longer this time, the less nuclei with a shorter relaxation time
T2 will contribute to the measured resonant signal. The
completely approximate values of the pulse sequence times for
obtaining the basic types of MRI images at B = 1.5 T are :
PD: TR
= 1000 ms, TE = 5-30 ms; T1
-weighted: TR = 10 ms, TE = 5-30 ms; T2 -weighted: TR = 1000-2000 ms,
TE = 80-100 ms.
In connection
with these regularities, several significant sequences
of transmission of excitation radiofrequency pulses and
subsequent detection of response relaxation signals have been
developed (sometimes called "MRI
techniques" in MR jargon ) :
-> Saturation - recovery sequence in which
90° RF pulses are transmitted at regular intervals. Upon arrival
of each RF pulse, the magnetization vector rotates 90° and
relaxation begins with different times T1 in different tissues. When another RF pulse arrives, the
z-component of the magnetization will be different in different
tissues. With a suitable repetition period TR of excitation RF
pulses, we can set the optimal contrast of the desired tissues at
times T1 . This
simplest MRI technique is now rarely used, it has been replaced
by the inversion-recovery sequence below, providing
higher contrast.
-> Spin - echo sequence consisting of a
90° RF pulse followed by a 180° RF pulse. After the
magnetization vector has been flipped into the xy plane due to a
90 ° RF pulse, T2 (resp.
T2 *) relaxes, during
which phasing occurs. However, the subsequent 180° RF pulse has
a "refocusing" effect - it flips the individual spins
in the xy plane by 180 ° and the spins are phased again. The
result is an echo signal in the receiving coil, the amplitude of
which depends on the relaxation times T 1 and T 2 of
the tissue (unfavorable T2 * does not apply here, because the
effect of magnetic field inhomogeneity on phasing is eliminated
by 180 ° pulse phasing) . The character
and contrast of the display can be adjusted using the times TR
and TE. With short TR and short TE we get T1-weighted image, long TR and short TE provide a proton
density image, long TR and long TE provide a T2 -weighted image. Due to this
variability of imaging options, spin-echo is the most
commonly used MRI technique.
-> Inversion - recovery sequence,
consisting of a sequence of 180° and the following 90° RF
pulse. The initial 180° pulse inverts the magnetization
vector to the opposite, after which T1 relaxation takes place . With a time interval TI
- inversion time , a 90° RF pulse then follows, which
flips the magnetization vector into the xy plane. A RF signal
dependent on T1 is
detected in the receiving coilrelaxation time of the displayed
tissue. The contrast of the image can be adjusted appropriately
using the TI time. A significantly more contrasting image can be
achieved than with the saturation recovery technique.
By a special setting of the time T1 = T1 .ln2, the suppression of the image of
the tissue having this relaxation time T 1 is achieved . By setting the short inversion time TI
(approx. 140ms with a 1.5T magnet) - the so-called short
time inversion recovery STIR - the suppression
of the fat signal is achieved in the
image . Conversely, by extending the time TI (to about 2600ms) - fluid
attenuation inversion recovery FLAIR - we can achieve suppression
of the water signal. Other fine details and anomalies in
the structure of the examined tissues can then be better assessed
on such "cleaned" images.
-> Gradient - echo sequence begins with a
90° RF pulse (which tilts the magnetization vector to the xy
plane), after which a magnetic field gradient is applied. The
nuclei in adjacent atoms will thus show a precession with a
slightly different Larmor frequency, which will cause spin
phasing. The application of the second mag. gradient with the
opposite sign, which rephases the spins and at this point the
echo is measured. Used to obtain a T2 -weighted image.
->
..........
sequence ............ ? add more sequences? ........... ?
complete the picture of the graphic sequence diagram? ...
Computer analysis of MRI
images obtained with appropriate sequences (mentioned
above) can create special image
modulations - such as water or fat signal suppression images
. Other special sequences are used for functional
MRI (mentioned below) :
->
Susceptibility weighted imaging ( SWI
) shows tissues with slightly different magnetic susceptibility.
It uses an extended gradient-echo sequence for display in T2*. Its main
variant is Blood oxygenation level dependent (BOLD), see fMRI below .
->
Diffusion weighted imaging (DWI) shows the diffusion of water inside tissue
elements, manifested by Brownian motion of molecules. Using a
spin-echo sequence with the application of 2 gradients, a subtle
effect is registered, in which Brownian-moving water molecules
show a different phasing-phasing relationship when reversing the
mag. gradient; this leads to a slightly weaker T2 signal.
MRI Magnetic Resonance
Spectrometry MRI
Magnetic resonance imaging (MRS) can be supplemented by the magnetic
resonance spectrometry (MRS) described above, which
enriches this examination with additional physiological
information. Chemical analysis is
performed here by analyzing the chemical shift
of the Larmor frequency imaging structures in-vivo, eg choline or
lipid levels. Chemical shifts are very fine, so this method is
demanding not only in terms of signal analysis, but also requires
high intensity (recommended at least 3 T) and homogeneity of the
magnetic field.
Functional magnetic
resonance imaging - fMRI
Magnetic resonance imaging may be a suitable method for
non-invasive imaging of the function of various
tissues and organs (along with "molecular" imaging in
nuclear medicine - .....). So far, fMRI has found application
mainly in functional brain imaging, mapping neuronal
activity . Neurons (which do not
have internal energy stores) they need to
get sugar and oxygen quickly for their increased activity. The
hemodynamic response to this need causes an increase in blood
perfusion at a given site, but mainly a greater release of oxygen
from the blood than inactive neurons. This leads to a change in
the relative levels of oxygenated oxyhemoglobin and
non-oxygenated deoxyhemoglobin in the blood at sites of neuronal
activity.
In this respect, two basic
methods of indirect mapping of neuronal activity are used :
-
Local increase of perfusion
at the site of increased neuronal activity - perfusion fMRI
.
-
Change in the ratio
of oxygenated and non-oxygenated blood at the site of
neuronal activity. The method is called BOLD fMRI
(Blood Oxygen Level Dependent). Changes
in the relative levels of oxy- and deoxy-hemoglobin can be
detected based on their slightly different magnetic
susceptibility. Basic hemoglobin without bound oxygen
(deoxyhemoglobin) has slightly paramagnetic properties,
but when oxygen is bound to it (oxyhemoglobin), it behaves
slightly diamagnetically . If more deoxyhemoglobin
accumulates at a certain site in the brain tissue, a slightly
stronger MRI signal is obtained from it than from the sites where
deoxyhemoglobin predominates.
MRI functional imaging of the brain is
performed after neurological activation , either
motor (eg movement of fingers) , visual, linguistic or cognitive.
The
physical-electronic implementation of NMRI
NMR imaging is the most complex imaging
method. The operation of the device for NMR imaging is
electronically very complicated and demanding, so it must be
controlled by a powerful computer with
sophisticated software - Fig.3.4.4d. In the multiplex
mode, the process of transmitting a sequence of radio
frequency pulses, modulation of gradient magnetic fields, sensing
and analysis of relaxation signals of magnetic resonance,
reconstruction and creation of the resulting images, as well as a
number of other transformation and correction procedures are
synchronously controlled. Since these are harmonic (sinusoidal)
waveforms, scanning and reconstruction are performed using Fourier
analysis - in the frequency so-called K-space.
It is a set of matrices defined in the memory of the MRI
evaluation computer, into the individual elements of which the
frequencies, amplitudes and coordinates of MRI signals are
recorded. From these "raw" data, the resulting MRI
images are created using Fourier transform and other
analytical methods.
Note:
Electron paramagnetic resonance (EPR) is based on a
similar principle as NMR. The magnetic moments of the electron
shells of atoms are used here .........
Thermography
Thermography is a method of imaging the temperature
distribution on the surface of analyzed objects. The
medical use of thermography is based on the fact that some pathological
events in the body are accompanied by changes in
temperature (eg the inflammatory process by raising the
temperature), which are also reflected on the surface of
the body at a location above the lesion. Thermographic
imaging can be performed in two ways :
¨ Contact thermography
using liquid crystals. Liquid crystals are
substances that behave mechanically as liquids, but optically as
solid crystalline substances (they appear optical anisotropy).
Thermography uses the properties of some liquid crystals that,
depending on the temperature, they color differently
(thermo-mechanical changes are reflected in the the interference
of incident light). With a suitable composition, liquid crystals
can be prepared, which make it possible to display different
temperature ranges in color. The liquid crystals were formerly
painted directly onto the skin with a black-backed. They are now
coated on a special flexible foil, which attaches to the skin.
¨ Infrared electronic thermography
by scanning infrared radiation from the surface
of examined bodies with a special video camera
sensitive to infrared radiation. Each body of non-zero
temperature emits infrared radiation (thermal radiation)
- electromagnetic waves of a continuous spectrum with a
wavelength greater than visible light. Its intensity is greater
the higher the surface temperature; as the temperature rises, the
average wavelength decreases. It is used in industry and
construction - for example, in the infrared image of a heated
building, the places of poorer insulation with higher heat
leakage are clearly shown.
Thermographic imaging
of the body surface, obtained with a sensitive infrared camera,
may show areas with abnormally elevated temperatures
(differences may be less than tenths of °C), which may indicate inflammatory
or tumorous process in the tissue lying beneath
this precinct. Alternatively, low temperature areas
may indicate a perfusion disorder, perhaps due
to occlusion of a blood vessel (eg, venous thrombosis).
Electroimpedance
imaging
Certain information about the properties of tissues can be
determined by sensing the local electrical conductivity,
resp. impedance of examined tissues. A weak
electric current is introduced into the tissue by means of
electrodes placed on the skin in the vicinity of the examined
area, and also by means of electrodes the distribution of
electric potentials on the surface is sensed. From these data it
is possible to reconstruct the spatial distribution of local
tissue impedance - electroimpedance image. A different
electrical conductivity is observed in the tumor tissue
from the surrounding tissue. This method is trying (so far
rarely) in mammography.
Complementarity
of methods
From this brief overview of the principle and statements of
several different imaging methods, we see that each of the
methods looks at the examined tissue or organ from a different
"viewing angle" - it examines a different
aspect of morphology or function. In
other words, it can be said in general, that the individual
imaging methods are complementary to each other
- in certain aspects they complement and compose
a diagnostic "mosaic", which is then interpreted
by an experienced clinician into the final diagnosis,
from which the appropriate method of therapy is
derived.
Status
and role of nuclear medicine
Scintigraphy does not provide images with as high a resolution as
CT, it does not recognize density, temperature or mechanical
consistency of tissues. The main "floor" of nuclear
medicine is the non-invasive imaging and quantification
of structures and processes in the body, which are characterized
by a specific function and metabolism,
which can be "traced" by a suitable radio-indicator and
imaged by external detection of gamma radiation. The degree of
local accumulation of radiopharmaceuticals depends on the
intensity of local metabolic and functional processes in organs
and tissues. Possible anomalies and malfunctions can be located
and quantified using scintigraphic imaging. Disorders of function
in many cases precede structural disorders - anatomical and
morphological. Therefore, pathological events can be detected by
nuclear medicine methods sometimes earlier than other imaging
methods (typical examples are bone
metastases of breast, prostate or lung cancer). The perfusion of tissues or organs
and the dynamics of blood flow through
individual parts of the heart and blood vessels can also be
analyzed very well by nuclear medicine methods.
Scintigraphic diagnosis of tumorous
diseases is very important through targeted uptake of specific
radiopharmaceuticals (especially monoclonal antibodies), which
can be effectively followed by biologically targeted radionuclide
therapy - a theranostic approach.
Fusion of PET and SPECT images with CT
and NMRI images
In this §4.6 "Relationship between scintigraphy and
other imaging methods", it was continuously discussed
how the individual diagnostic methods complement
each other in creating a comprehensive picture of the healthy or
pathological condition of individual organs and the whole
organism. The main goal is to combine anatomy with
physiology, or in other words function with
morphology, in order to better clarify the location,
biological character and origin of pathological foci and
abnormalities - assign the foci shown on the
scintigram to specific anatomical structures in
the organism. In the field of imaging methods, in such multi-modalities
examinations are scanned and compared the CT , SPECT , PET , NMRI and sonography images.
Scintigraphic images provide
important information about the functional status of tissues and
organs, but are usually unable to provide sufficient anatomical
information about the exact location of pathological
abnormalities (lesions) imaged scintigraphically. Radioactivity
does not enter the surrounding anatomical structures (eg skeletal), which do not
capture the radioindicator and are not visible in the
scintigraphic image. For a better and clearer comparison of the
character, size and location of the displayed structures, it is
optimal to perform a simultaneous display PET+CT
images, or SPECT+CT (eventually +NMRI), into a single
suitably color-modulated image - so-called image fusion.
Individual images are overlaid in various color
combinations. In these images, where it is possible to
continuously modulate the percentage of
individual images (from what percentage
will one image be projected into another),
we can observe the correlation of physiological
and anatomical-structural information. This will make it possible
to accurately locate scintigraphically displayed
lesions in terms of space and anatomy.
These mergers often encounter the
problem, if images from different modalities were captured at
different times, at different display scales, and with different
geometric configurations of the patient relative to the
imaging device. Sophisticated computer graphics programs are able
to perform affine and conformal transformations of images
to correct geometric effects - scaling and relative position of
displayed structures (translation,
rotation, reorientation, enlarging or reducing,
cross-correlation) and achieve a relatively
good "matching" of images, but some deviations from the
exact overlap of the corresponding structures may persist. For
this process of geometric alignment of images,
the somewhat misleading name of registration
or normalization of images is sometimes used. Procedures
of this kind are applied in a number of areas of computer image
processing (eg in panoramic photography,
cartographic imaging, astrophotography).
Hybrid
tomographic systems - combination
of PET+CT, SPECT+CT, (PET+MRI)
In order to eliminate these problems, as
well as to operatively and quickly achieve comprehensive
diagnostics, an effort was made to combine some
imaging methods into one device. Imaging device
manufacturers have developed so-called hybrid systems,
combining pairs of PET+CT or SPECT+CT devices (a combination of PET+MRI is also mentioned below). These combined systems have three basic advantages :
*) Geometric alignment of CT images
with SPECT and PET images
When fusing functional scintigraphic SPECT or
PET images with anatomical CT images, it is important that the
structures shown in both modalities overlap geometrically
- they appear in the same place of the image. To calibrate
this precise harmonization of mutual overlapping position
of the displayed SPECT <-> CT or PET <-> CT
structures on hybrid instrumenrs, is used scintigraphic +
CT imaging of point sources filled with mixture
of radionuclides (99mTc, or 18F) and the contrast agent ("Phantoms and
phantom measurements", part "Tomographic
phantoms for SPECT, PET, CT",
passage "Geometric alignment of images CT images of
SPECT and PET").
This process geometric alignment of the images are sometimes (not very accurately) called spatial
normalization and registration of images.
Hybrid combination PET/CT
in recent years, it has become a standard
feature of PET-nuclear medicine workplaces, and its benefits are undeniable,
especially in the field of tumor diagnostics. Separate PET
cameras, without CT, are no longer manufactured.
The combination of SPECT+CT is also useful for refining
localization diagnostics, although the proportion of tumor
imaging in SPECT is lower. In the SPECT/CT combinations is
sometimes used the simpler and cheaper "low-density" ("low dose", "non-diagnostic") localization CT, but this solution is
not entirely optimal; for greater versatility are prefered hybrid
combinations with full diagnostic multi-slice CT
(which, by the way, can be operated even in
a low-dose mode, by reducing the anode current). In many cases, the combination of SPECT/CT helps to
refine the diagnosis by physiological-anatomical correlation.
Hybrid combination of PET + NMRI
Nuclear magnetic resonance imaging (NMRI) provides, compared to
CT, better soft tissue resolution, which is particularly
advantageous in oncological diagnostics. In recent years,
therefore, efforts have been made to develop a hybrid combination
of PET/NMRI imaging devices. However, the direct
combination of "classical" PET and NMRI technologies
into one system faces a major problem: the
strong magnetic field of the NMRI superconducting electromagnet
affects the movement of electrons between dynodes in
photomultipliers of ring scintillation detectors in PET (Lorentz force acts on electrons);
in a strong magnetic field, the photomultipliers stop
working. However, technologies have been developed to
combine PET with NMRI :
¨ Semiconductor photodetectors. Instead
of conventional photomultipliers, APD (Avalanche
Photo Diode) semiconductor photodiodes or SiPM
semiconductor photomultipliers are used in the PET ring detector
(see §2.4, section "Photomultipliers"). These photodetectors are not sensitive to
magnetic fields.
¨ Multipixel fully solid-state detectors
(e.g. based CZT) of annihilation photons (instead
scintiblokù BGO/LSO with conventional photomultipliers or SIPMA). In addition to better detection efficiency and the
spatial resolution can thereby be achieved coincidence somewhat
shorter time (for better TOF). The advantage of semiconductor detectors is also their
independence on the magnetic field, which just
allows the use in hybrid systems of PET/MRI.
Note: Initially, some
provisional suboptimal solutions were proposed :
- NMRI magnetic field modulation, which
would turn on only while magnetic resonance imaging was acquired,
while it would be turned off when capturing PET images.
- Optical fibers - light scintillations from annular PET
scintillators would lead to photomultipliers located outside the
NMRI magnetic field using optical fibers.
These bizarre makeshift suggestions have not prove,
did not work and were not used in practice. The only real
possibility of a hybrid PET/MR combination is the use of magnetically
independent semiconductor photodectors, or better
directly semiconductor gamma detectors.
A hybrid PET/MRI combination is sometimes abbreviated as
mMRI - Molecular Magnetic Resonance Imaging:
MRI provides imaging of morphological and functional details of
tissue, PET shows tissue metabolism at the molecular-cellular
level. The integrated PET/MRI system allows, in some cases, more
accurate identification and determination of the extent and
characteristics of malignancies, which can help plan effective
treatment and eventually its effect. The system can also be used
in neurology and cardiology.
However, the combination of PET/MRI
also has some disadvantages, due to which it
cannot yet function as a routine alternative to PET/CT (so far it
is more of a specialized device) :
- Relatively long magnetic resonance imaging time, which
limits the number of patients due to the work shift and the short
half-life of 18-F; it also causes blurring of images in the chest
and abdomen with breathing movements. CT is incomparably faster,
practically does not prolong PET examinations and provides sharp
images of moving organs.
- Common contraindications MRI (pacemakers,
metal implants, stents), while CT has no
contraindications (other than PET).
- MRI images do not yet provide accurate density maps for
the exact correction of PET images to attenuation g radiation in
tissue, as provided by CT images.
- Significantly higher purchase price of equipment and
high operating costs of MRI, compared to CT.
The argument that MRI is a non-radiation
method with zero radiation dose is not significant here. PET
gammagraphy alone is loaded with a relatively higher dose, and
due to the composition of patients, who will usually be treated
with radiotherapy with many times higher doses, the dose from CT
imaging is irrelevant.
Therefore, installing
a hybrid PET/MRI combination as the first or
only PET device in a complex oncology center is not
entirely optimal. A more suitable variant is the
currently proven PET/CT combination; for the extension of complex
diagnostics supplemented by a high-quality nuclear magnetic
resonance device (3 T magnet) in a separate room or workplace,
using computer fusion of PET+CT images with MRI images. In larger
workplaces, even a hybrid combination of PET/MRI can be
successfully used for some indications.
A hybrid
combination of imaging diagnostic and radiation
radiotherapy technologies is discussed in §3.6
"Radiotherapy", section "Modulation of radiation beams".
4.7.
Visual evaluation and mathematical analysis of diagnostic images
Diagnostic images - X-ray
(planar or CT), scintigraphic (planar, SPECT, PET) and magnetic
resonance MRI can carry a lot of information
about physiological or pathological anatomical-morphological
situation and structure of tissues and organs, their function and
metabolism, the presence of abnormalities and pathological
lesions. To obtain this important diagnostic information - image
evaluation - there are basically two ways to proceed :
¨ Visual evaluation
by an "experienced eye" of an erudite expert
in the field of nuclear medicine, X-ray or MRI diagnostics. This
is the basic method of evaluation (and
before the era of digital imaging it was the only way...). An experienced radiologist can recognize
a number of abnormalities, disorders, lesions on well-scanned
images (with the necessary
processing - brightness modulation, filtration, corrections). Such a description can then be an important guide for
the detection and proper treatment
of possible pathological conditions, as well as for the
assessment of the response and effectiveness of the therapy.
¨ Quantitative
processing ,
which with the help of mathematical-computer analysis
provides quantitative parameters about the
densities of various tissues and districts, the uptake of
radionuclides and the function of the examined
organs, on the course and rates of functional-metabolic processes
("molecular" imaging). The quantitative results obtained in this way complement
and refine the visual assessment (eg
the degree of metabolic activity of the visually recognized
lesion), but they may also have their own
importance for the assessment of functional processes in the
organism (functional state of the kidneys,
heart, liver). New special methods of
filtering and computer image processing can also "pull
out" and emphasize some details,
indistinguishable in native images - and thus help visual
evaluation.
Multifactorial
statistical analysis of images, radiomics
In addition to the basic structural and functional information
mentioned above, diagnostic images may also contain some additional
information that is not directly visible (and does not
result explicitly from quantitative analysis), but can in
principle be extracted by special sophisticated computer methods
of structure recognition and feature
analysis in paintings. An example could be an analysis
of the relationship between tumor size and shape (surface and
volume), the degree of internal homogeneity or heterogeneity of
displayed lesions and other semantic features in the images. It
is also possible to analyze the topological shape and compactness
(such as the Hausdorf analysis of the
contour dimension) and the relationship of
the displayed structure with the surrounding tissues.
Factors extracted in such a way do
not provide any individually valid diagnostic
information by themselves. Only when we confront them
with statistical sets of a large number of evaluations
of images of the same kind obtained in different patients with a
reliably described diagnosis (including
genetic character), treatment method,
response to therapy and overall outcome, can we - with some
probability - reveal certain similarities and
cerrespondences. This can potentially help to refine the
diagnosis - by pointing to the possibility shown by this
similarity - and possibly predict the response
to the appropriate type of therapy and the further development of
the disease.
The necessary comparison
databases can be created so that for each diagnosis
considered in a standardized way performs
multifactorial analysis of images in many patients with the
appropriate (reliably verified) diagnosis and the quantified values of
the extracted feature - factors from these images are gradually
stored in special files, including the evaluation of statistical
variance. In case of event. clinical use, then a particular
patient performs display from which a multifactorial analysis of
extracted features necessary (standardized
same manner as in Comparative databases) and
their values are compared with statistical methods - confront
- with the respective "exemplary" values from the
database. From "probability intersections"
values of several factors can be inferred to a certain sub-type
of pathology and possibly predict its behavior.
These methods, based on "machine
learning" and artificial intelligence, are still in
the stage of experimental development, creation of necessary
software, experimental compilation of factor databases from
"sample" images (templates). For a set of
these methods, using sophisticated image analysis methods in
conjunction with statistical processing, the name radiomics
has been used in recent years. Its perspective is to become a
"bridge" between radiometric imaging and personalized
medicine.
Mathematical analysis and
computer evaluation of nuclear medicine <<-------click
As a relic of
the earlier structure of the monograph "Nuclear Physics
and Physics of Ionizing Radiation", in which the
chapter "Physical and Technical Problems in Nuclear
Medicine" was included, the computer evaluation of
scintigraphic studies consists of a separate set "Mathematical analysis and computer evaluation in
nuclear medicine", which
is then followed by a separate book "Complex computer
evaluation of functional scintigraphic examinations on a PC - OSTNUCLINE system", describing specific procedures and algorithms,
mathematical analysis and evaluation of scintigraphic studies of
individual organs.
In this treatise "Radionuclide
scintigraphy" the acquisition and evaluation
of clinical scintigraphic examinations described in §4.9 "Clinical
scintigraphic diagnostics in nuclear medicine".
Furthermore, the work "Filters
and filtration in nuclear medicine"
is related to this topic.
4.8.
Radionuclides and radiopharmaceuticals for scintigraphy
In order to be able to diagnostic imaging something at
all with the help of scintigraphy, it is necessary should be to
introduce into the body a g -radioaktive substance - radiotracer or
radiopharmaceutical, whose distribution in
various tissues and organs are then imaged. The indicator or tracking
principle is used: radioisotopes behave chemically
exactly like stable isotopes of the same element, but are
"visible" through their radiation, which allows their
monitoring in the system using ionizing radiation detectors, in
the case of scintigraphy also imaging their
distribution.
Radiopharmaceuticals
are special diagnostic or therapeutic preparations containing radionuclides,
which are a source of radiation. A radioactive atom is
incorporate in their molecules - by radionuclide we label
a suitable compound that determines the pharmacokinetics
according to our diagnostic or therapeutic requirements. The
radiopharmaceutical is composed of two main parts :
× Carrier - specific biochemical
substance providing pharmacokinetic targeting or
directing to the desired site, tissue or organ which is to be
displayed (or treated). The carrier is its own indicator
of function, which actively or passively participates in
the examined or therapeutic
process in the target structure. In the simplest case, the
carrier is water (saline), in which the radionuclide is dissolved and carried by
the bloodstream, or air during pulmonary ventilation examination.
However, most of them are more complex biochemically
active substances - from inorganic salts, through cyclic
hydrocarbons, chelates, dispersed colloidal particles, peptides,
protein carriers, immunoglobulins, monoclonal antibodies,
radiolabeled cells (erythrocytes or
lymphocytes) - which are selectively
taken up in target tissues, or pass through the
bloodstream. The radionuclide carrier is selected according to
the required diagnostic or therapeutic performance.
× Radionuclide bound to this carrier,
ensuring by its emission of ionizing radiation
"visibility" - signaling or indication
positions of indicator molecules (carriers) in the organism
- in our case display of its distribution. In therapy,
it then causes biological effects on tissue
cells. The binding of the radionuclide should be such as not to
alter the biochemical properties of the carrier.
Radiopharmaceuticals may also contain some stabilizing or
antioxidant excipients.
Radiopharmaceuticals are open
radioactive emitters and, after application to the body,
enter into various metabolic processes depending
on their (bio)chemical structure.The chemical
composition of the radiopharmaceutical determines its
incorporation into kinetics or to certain metabolic processes,
built-in radionuclide, by its radiation, then enables either
external detection of the distribution of this substance (in scintigraphy), or monitoring
of its amount in the samples (biological
fluids, mostly blood or urine). In the case
of therapy, radionuclide radiation performs biological
effects on the cells of the tissue in which the
radiopharmaceutical accumulates (eg, it
destroys tumor cells - §3.6, section "Radioisotope therapy with open emitters").
The selected radiopharmaceutical
should ideally accumulate only in the desired target
areas. In practice, however, radiopharmaceuticals are to
a greater or lesser extent also absorbed in other
tissues and organs, or create a continuous tissue
background. This undesirable pharmacokinetics
should be taken into account when evaluating scintigraphic
images, as well as when assessing side effects - radiotoxicity
- in biologically targeted radionuclide therapy (§3.6, section "Radioisotope therapy").
Radioindicators in nuclear medicine are
applied in small trace amounts, approx. 10-9 -10-12 grams (pico- or nanomolar concentrations in tissues) and therefore on their own cannot affect
function of the examined organs, nor can they cause any
side or toxic effects on the organism. Therefore, due to the
small and practically immeasurable amount by weight,
radiopharmaceuticals cannot be dosed according to their weight
[mg] - the weight of the "active substance", as is
usual for drugs. Radiopharmaceuticals are dosed by the applied
activity in [MBq].
Note: In this respect, radioindicators
used in nuclear medicine differ significantly from
contrast agents used in X-ray diagnostics. The X-ray
contrast agent is applied in a relatively larger amount (up
to tens of grams) needed to produce a sufficient contrast of
X-ray absorption. There is a relatively high concentration in the
blood and tissues, which due to the chemical composition of
contrast agents (mostly iodine compounds) can significantly
affect the function of the examined organs. Some contrast agents
can have side effects or toxic effects, they can cause allergic
reactions. In contrast, radioindicators used for diagnostics in
nuclear medicine are biochemically safe and
usually have no contraindications.
A certain exception to
this biochemical safety are radiopharmaceuticals based on murine
monoclonal antibodies. They may have allergic
reactions in a small percentage of patients, caused by
the presence of so-called HAMA antibodies (Human
Anti-Mouse Antibodies ); an adverse immune response
to the preparation - production of human antibodies against
murine monoclonal antibodies - may then occur. It is therefore
desirable to perform a laboratory biochemical test for HAMA
antibodies before using these radiopharmaceuticals, and its
positivity should be a contraindication to the use of these
products.
Compared to
other pharmaceutical preparations, radiopharmaceuticals have two
other specifics :
«- Time-varying
content of a substance carrying a diagnostic or
therapeutic effect - the amount of radioisotope used decreases
exponentially over time due to radioactive transformation
(he rate of this decrease
varies for individual radionuclides, depending on their
half-life). This is associated with a short
expiration time (which cannot be
extended in any way, regardless of eg storage temperature).
«- Remote
action - emitted ionizing radiation, especially
penetrating gamma, can have biological effects - in this case undesirable
- even outside the tissue where the drug was distributed (or even on another patient in the vicinity of the
patient with applied radioactivity).
For the use of scintigraphy in nuclear
medicine, several g-
radionuclides are
available (mixed b-g, EC, pure g, for PET then b+ with subsequent emission of annihilation g radiation) in the
chemical form of a number of radiopharmaceuticals,
enabling the study of various functional processes in the
organism. Methods of production and physical (nuclear)
characteristics of individual radionuclides are detailed in §1.6
"Radionuclides",
where their measured spectra are also displayed. Here we will
mention in particular the properties of the most important
radionuclides used in nuclear medicine. For each such
radionuclide, we draw its decay scheme, describe the methods of
its radioactive transformations, types and energy of emitted
radiation. Finally, for each radionuclide, we present the gamma-ray
spectrum measured by a scintillation spectrometer
with a multichannel analyzer - such a spectrum can then be
observed in practice also on a scintillation camera; a more
detailed semiconductor spectrum is also measured.
Radionuclides and radiopharmaceuticals for
single photon gammagraphy - planar and SPECT
Radioiodine 131
I (+ 125I + 123I )
The first radionuclide used in clinical nuclear medicine was radioiodine
131
I (T1/2 = 8 days, b- with max. energy 606keV, the main energy g is 364keV), which
is of key importance for the diagnosis and therapy of thyroid
disease (§4.9.1 "Thyrological radioisotope diagnostics"). It is administered orally
in the form of 131I- sodium iodide. For several
years, radioiodine-labeled 131I-o-hippuran was also used for radionuclide nephrography
and possibly renal scintigraphy, later displaced by 99mTc- labeled
radiopharmaceuticals (see below).
The radionuclide 131I is converted (according to the decay
scheme in the figure on the left) by b- radioactivity to excited states of the daughter nuclide
xenon 131Xe,
which is already stable (non-radioactive). The dominant
"channel" of beta-conversion is to an excited level of 364.5
keV (89%), which in 81% deexcites to baseline 131Xe and in 6%
deexcites to a level of 80keV (which then deexcites to baseline).
In 2% there is a decay to the excited level of 722keV, in 7% to
the level of 637keV. One of the excited levels of 131Xe is the metastable
131mXe level with an energy of 164keV,
which deeexcitates to the ground state of the 131Xe nucleus with a
half-life T1/2
= 12
days. Only 0.38% of 131I decays occur at this metastable level, and in
addition, its deexcitation is subject to internal conversion, so
that only about 0.021% is emitted as 164keV gamma radiation.
After about 14 days, a radioactive equilibrium is
reached, when the activity of 131I is equal to the activity of 131mXe.
Fig .... Decomposition scheme and gamma-spectrum of radioiodine 131I
The spectrum of gamma radiation 131I is dominated by
the main photopeak capturing the energy of radiation g 364keV.
Towards higher energies, two weaker peaks, 637 and 723 keV, are
visible. In the region of lower energies we also see weaker peaks
284 and 80 keV, at the very beginning of the spectrum the
characteristic X-rays of Ka,b xenon 30keV (low-energy lines La,b
4-5keV on a conventional scintillation detector are not visible). The faint 164keV photopeak from the metastable 131mXe is not very
noticeable, because it lies in the Compton scattering region of
the main energy 364keV (interferes with the backscatter peak) -
it is analyzed in " 131 I ".
For in vitro radioimmunoassay (RIA, RSA) is then
used radioactive iodine 125
I (T1/2 = 60 days, EC, X 27+31keV, g 35keV) ....
For scintigraphy is also used radioiodine 123
I (T1/2 = 13.1 hours, EC, g 159keV, X 27+31 keV), which has more advantageous
physical properties for this purpose than 131I - more suitable energy g and the absence of b, which leads to a
lower radiation load. Radiopharmaceuticals marked 123I are seldom used
for scintigraphy of kidneys (o-jodhipuran), more often thyroid
gland (NaI), heart (MIBG), as well as for scintigraphy of
receptor systems in the brain - 123I-ioflupane, 123 I-IBZM (§4.9.8, part "Scintigraphy of receptor systems in the
brain"). Compared to 99mTc, 123I has disadvantages in higher price, difficult
distribution (short T1/2) and slightly higher radiation load.
Fig .... Decomposition scheme and gamma-spectrum of radioiodine 123 I
Technetium
99m Tc
The most important radionuclide for nuclear medicine is
metastable technetium 99mTc (T1/2 = 6 hours), which is a pure gamma emitter
(Eg =
140keV) and is obtained mostly by beta-decay of molybdenum 99Mo (T1/2 = 66 hours) in the so-called generator
(see §1.2. "Radioactivity", part
"Gamma radiation"). 99mTc is an almost ideal radionuclide for
scintigraphy, on which basically the entire development
of nuclear medicine in the 1960s and 1990s was based;
has the following advantages :
× 1. A pure gamma emitter with a
short half-life of 6 hours allows, without the risk of
significantly increased radiation exposure, to apply to patients
a relatively high activity of 99mTc (in the order of
hundreds of MBq) required to obtain quality images in SPECT or
dynamic scintigraphy.
Note: After deexcitation of 99mTc, the 99Tc
is formed in the ground state. It is also radioactive: it b-
-transforms into a stable core of 99Ru (see Fig.4.8.2), but the half-life is very long here
- 2.11.105 years. Since the activity of a preparation containing a
given number of No radioactive nuclei is A = No . l, is the ratio of the
activities of the parent and daughter radioisotopes in the ratio
of their decay constants l, or the inverse ratio of their half-lives T1/2. The relationship between the
activity of 99mTc and the activity of the formed 99Tc is thus given by the coefficient » 4.10-9. With an applied
activity of the order of 100MBq 99mTc, the activity of the resulting 99Tc will be only about 0.4 Bq, which is practically zero
(unmeasurable, well below the level of the natural radioactive
background, eg 40K). Thus, from the point of view of nuclear medicine,
the resulting 99Tc can be considered non-radioactive.
However, the opposite situation is in the field of nuclear
reactors (see §1.3 "Nuclear reactions", passage "Atomic
nuclear fission"), where 99Tc, produced in
significant quantities as one of the fission products of uranium,
is a difficult component of nuclear waste with long half-lives,
potentially hazardous to the environment.
×
2. Radiation g with an energy of 140
keV can be collimated very well
and effectively detected in a thin large-area
scintillation crystal of a gamma camera, which provides images
with relatively good resolution and sensitivity.
× 3. 99mTc is easily obtained from a Mo-Tc generator
(the physico-chemical principle of
radionuclide generators is described in §1.2, part "Gamma
radiation", passage "Radionuclide
generators" and in §1.4 "Radionuclides", part
"Production of artificial
radionuclides", passage
"Radionuclide generators"). These generators are mostly of the elution
type. Molybdenum 99Mo is absorbed on a support (mostly Al2O3) in an "insoluble" oxide
form in a "chromatographic" column. After the
radioactive transformation of the 99Mo core into a 99mTc daughter core, the resulting technetium atom is
released from an insoluble bond; combines with 4 oxygen atoms to
form the anion 99mTcO4 - pertechnetate.
This daughter product is soluble in water,
whereby it can be separated from the starting molybdenum by
washing with water - elution (Fig.4.8.1 left).
Since the elution is performed with physiological saline
containing a NaCl salt, the pertechnetate anions are immediately
ionically bound to sodium to form sodium pertechnetate
Na 99mTcO4-. In this chemical form we obtain technetium from the
elution generator.

Fig.4.8.1. Elution 99Mo - 99mTc generator.
Left: Principle functional diagram of
the elution generator. In the middle:
Technical design of a sterile generator with an evacuated elution
vial.
Right: Decomposition scheme of
molybdenum 99Mo to technetium 99mTc, deexcitation to 99Tc and slow transformations to stable ruthenium 99Ru.
New types of sterile elution generators use an evacuated
elution vial, into which, after "puncture"
under atmospheric under-pressure, the saline solution is
automatically sucked through a tube leading from the storage vial
through the sorption column of the generator with 99Mo (Fig.4.8.1 in the
middle). Within about 30 seconds, the vial is filled with 99mTc eluate.
In §1.2, part
"Exponential law of radioactive decay",
passage "Mixtures of radionuclides, decay
series, radioactive equilibrium",
the general equation of subsequent decay of radionuclides A(lA)®B(lB)®C
(stable) was derived. If we apply this equation (multiplied by
the factor lTc to get the
instantaneous activity in [Bq] from the instantaneous number of
nuclei) to our case of the Mo-Tc generator 99Mo(lMo=0,0105h-1)®99mTc(lTc=0,1155h-1)®99Tc ("stable") and taking into account that 87%
99Mo
decays to a metastable excited level of 99mTc, we get for the time dependence of the immediate
activity of the required technetium 99mTc relation: A99m-Tc(t) = 0,957.AMo(t=0) . (e-0,0105.t - e-0,1155.t ), where AMo(t=0) is the activity of 99Mo at time t=0 of the previous elution, time t is
in hours. The activity of the 99Mo with time T varies according to the laws and
decay AMo(T)
= AMo(0).e-lMo.T = AMo(0).e-0,0105.T. Substituting
this basic decomposition of molybdenum we obtain the resulting
relationship for the instantaneous activity of the eluted
99mTc at time T from the delivery
of the molybdenum generator and at time t since the last
elution :
A99m-Tc(T,t) = 0,957.AMo(0).e-0,0105.T
. (e-0,0105.t
- e-0,1155.t
) ,
where AMo(0)
is the activity of 99Mo at time T=0 of the generator supply, times t
and T are in hours. To determine the actually eluted 99mTc activity, we must
also take into account the elution efficiency,
which is usually approximately 75-85%. This time dynamics of
activity 99mTc during repeated elutions of the Mo-Tc generator is
plotted in Fig.2.1.B (d), which we present here again for clarity
:
Fig.2.1.B. Time dynamics of radioactivity in a mixture of two
radionuclides.
a) In a mixture of two independent radionuclides
X , Y , each of them is
converted according to its own half-life and the total activity
of the preparation is given by the sum of both exponential
functions.
b) , c) In the decay series of two
generically related radionuclides X -> Y, the decay dynamics
depends on the ratio of the half-lives of the primary parent
radionuclide X and the daughter, further decaying radionuclide Y; depending on this
relation lX and lY a transient or secular equilibrium of both
radionuclides can then be established.
d) Specific radioactive dynamics of the
radionuclide molybdenum-technetium generator during repeated
elutions of the daughter 99mTc, resulting from the conversion of the parent 99Mo.
After elution, the 99mTc activity in the generator drops to almost zero, then
rises and reaches a (local) maximum 23 hours after the previous
elution, after which a radioactive equilibrium occurs and the 99mTc activity
decreases exponentially with a half-life of 67 hours of 99Mo. After 23 hours
from the last elution, the elution yield of 99mTc is the highest; the generator can of course be eluted
as needed even in a shorter time, but with a lower yield of 99mTc.
These elution cycles
can be repeated many times until the activity of the parent
radionuclide falls below the usable value; for a Mo-Tc generator
with an initial activity of approx. 10-40 GBq it's about 7-15 days. The relatively long half-life
of the parent radionuclide allows for long-term use of the
generator, and the short half-life of the resulting daughter
radionuclide ensures a low radiation exposure to the patient.
Note:
In the past, have ben used sparadically also
generators of the extraction type (by passing the methyl
ethyl ketone through an aqueous solution of 99Mo, extracting pertechnetate 99Tc and separating it from the aqueous phase from the
parent molybdenum), and sublimation type (using the
difference between the volatility of molybdenum oxide and the
resulting technetium oxide). Due to their excessive complexity
and operational difficulties, they are no longer used, they have
been pushed out by elution generators.
Detailed decay scheme 99mTc
is in Fig.4.8.2. Default metastable level 142keV
isomerically passes first at the level of 140.5 keV, from where
it emits primary gamma rays of energy 140.5
keV. With a very small proportion of 0.02%, there is a
direct deexcitation to the ground state, in which energy of 142.7
keV is emitted. Photons of very soft gamma radiation of 2.17 kV
are practically not observed, as they are almost 100% subject to internal
conversion. The core of technetium 99Tc in the
ground state (after the isomeric transition
from 99mTc) is beta-radioactive
and with a very long half-life of 200,000 years it slowly
transforms into stable ruthenium 99Ru. In a very small
percentage, there is a direct beta-conversion of 99mTc
from a metastable level of 142keV to 99Ru (the ground state of the 99Tc nucleus is
"bypassed") - mainly to excited
levels of 322 and 90 keV 99Ru. Their deexcitation
produces g- radiation with energies of 322, 232 and 90 keV, but a
very small representation. At 99mTc radioactivity,
soft characteristic X-ray with energies of »2-3keV (L-series)
and »18-22keV
(K-series) are also emitted, as well as a larger number of
low-energy conversion and Auger electrons
(approx. 4 electrons/1conversion), mostly with energies »1.6-3 keV, smaller amounts »120-140 keV.
In the standard 99mTc scintillation spectrum
(on a scintillation spectrometer or gamma camera) we observe only
one significant photopeak of 140keV energy -
Fig.4.8.3 on the left (on a semiconductor
spectrometer we can also distinguish a weak line of 142.7keV) . Weak peaks from excited levels of 99Ru (arising from 99mTc by "bypass" 99Tc), especially 322keV, can be seen spectrometrically only
after filtering out a strong over-radiating line 140keV with a
layer of about 4-5mm lead - Fig.4.8.3 on the right in the passage
"Radionuclide purity".

Fig.4.8.2. Energy levels, radioactive transformations and beta
and gamma radiation 99m Tc.
Left: Formation of 99mTc by b- transformation of
99Mo. Right:
Detailed decay scheme 99mTc.
The energies of the individual nuclear levels are counted in the
left part of the figure from the ground state of 99Tc,
while in the right part they are determined from the ground state
of 99Ru.
The pertechnetate anions 99mTcO4- bind
relatively easily to a number of biologically important
substances (after possible previous
reduction of pertechnetate, eg with tin ions). 99mTc is able to create chelates with functional groups of
various organic substances and thus provide a wide range of
radioactive preparations differing in their kinetics in the
organism and uptake in individual organs.
Radioactively 99mTc-labeled radiopharmaceuticals
This produces technetium- labeled radiopharmaceuticals
that, after application to the body, are selectively
taken up in certain target tissues or organs, which can
then be imaged by a scintillation camera on the basis of external
detection of the outgoing g radiation. Technetium-labeled radiopharmaceuticals are
widely used in planar and SPECT, static and dynamic scintigraphy
of the kidneys, liver, lungs, heart, brain and other organs, as
well as in tumor diagnosis. We will briefly mention some of the
most commonly used 99mTc-radiopharmaceuticals :
In some applications, the eluate
alone in the chemical form of sodium pertechnetate Na 99mTcO4- will suffice. It is mainly scintigraphy of the
thyroid gland (because technetium ions behave similarly to
iodine ions), examination of Meckel's diverticulum, dynamic radiocardiography.
In other applications, 99mTc atoms chemically bind to complex biochemical
molecules.
For dynamic renal scintigraphy
(§4.9.2., "Dynamic
renal scintigraphy") is most frequently used 99mTc- MAG3 (merkapto
acetyl triglycine)
for diagnosing tubular function and renal drainage and DTPA
acid (diethylene triamino penta
acetid acid) for capture of glomerular filtration. For static
renal scintigraphy, it is then DMSA
(dimercaptosuccinate), which accumulates in the kidney in
proportion to the function of the relevant sites and remains
fixed there in the cortical zone in the cells of the proximal
renal tubules for several hours.
Iminodiacetic acid derivatives - 99mTc HIDA
(.......) or EHIDA (.........) are used for dynamic
liver scintigraphy
(cholescintigraphy - §4.9.3 "Dynamic liver scintigraphy"), which they are taken up
from the bloodstream by polygonal liver cells and further pass
through intrahepatic and then excretory bile ducts into the
duodenum.
For dynamic
radiocardiography examinations
(bolus radiocardiography and equilibrium gated ventriculography -
§4.9.4 "Radionuclide ventriculography", "Dynamic radiocardiography") uses
99mTc- labeled erythrocytes
(mostly labeled in vivo by Sn-pyrophosphate
premedication), which remain in the bloodstream for the duration
of the dynamic study.
For scintigraphy of tissue
perfusion and their viability are used 99mTc-
isonitrile complexes, which in the form of lipophilic
cations, passively penetrate the cell membrane, enter cells and
bind there to cytosolic proteins and in the mitochondria of
viable cells. The radiopharmaceutical accumulates, depending on
blood circulation, in healthy viable cells, while in cells
damaged (eg due to ischemia) or even dead and replaced by scar
fibrous tissue, no accumulation occurs. The distribution of the
radioindicator in the individual sites of the examined tissue is
then proportional to the regional blood flow and the viability
of the tissue cells. For scintigraphy myocardial
perfusion is most commonly used 99mTc-MIBI (methoxyisobutyl-isonitrile)
and 99mTc-Tetrofosmin
(§4.9.4 "Scintigraphy
myocardial perfusion"). The isonitrile radiopharmaceuticals are also used for
non-specific cancer diagnosis - show increased
accumulation in viable cells with a higher energy turnover (via
mitochondria). For brain perfusion scintigraphy
is used 99mTc-exametazime
HMPAO (hexamethylpropyleneamine
oxime) - §4.9.8 "Perfusion
scintigraphy brain".
For lung perfusion
scintigraphy, 99mTc-labeled macroaggregates MAA of serum
albumin are applied, the particles of which are trapped in the
capillaries of the pulmonary circulation, in proportion to the
blood supply to the individual parts of the lungs. For ventilatory
lung scintigraphy, an aerosol of a suitable
radiolabeled inert preparation (usually 99mTc-DTPA) is inhaled;
a better option is to inhale an inert radioactive gas (eg krypton
81mKr, see below).
For skeletal
scintigraphy, labeled phosphate complexes
(pyrophosphates and polyphosphates) are used, which are osteotropic
and bind to hydroxyapatite crystals; allow to view bone
reconstruction. The most commonly used is 99mTc-MDP (methylene diphosphonate) - §4.9.7 "Skeletal scintigraphy".
Other radionuclides
for g
scintigraphy
From other radionuclides for single photon (planar
and SPECT) scintigraphy can be briefly
named for example :
Thallium 201 Tl (as chloride) for scintigraphy of myocardial
perfusion, which as analog potassium enters myocyte
cross the cell membrane and accumulates there in proportion to
the blood flow at a given site of the heart muscle.
Galium 67 Ga - citrate for scintigraphy of tumors and
inflammatory foci.
Indium 111 In is also used for a similar purpose. Also in the form 111In labeled
antibodies for immunoscintigraphy, eg labeled somatostatin analog
111In-pentetreotide
(OCTREOSCAN) for the diagnosis of neuroendocrine tumors - §3.6,
section "Diagnosis of
cancer", passage "Molecular
gamma imaging".
For radionuclide cisternography
or perimyelography, intrathecal administration of 169
Yb -DTPA or more
preferably 111In-DTPA
is used.
Fig ... Decomposition scheme and gamma spectrum of indium 111In
For ventilation scintigraphy of the
lungs was previously used gaseous xenon 133Xe
(for complex dynamic scintigraphy), now radioactive gas 81mKr
krypton, obtained from the generator 81Rb (T1/2 = 4.85 hours) (EC) ® 81mKr (T1/2 =
13s). A stream of air, guided guided by a tube through a
container containing a layer of parent radionuclide 81Rb, carries away the
released daughter 81mKr, which the patient inhales, and a scintillation
camera uses external detection of radiation g to show the distribution of
this 81mKr
in the pulmonary alveoli - static ventilation
scintigraphy of the lungs. For more complex pulmonary
diagnostics, it is appropriate to combine perfusion and
ventilatory scintigraphy.
The principle of the 81Rb / 81mKr generator is in the left part of
figure. The parent rubidium 81Rb is fixed in the solid phase in a small column,
through which a stream of elution air is passed
by means of a fan (air pump with adjustable
power). By radioactive decay of rubidium-81, the continuously
released daughter gas krypton 81mKr is entrained by the passing air and led to the respiratory
mask, from which the patient inhales a mixture of air
and radioactive 81mKr. One-way valves are included in the circuit
of the breathing mask, and a mixing valve for outside
air is also connected to ensure free breathing. Exhaled air is
led to the extinction vessel (volume
approx. 30 liters), from which, due to the
very short half-life of 81mKr, practically non-radioactive air emerges.
During this examination of pulmonary
ventilation, inhaled air with a trace content of
radioactive 81mKr enters the pulmonary alveoli, while the
emitted radiation of 191keV gamma is scanned by a gamma
camera. The scintigraphic image of the site of reduced
activity shows areas of the lung with impaired
ventilation, where krypton-81m, and thus no air, does
not get (either at all or reduced) - see §4.9.5 "Lung scintigraphy
(nuclear pneumology)".
Generator 81 Rb / 81m Kr.
Left: Principle of generator operation.
Middle: One of the technical
arrangements of the Rb-Kr generator. Right:
Decay scheme 81Rb and 81mKr; in the black
field is the scintillation spectrum of gamma radiation 81mKr.
Radionuclides and radiopharmaceuticals for
PET
Of the more than 100 positron radionuclides, most are not
suitable for PET imaging - due to too short or long half-lives,
inappropriate radiochemical properties, low positron content and
high intensity of unwanted electron and hard gamma radiation.
Only a few b+ -radionuclides are
available for the medical use of positron emission
tomography, but in the chemical form of a number of
radiopharmaceuticals, enabling the study of various metabolic
processes in the organism. For diagnostic imaging by PET,
coincidence detection of g- photon pairs formed in the tissue during annihilation of
positrons from a radioindicator with the electrons in tissue is
used (described in detail above "Positron
emission tomography"). The following positron radionuclides are mainly used :
Radioisotopes gallium 68Ga
<-versus-> fluorine 18F
In current nuclear medicine, the radionuclides 18F
(by far the most) and 68Ga are
most often used for PET. What are the advantages and
disadvantages of these radionuclides in terms of use in positron
emission tomography?
Fluorine-18 as a
radionuclide has very good properties for PET: High yield of
positrons (97%) with relatively low energy (max. 633keV) and thus
short range in tissue (approx. 0.9mm) - excellent PET spatial
resolution. A cyclotron can produce very high 18F
activities of many gigaBq. Its half-life aprox. 2 hours enables
transport to nuclear medicine workplaces located approx. 200-300
km from the production cyclotron. In addition to the basic widely
used 18F-fluorodeoxyglucose FDG,
a number of other radiotracers (mentioned below) are available.
Until recently, however, it was not possible to effectively label
some peptides and monoclonal antibodies with fluorine-18.
Galium-68 has a slightly
smaller proportion of positrons (89%). The higher energy of the
emitted positrons (2900keV) leads to a greater range of the
positrons in the tissue (approx. 4mm), which results in poorer
spatial resolution - reduced ability to detect small and closely
spaced lesions. 68Ga has a
relatively short half-life of 68 minutes, which limits delayed
PET imaging in case slower radiotracer pharmacokinetics.
Transport to more distant PET workplaces is also problematic or
impossible. However, the possibility to obtain 68Ga
using a commercially available 68Ge/68Ga generator allows its application
in PET workplaces without a cyclotron. However, it is laborious
and expensive, and the amount of eluted 68Ga
activity is relatively small (for about 2-4 patients).
These
prevailing disadvantages of gallium-68 have led to
efforts to develop methods by which even those ligands that have
so far been labeled with 68Ga
(such as ligands for somatostatin neuroendocrine receptors and
especially prostatic anti PSMA) could be labeled with fluorine 18F. Significant successes have been
achieved especially with the prostate-specific tumor antigen
PSMA, where the existing 68Ga-PSMA-617
can be replaced by e.g. 18F-PSMA-1007
and other derivatives, including the theranostic 18F-rhPSMA-7
(cf. §4.9, section "Combination of diagnostics and
therapy - theragnostics", passage "Radiohybrid theranostic
radiopharmaceuticals").
Fluoro-deoxy-glucose 18 FDG
By far the most commonly used radiopharmaceutical for PET is
2-deoxy-2- 18F-D-glucose, abbreviated as fluoro-deoxy-glucose (18FDG). FDG metabolism
is somewhat different from normal glucose metabolism. Like
ordinary glucose, FDG has an affinity for cells with increased
metabolism (increased need for sugar - glucose), where
it gets through the appropriate transport proteins and is
subsequently phosphorylated. However, unlike true glucose, FDG is
no longer metabolized and therefore accumulates
in the cell. As a result, there is a markedly increased
accumulation of FDG in the tumor cells, so that the
tumor foci appear with high contrast to tissue
and blood background. Oncological diagnostics
therefore makes up more than 90% of all PET examinations (§3.6, section "Diagnosis
of cancer"). 18FDG is also used to examine the myocardium,
where myocardial viability can be assessed based on FDG
consumption.
Glucose
it gets from the extracellular space into the cells by passive
transport through transmembrane proteins - glucose transporters.
Upon entering the cell, glucose is phosphorylated by gluokinase
to glucose-6-phosphate (analogous to FDG-6-phosphate). Normal
glucose can then be converted to glycogen or metabolized to water
and carbon dioxide. However, this metabolism does not occur in
FDG, so FDG is "trapped" and tends to accumulate
in cells. For FDG, the only way is to be excreted back from the
cell - through glucose-6-phosphatase. In cells containing low
glucose-6-phosphatase, the concentration of FDG is proportional
to glucose consumption. In contrast, in tissues that contain a
lot of glucose-6-phosphatase, the accumulation of FDG is lower
than that corresponding to glucose metabolism. Dephosphorylation
by glucose-6-phosphatase is generally very slow, so that the
concentration of FDG-6-phosphate in the tissues is kept stable
for several hours.
After radioactive decay, 18F produces
non-radioactive oxygen 18O and FDG-6-phosphate produces ODG-6-phosphate, which
then undergoes cellular glycolysis as normal glucose.
Unmetabolized 18FDG is removed by glomerular filtration in the kidneys
and is excreted in the urinary tract (with
an excretion half-life of about 2 hours).
18FDG was first used in non-tumor diagnostics to visualize
local glucose metabolism in the brain and myocardial glucose
metabolism. However, it now has a major application in oncology
as a radioindicator for imaging the increased metabolic activity
of tumor tissues. Conversely, it is not suitable for the
diagnosis of brain tumors. And it is also not suitable for the
diagnosis of prostate cancer - due to the relatively slow
metabolism of these tumor cells and the proximity of the bladder
with a significantly higher content of FDG.
18F
Sodium -fluoride (NaF)
is used for PET scintigraphy of the skeleton. PET shows areas in
the bones with osteoblastic and osteoclastic changes that may be
related to tumor remodeling, but also to benign skeletal changes.
The advantage of Na 18F is high (up to 50% of the
applied activity) and rapid absorption in
the bones, together with the rapid degradation of unbound
radioindicator in the blood. This leads to the acquisition of
contrast images in a short time (less than 1 hour after iv
application).
NaF
is an ionic compound of Na+ and F- ions. After iv application, NaF is delivered to the
bones and fluoride ions diffuse through the blood capillaries
into the extracellular fluid. 18F-ions are exchanged for OH-ions of hydroxyapatite
Ca10(PO4)6(OH)2 to form fluoroapatite. Subsequently, the installation 18F-ions into the
crystalline structure of hydroxyapatite in bone occur. Increased
uptake of 18F-fluoride occurs in malignant bone lesions due to
increased blood supply, increased permeability of capillary
walls, and faster bone remodeling. The advantage of Na 18F
is that virtually all 18F-fluoride that is transported to the bones by the blood
is trapped in them and, conversely, binding to serum proteins is
minimal. This leads to the rapid degradation of the unbound
preparation from the circulation and the acquisition of
"pure" contrasting skeletal images in a short time.
Special
radiopharmaceuticals for "molecular imaging" *)
With the development of organic chemistry,
biochemistry and cell biology, some radiopharmaceuticals have
been developed whose labeled molecules have affinity for very
specific cell types or processes at the subcellular level. With
the help of scintigraphy and a suitable radiopharmaceutical, it
is possible to purposefully examine not only the function of a
certain organ or tissue, but also to selectively investigate a
certain type of metabolic or transport pathway, such as enzyme or
receptor binding or antigen-antibody reactions. For this purpose,
special radiopharmaceuticals (both for diagnostics and for
therapy) have been developed and are still being developed, which
are characterized by their effects at the molecular level.
With a bit of exaggeration, these methods of local measurement
and imaging of the physiological response are referred to as
"in vivo biochemistry".
*) Name "molecular imaging"does
not, of course, mean that we perhaps visualize the molecules
themselves (unfortunately we can't do that...), but we visualize
the distribution of radioindicators that is the result and
reflection of specific biochemical reactions at
the molecular level.
For oncological diagnostics it is
important imaging of viable and proliferating
tumor cells and tissues - §3.6, section "Diagnosis of cancer". In addition to the above-mentioned and most
commonly used fluoro-deoxy-glucose
18FDG,
there are some other tumor radiopharmaceuticals :
18 FLT ( 18F-3-fluoro-3-deoxy-thymidine)
is a radiolabeled form of a pirimidine nucleoside. It accumulates
significantly in proliferating cells - it shows
the activity of the enzyme thymidine kinase, which
characterizes the intensity of cell division. Because a
substantial increase in the rate of mitosis and cell
proliferation is a hallmark of malignant tumor tissue, 18FLT functions as a tumor-specific
PET radioindicator. It usually provides more contrasting
images of proliferating tumor lesions than 18FDG. It is particularly suitable for monitoring the response
of malignant tumors to therapy. Chemotherapy and
radiotherapy often cause an inflammatory reaction in the tumor
and around the tissue, which significantly increases the
accumulation of 18FDG, making it very difficult to assess the regression
or progression of the treated tumor; therefore, 18FDG is not a
completely ideal radioindicator for the response of malignant
tumors to treatment, 18FLT is more suitable.
Thymidine
is essential for replication in dividing cells. After passage of
thymidine through the cell membrane, it is phosphorylated, which
is catalyzed by the cytosolic isoenzyme thymidine kinase-1
(TK1), and subsequently incorporated into DNA (during the DNA
synthesis phase of cell cycle). However, incorporating fluorine
to the 3' position in thymidine prevents FLT from further
incorporating it into DNA. FLT monophosphate is not incorporated
into DNA and the cell membrane is impermeable to it - it is
therefore metabolically "trapped" inside the cells. PET
display 18FLT
detects the enzymatic activity of TK1, tracing the recovery of
nucleosides from degraded DNA. The uptake and accumulation of 18FLT thus corresponds
to the rate of cell proliferation. 18FLT serves as an indicator of changes in tumor
cell growth. 11C-thymidine was used for a similar purpose.
18
F-fluorocholine (18 FCH)
is a fluorine-18-labeled analogue of choline, the basic
building block of cell phospholipid membranes. It is
used to visualize phospholipid metabolism in tumors. It shows
increased uptake in tumors of the brain, prostate, breast, lung,
esophagus.
Choline is
an important component of phospholipids in cell membranes.
Choline is phosphorylated to phosphorylcholine by choline kinase
inside cells and, after several other biosynthetic processes, is
eventually incorporated into phospholipids. 18Flurocholine behaves in the same way. Cells with high
metabolism also have increased choline uptake due to higher
requirements for phospholipid synthesis in their cell membranes. 11C-choline is
sometimes used for positron emission tomography, but its
disadvantage is the short half-life of 11C (20 min.).
18
F-fluciclovin is used for scintigraphic PET diagnosis of
prostate tumors, especially in recurrent disease.
Fluciclovin
is an analog of the amino acid L-leucine, which is here labeled
by 18F. It
accumulates in the tumor via amino acid transporters. An increase
in transmembrane amino acid transport occurs in the prostate due
to increased metabolism of amino acids for energy and protein
synthesis. Unlike the natural amino acids, fluciclovin it is not
metabolized and accumulates in tumor cells - a positive
PET image of the tumor.
18
FET (18 F-O- (2-fluoroethyl) -L-tyrosine)
is an analog of the amino acid tyrosine to which an 18F- labeled ethyl
group is attached via an oxygen atom. It shows the accumulation
of amino acids in cells. It is suitable for imaging brain tumors
glyoms, their extent, to detect recurrence after therapy and
its differentiation from necrosis.
Tyrosine is one of
the building blocks of protein. Increased uptake into cells is
due to the higher content of L-type amino acid transporters.
However, the fluorinated FET analogue, unlike tyrosine, does not
enter protein metabolism. Therefore, 18FET accumulates in cells and maps the increased amino
acid consumption due to increased protein metabolism in tumor
cells. 18FET
(unlike 18FDG or 11C-MET) is not absorbed in
macrophages and allows tumor tissue to be distinguished from
inflammatory tissue.
Other labeled amino acids are
sometimes used to diagnose brain tumors: 11C-methyl-L-methionine (11C-MET), 3-123I-iodo- and methyl-L-thyrosine (123I-IMT), two other L-tyrosine analogues L-11C- tyrosine and 2- 18F-fluoro-L-tyrosine.
All these substances have similar properties.
18
F-FMISO ( 18 F-fluoromisonidazole) and 18 F-FETNIM ( 18F-fluoroerythronitroimidazole)
are radioindicators depicting cellular hypoxia, which is
important for tumor angiogenesis and for planning radiotherapy
(radiosensitivity, oxygen effect - see §3.6, section "Physical and radiobiological factors of
radiotherapy").
Nitromidazoles
passively diffuse through the cell membrane into
the cytoplasm, where they are reduced by intracellular
nitroreductases. The resulting nitro-radical R-NO can be further
reduced to R-NH 2, which as a strong alkylating agent reacts with
macromolecules - with DNA, RNA, with proteins. However, in cells
with sufficient oxygen, the reduced nitromidazole is rapidly (re)
oxidized and removed outside, further reactions no longer
proceed, and the reaction products do not accumulate there. In
cells with low oxygen content, however, the above sequence of
reduction reactions occurs to form more stable covalent bonds
with biomolecules whose rate is inversely proportional to the
intrrecellular oxygen concentration. 18F-labeled nitromidazole
derivatives are thus "trapped" in hypoxic tissue cells.
This accumulation of 18FMISO
occurs only in cells with active nitroreductases, so that the
accumulation of the radiolabel occurs only in living hypoxic
cells, not in necrotic ones.
Another PET radiopharmaceutical for
hypoxia imaging is 64Cu-ATSM
(acetyl-methyl-thiosemicarbazone).
18F-Florbetaben,
18F-Flutemetamol, 18F-Florbetapir
are 18F-labeled
polyethylene glycol stilbene derivatives with high
specific affinity for beta-amyloid plaques.
It is used for scintigraphic visualization of amyloidosis
especially in Alzheimer's disease in the brain, it can also be
used in myocardial amyloidosis.
Immunoscintigraphy
An important methodology for "molecular imaging" is immunoscintigraphy,
based on the highly specific nature of antigen-antibody
immunological reactions. The antibody, labeled with the
appropriate radionuclide (99mTc, 18F, 68Ga, 111In, 131I, 123I), selectively binds to the appropriate tumor
marker (antigen) after administration, after which we
can locate the relevant tumor by external detection of gamma
radiation using a gamma camera. The required antibodies are
either of human origin or are obtained from the serum of
immunized animals by the method of so-called lymphocyte
hybridization, which allows the preparation of a homogeneous
so-called monoclonal antibody - §3.6, passage
"Monoclonal
antibodies". They are
used mainly in tumor diagnosis, but also, for
example, in the diagnosis of inflammatory foci
using antigranulocyte monoclonal antibodies such as 99mTc-sulesomab and 99mTc-besilesomab (§4.9.6 "Scintigraphy
of inflammatory foci").
Neuro-endocrine tumors
For gamma imaging of neuro-endocrine tumors
(including pancreatic), radioindicators that bind to somatostatin
receptors are suitable. For example, 68Ga-DOTATOC
is used (11C-5-hydroxy-tryptophan (5-HTP) was also tested). This diagnostics can also be used to assess (predict)
subsequent radionuclide therapy using 90Y- or 177Lu-DOTA radiopharmaceuticals - teranostics
(discussed in §4.9, section "Combination
of diagnostics and therapy - teranostics").
Recently,
bombesin-based gastrin-releasing peptide (GRP) receptors, labeled
with e.g.18F,
have been tested for tumor dignostics. Bombesin
*) is a peptide composed of 14 amino acids. It is formed in the
small intestine and antrum, has a stimulating effect on the
pancreatic and gastric mucosa. It is a potent antagonist of the
neurotransmitter gastrin releasing peptide (GRP). It has
been shown that it can be expressed by several cancer cell lines,
where it can endocrine stimulate the growth of tumor cells via
bombesin receptors on the membranes of these cells. Thus,
bombesin may be a tumor marker for prostate, lung,
gastric, neuroblastoma and others.
*) The somewhat bizarre name "bombesin"
originated at the discovery of this substance, which was first
isolated from the skin of a frog fire-bellied toad
(Latin Bombina bombina).
Prostatic tumors
Prostate- specific membrane antigen PSMA
appears to be very promising for imaging and therapy of prostate
cancer. Radiolabeled small molecules of PSMA
inhibitors bind with high affinity to prostate tumor
cells (which highly express PSMA), allowing scintigraphic imaging of these lesions as
well as their radionuclide therapy - depending on the
radionuclide used. For scintigraphic imaging
planar and SPECT can be used 99mTc-MIP-1404, for PET imaging of 18F-DCFBC or 68Ga-HBED-PSMA, recently 68Ga-PSMA-11. However, 18F-PSMA
(18F-PSMA-1007)
is best suited for PET scintigraphy of prostate tumors.
131I-MIP-1095 has been tried for targeted radionuclide therapy
of the prostate, but 177Lu-J591 and more recently 177Lu- or 225Ac-PSMA-617 have proven to be the
best so far.
In addition to diagnostics, the
possibilities of therapeutic use of monoclonal antibodies
as carriers of suitable radionuclides beta or alpha with
radiotherapeutic effect, or suitable chemotherapeutic agents, are
also being developed. The use of monoclonal antibodies
(non-radioisotope) in chemotherapy (biological treatment) of
cancer is discussed in §3.6, section "Therapy
of cancer", in
radionuclide therapy in the section "Radioimmunotherapy".
Labeled cytostatics
Methods for radioactive labeling of various
types of cytostatics have been developed for monitoring
and prediction of chemotherapy of cancer (cytostatics
are discussed in more detail in §3.6, section "Therapy of cancer"). The diagnostic
application of such radiopharmaceuticals makes it possible to
show where these cytostatics are taken up and to what extent they
penetrate into tumor foci. In this way, the relevant cytostatics
will be captured even during the chemotherapy itself - according
to which the effectiveness of the treatment ("theranostics")
can be inferred.
One such radiolabeled cytostatic is 18F-paclitaxel
(currently being tested in preclinical studies). For preliminary
mapping of the distribution of some cytostatics, the 99mTc-MIBI,
which has similar cell uptake kinetics to doxorubicin
and cisplatin, can also be used.
Apoptotic
radiopharmaceuticals
A new interesting group are
radiopharmaceuticals for imaging cellular apoptosis.
These are organic molecules (either proteins or relatively small
molecules) labeled with a suitable radionuclide (eg 99mTc, 18F), which have an
affinity for cells that are in the early stage of apoptosis (programmed cell death - see §5.2 "Biological effects ionizing radiation", passage "Mechanisms of cell death"). Proteins bind to their
surface (to phospholipids exposed on the surface of apoptotic
cells), small molecules penetrate the cell membrane and
accumulate in the cytoplasm. The result is selective accumulation
of radioindicator in apoptotic cells and tissues. By gammagraphic
imaging of the distribution of these radioindicators, we obtain
positive images of those places where apoptosis occurs most
intensively - whether due to irradiation, cytotoxic agents or
ischemia.
By molecular imaging of the
distribution of cell apoptosis, we can monitor
the very early response of cells and tissues to
therapy (radiotherapy or chemotherapy), already at the beginning
and during therapy - see §3.6, section "Diagnosis of cancer". They can also be used to image ischemic foci
in heart or cerebral infarction. Two types of such
radiopharmaceuticals have been successfully tested in clinical
practice for imaging apoptosis (the third
is in the laboratory stage) :
- 99mTc-annexin V - is a protein that binds
to phospholipids exsposed on the surface of cells undergoing
apoptosis. Annexin V is obtained from the placenta and is labeled
with technetium via hydrazino nicotinamide: 99mTc-6-hydrazinonicotin (HYNIC) -annexin V. For similar properties is tested 99mTc-Duramycin ;
- 18F-ML-10
[2- (5-Fluoro pentyl) -2-methyl malonic acid] - penetrates the
depolarized cell membrane and accumulates in the cytoplasm of
apoptotic cells;
- Peptide
18F-CP18
[pentapeptide containing triazole] - maps Caspase-3 activity,
accumulates in apoptotic cells.
Radionuclides
for therapy in nuclear medicine (methodological note)
Open radionuclide therapy
is also organizationally integrated into the field of nuclear
medicine (the main method of which is the scintigraphy
discussed here). However, from our physical point of view, as
well as from the point of view of the mechanism of action and
purpose of use, we have included this radioinuclide therapy in
§3.6 "Radiotherapy", part "Radioisotope therapy with open emitters". This is also where we find radionuclides used in
nuclear medicine for therapeutic purposes.
Preparation of radiopharmaceuticals
As mentioned above, radiopharmaceuticals are composed of two
basic constituents: a radionuclide emitting
ionizing radiation and a carrier to which it is
bound and which brings it to the required target in the body - to
certain cells, target tissues and organs. For the preparation of
radiopharmaceuticals - radioisotope labeling -
three basic radiochemical methods are used :
× Isotope exchange reaction ,
wherein a certain stable isotope in the carrier compound is
chemically replaced (exchanged, "displaced") by its
radioactive isotope added to the reaction mixture. The resulting
labeled substance has the same chemical and biological properties
as the starting substance, because its molecules are chemically
identical to the original molecules.
× Chemical synthesis ,
in which radioactive atoms are chemically incorporated into the
appropriate site in the carrier molecule, most often by means of
a coordination covalent bond, in such a way that the resulting complex
compound has the desired properties. For this labeling,
so-called chelates (such as EDTA,
DTPA) are often used, which by one part
binds to the carrier molecule and their other part binds the
radionuclide atom.
× Biochemical synthesis
uses enzymes and microorganisms. The radionuclide, added to the
culture medium, enters metabolic processes in living
microorganisms and then incorporates them into their respective
metabolites.
In terms of organization of
preparation, we can divide radiopharmaceuticals into two groups :
¨ Finished
radiopharmaceuticals - mass production,
produced and radiolabeled in the manufacturer's radiochemical
laboratory, delivered to nuclear medicine departments
(appropriate activity and volume) and ready for direct
application to patients. In this way, radiopharmaceuticals
labeled with radionuclides with a longer half-life (> approx.
2 days) are supplied. These are, for example,
radiopharmaceuticals labeled with iodine 131I and 123I, then 111In, 201Tl, 67Ga, 169Yb, recently also short-term 18F and others.
¨ Radiopharmaceuticals
prepared at the workplace - individual preparation.
The required biochemical substance - carrier - is marked
with the necessary radionuclide at the nuclear medicine
workplace, in the laboratory of radiopharmaceuticals (preparation
"magistraliter"). In this way, mainly
radiopharmaceuticals labeled with short-lived radionuclides are
prepared, mainly technetium 99mTc from a generator, sometimes also 18F. The actual
synthesis was previously performed using basic chemicals, now the
kits are used (kit =
set of tools, building parts) - a
compact set of non-radioactive ingredients supplied by the
pharmaceutical manufacturer, to which only the solution of the
radionuclide itself is added and the corresponding labeling
reaction already takes place automatically.
In nuclear medicine workplaces, the radiopharmaceutical
laboratory deals with the preparation and filling of
radiopharmaceuticals for their application. It is usually
performed in special boxes or fume hoods
equipped with air conditioning, ensuring laminar air
flow. Current requirements for air cleanliness (often exaggerated! - see below) *)
lead to very complex and expensive air conditioning systems. New
alternative solution, providing (without
hood and air conditioning) sterility of
radiopharmaceuticals and radiation protection of workers, are compact
automatic devices for computer-controlled
filling of radiopharmaceuticals, sometimes supplemented
by the possibility of automatic application of the prepared
solution of the radiopharmaceutical to the patient. They are
mainly used in PET for 18FDG.
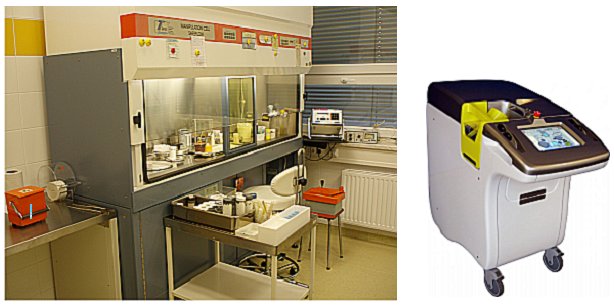
Preparation and filling (dosing) of radiopharmaceuticals at the
workplace of nuclear medicine.
Left: Laminar hood for elution of Mo/Tc
generator, preparation and dosages of radiopharmaceuticals at the
Department of Nuclear Medicine, University Hospital Ostrava.
Right: Compact device for
automatic computer-controlled dilution and dosage of
radiopharmaceuticals.
*) Author's note
- exaggerated
requirements for the preparation of radiopharmaceuticals in
nuclear medicine workplaces
From the point of view of my long-term work in the field of
nuclear medicine, I would like to make a small critical
comment on current standards and regulations for the
preparation and filling (division, dossage) of
radiopharmaceuticals in nuclear medicine workplaces. Until the
1990s, the actual laboratory radiochemical preparation of
radiopharmaceuticals was carried out at workplaces, in
which the compounds prepared in the laboratory of
radiopharmaceuticals by chemical procedures (in test tubes,
beakers, penicillins) were labeled with the given radionuclide. This was done in conventional chemical fume hoods with
possible lead shielding (sometimes with air
extraction, other times not...), located in
standard laboratory rooms. Following the principles of good
laboratory practice, there have never been any
problems with the sterility of the resulting
radiopharmaceuticals ("nothing has
ever happened to any patient ").
Since the 1990s, kits (significantly facilitating
preparation) and already done radiopharmaceuticals have
been used more and more, that come sterile and are only filled
and dosing into workplaces for administration to patients.
And at this time, paradoxically, the
requirements for the sterility of the environment
began to appear and continue to tighten, in which these already
significantly simpler manipulations are performed..!.. This leads
to enormous investment and operating costs, which in my opinion
virtually useless (throwing
hundreds of thousands even millions!)...
The core of misunderstanding here is the confusion
of minor "magistraliter" preparation in the workplace
(or even just filling), to which officials try to mechanically
transfer the demanding requirements, standards and
regulations from the mass production of drugs in
pharmaceutical plants (where these strict standards are, of
course, justified). A doctor in an internal infirmary when
drawing up a sterile injection preparation from an ampoule or
penicillin into a syringe for i.v. administration, also does not
work in an aseptic environment of class "A" (it would be nonsense)..!..
Furthermore, narrow-minded standards and
regulations regarding "registration"
are a serious limiting factor in the introduction of new
promising radiopharmaceuticals, already proven in
research laboratories. This leads to the lagging behind
of the field of nuclear medicine, at the expense
of more advanced diagnostics and therapy of patients.
After all, we
encounter similar bureaucratic approaches in the field of radiation
protection (cf. §5.8, concluding note "Bureaucratic requirements of radiation
protection").
Methods of
administration of radiopharmaceuticals
In terms of application form, three types of radiopharmaceuticals
are used :
- Parenteral radiopharmaceuticals
administered most often intravenously, sometimes
subcutaneously or intralubally. They are mostly
aqueous solutions, dispersions, colloids, suspensions. There are
high demands on sterile and apyrogenicity.
- Oral radiopharmaceuticals can be in the
form of solutions or solids. The most common are solutions or
capsules of radioiodine given during thyroid therapy, or liquid
or solid bites swallowed during examination of the esophagus and
evacuation of the stomach.
- Inhaled radiopharmaceuticals are
primarily radioactive gases (such as krypton 81mKr) or gaseous dispersions
of labeled radiopharmaceuticals (eg 99mTc DTPA) produced in nebulizers, inhaled
together with air during examination of pulmonary
ventilation.
Quality and purity of
radiopharmaceuticals
The properties of the
radiopharmaceutical used primarily affect scintigraphic
diagnostics; unsuitable, poor quality or contaminated
radioindicator can lead to inaccurate or erroneous diagnosis,
ineffective radionuclide therapy, or it can also have undesirable
side effects for the patient. From our physical and
methodological point of view, the purity of the
radiopharmaceutical is an important property, which can be
divided into two categories :
v Radionuclide
purity
Nuclear reactions, which produce their own
radionuclides (see §1.3 "Nuclear reactions and nuclear energy", part "Types of nuclear reactions"
and §1.4, part "Production
artificial radionuclides")
used for labeling radiopharmaceuticals,
usually take place in various ways and, in
addition to the desired radionuclide, can lead to the formation
of other radionuclides (the same element or
another element). The amount of these radionuclide impurities
depends on the target used, the type and energy of the
irradiating particles and subsequently also on the method of separation
and isolation of the given radionuclide.
There are three basic sources of
radionuclide impurities (+ one special for radionuclide
generators) :
1. Target material
can never be prepared in 100% "mononuclide" purity of
the desired target nuclide. Traces of other isotopes of a given
element, or even other elements, are always present. Nuclear
reactions can then produce radionuclides other than the desired
ones in the target from these impurities.
2. Different nuclear
reactions - even with
the same nuclide composition of the target, nuclear reactions can
take place through different "channels" with different
probabilities. When irradiated with neutrons, these are most
often reactions (n, g), but they can also occur (n, p) or (n, d), etc., when
proton irradiated, then reactions (p, g), (p, n), (p, d) and the
like; it essentially depends on energy. Even in a completely pure
target, a mixture of different radionuclides can be formed.
3. Radiochemical
separation of a mixture
of radionuclides formed by nuclear reactions during irradiation
is a technologically difficult process, which may not succeed
with 100% efficiency. Trace amounts of other radionuclides - radionuclide
impurities - may thus be present in the final product.
4.
For generator radionuclides, the radionuclide impurity can enter the desired
daughter radionuclide in two ways :
¨ From
the radionuclide impurities contained in the parent radionuclide.
¨ Traces
of the parent radionuclide may also be released
into the daughter radionuclide. E.g. in the Mo-Tc generator a
small amount of parent 99Mo can penetrate into the 99mTc eluate, or in the Ge/Ga generator, a small amount of
parent 68Ge
may be released into the 68Ga daughter eluate.
Radionuclide purity
is the share of radioactivity of the required (declared)
radionuclide in the total activity of the preparation. Usually,
however, the opposite value is given - the content of
radionuclide impurities - contaminants; it is mostly
expressed as a percentage. The permissible content of
radionuclide impurities is specified for each radioindicator in
the relevant standard for its preparation (eg
for the 99mTc
eluate, radionuclide impurities must not exceed 0.1%).
Measurement of radionuclide impurities
Accurate determination of the content of radionuclide impurities
is performed by spectrometric measurement of
radiation g using a scintillation NaI(Tl) or
semiconductor Ge(Li)/HPGe detector connected to a multichannel
analyzer. It is not easy to measure the very low (trace)
radioactivity of a contaminant in the background by many orders
of magnitude higher activity of the basic radionuclide - the weak
radiation of the contaminant is completely
"over-radiated" by the radiation of the basic
radionuclide. We have a chance to measure the radionuclide purity
in basically two situations :
1. A
high-energy contaminant
that emits gamma radiation with a significantly higher energy
than the basic radionuclide. In this case, the method of filtration
with a shielding absorbent insert can
advantageously be used for the separate detection of the
contaminant: place the vial with the examined preparation in a
lead shield of suitable thickness (approx. 2-5 mm), which almost
completely absorbs the intense low-energy radiation g of the basic radionuclide,
but transmits a considerable part of the weak but high-energy g -contaminant
radiation.
2. Long-term
contaminant
with a half-life several times longer than that of the basic
radionuclide. If we measure such a preparation with an interval
of 10 or more half-lives of the basic radionuclide, we obtain the
activity or spectrum of the contaminant, which is no longer
over-radiated by strong radiation of the basic radionuclide. This
method has the disadvantage that it is an "ex post"
measurement long after the preparation and use of the
radiophamaceuticals. In some cases, however, there is no other
option...
A typical example of high energy contamination is the 99mTc eluate (Eg = 140keV), which
may be contaminated with maternal 99Mo with a significant Eg = 740keV line. To shield
strong 140keV radiation, we use a small lead container with a
wall thickness of » 4-5mm; the transmitted 740keV radiation can already be
measured with a scintillation detector, without the risk of being
flooded by powerful primary radiation 99mTc, which is absorbed by Pb-shielding. For quantitative
determination, it is of course necessary to have the detector
pre-calibrated with a 99Mo standard for a given shielding and geometric
configuration . The contaminant activity measured in this way is
then divided by the total activity of 99mTc and we obtain a radionuclide impurity content of 99Mo.
In Fig.4.8.3 in the left part there is a
standard scintillation spectrum of 99mTc (a bottle with an activity of approx. 10kBq attached
directly to the scintillation detector). Only a distinctive
140keV photopeak is displayed. In the right part of the picture
there is a bottle with 1GBq of 99mTc eluate placed in a lead container with a wall
thickness of 5mm. In addition to the residual (lead highly
attenuated) peak 140keV on the spectrum, we see a peak of
characteristic X-rays of lead around 80keV and of higher energies
"climbed out" the two weaker peaks :
- 322keV comes from deexcitation of
excited levels of ruthenium of 99Ru, to which a slight proportion of the beta
-radioactivity breaks down the metastable level of 142keV 99mTc (see decay
diagram in the previous Fig.4.8.2 on the right).
- 740keV comes from trace contamination
of the eluate by mother molybdenum 99Mo (cf. previous Fig.4.8.2 on the
left). It is from the intensity of this peak that the radionuclide
purity of the 99mTc eluate is determined spectrometrically.
The same measurements on a semiconductor detector are at the
bottom of the image.
Fig.4.8.3. Spectrometric measurement of the radionuclide purity
of the 99mTc
eluate (top - scintillation spectrum, bottom
- semiconductor spectrum).
Left: Basic gamma radiation spectrum 99m Tc. Right:
The spectrum of gamma radiation measured through the shielding
layer of a 5mm lead container.
However, for a simplified measurement of the
radionuclide purity of the 99mTc eluate, a conventional activity meter
with an ionization chamber, equipped with a suitable shielding
insert (and calibration), is used in most workplaces.
However, due to the low sensitivity of these meters, we can
determine up to radionuclide impurities of 99Mo exceeding hundreds of kBq (for Tc-eluates with an
activity of tens of GBq, however, the sensitivity is sufficient
to check compliance with the standard). It is sufficient to
measure the radionuclide purity of the 99mTc eluate only for the 1st elution from
the given generator, where the risk of potential contamination by
99Mo is
the highest; if the result is satisfactory, it will almost
certainly apply even more to further elutions.
v Radiochemical
purity
Even chemical reactions by which
radiopharmaceuticals are prepared by labeling
with the required radionuclide do not proceed in 100% yield.
Therefore, in the resulting preparations, in addition to the effective
radioactive substance itself, there is always a small
amount of unbound activity and possibly other
compounds of radioactive substances that do not carry a
diagnostic or therapeutic effect and may be disruptive
or cause undesired radiation exposure in non-target tissues. Radiochemical
purity is the share of the declared chemical compound of
a given radionuclide in the total activity of the preparation.
Chromatographic methods (mostly on paper or on a thin layer) are most often used to control the radiochemical purity
of prepared radiopharmaceuticals - §2.7, passage "RadioChromatography", sometimes also electrophoresis
- see the same §2.7, passage "RadioElectrophoresis".
Only a certain part of the molecules
of a biological substance is marked by a radionuclide - we are
talking about a radioactive substance with a carrier;
the so-called carrier-free radioactive substance, where
the radionuclide is contained in all molecules of the substance,
is difficult to prepare and is used only for special purposes.
Application of
radiopharmaceuticals
For their own use in nuclear medicine (diagnostic or
therapeutic), radiopharmaceuticals are administered
to the body, most often intravenously, or orally or by inhalation
(as mentioned above). For each type of scintigraphic examination,
a certain optimal amount of a given
radiopharmaceutical is recomended, expressed in units of activity
*) [MBq] of the radionuclide bound in the radiopharmaceutical -
with normalization to body proportions, usually the patient's
weight.
*) Radiopharmaceuticals cannot be dosed
according to their weight [mg] - the weight of the "active
substance", as is usual for drugs. The weights of applied
radiopharmaceuticals are immeasurably small (often even on the
verge of chemical provability). This is due to the high specific
activity of the radionuclides used with a short half-life. The
only way to dose radiopharmaceuticals is through the applied
activity in [MBq]. The activity of the
radiopharmaceutical for application is measured in a
metrologically calibrated activity meter (§2.3, section "Well ionization activity meters"). Guideline values of the
recommended applied activity for various types of
radiopharmaceuticals are given in the table in §5.7 "Radiation exposure during radiation diagnosis and
therapy", passage "Radiation
dose to patients from radionuclide examinations".
Other features of
radiopharmaceuticals, such as sterility, apyrogenicity,
content of excipients and other non-radioactive components, as
well as details for the preparation of specific
radiopharmaceuticals, are important for medical use, but their
discussions, however, are beyond the scope of our physically and
methodically conceived treatise ...
4.9.
Clinical scintigraphic diagnostics in nuclear medicine
4.9.0.
Common general principles of clinical scintigraphy
General ideas of scintigraphic diagnostics were presented at the
beginning of §4.1 (section "Role and definition of
scintigraphy; nuclear medicine"). In the next text of
chapter 4, the physical principles of gamma imaging,
physical-electronic implementation of various scintigraphic
methods and computer processing of scintigraphic data were
discussed in detail. Here we will supplement this physical part
with some specific clinical applications. But
first we will make a few general remarks :
The human organism (as well as the organisms of all higher animals) is a very complex system both in its anatomical
structure and, above all, in the diversity of its internal
functions and metabolism. Imaging methods
provide some valuable ways to "look" inside this
complex system. Their basic output result is generally a brightness
modulated image: the brightness of each element of the
image is determined by the physical or chemical characteristics
of the corresponding site in the tissue. In X-ray imaging,
it is the absorption coefficient given by the density,
thickness and composition of the tissue. For sonography,
the acoustic impedance is displayed given the density,
elasticity and dissipation viscosity of the tissue. Nuclear magnetic
resonance displays the density of resonant nuclei
(especially hydrogen) and relaxation parameters
dependent on the binding of atoms in the tissue. Scintigraphy
displays the distribution of a radioindicator, showing
the movement of the radiopharmaceutical and its biochemical
uptake, rearrangement and excretion due to local metabolic and
functional processes (at the
"molecular" level).
Most imaging modalities - X-ray
diagnostics, magnetic resonance, sonography - provide images of
the anatomical structure of tissues and organs -
their size and shape, placement, density inhomogeneities.
Scintigraphic imaging (planar, SPECT, PET), on the other hand,
has a fundamentally functional character. They
do not show any "real-palpable" objects, no morphology,
but capture the distribution - passage,
accumulation, excretion - of specific radiolabeled substances.
The degree of local accumulation of the radioindicator depends on
the intensity of local metabolic and functional processes, which
is reflected in the luminance modulation of the corresponding
sites (pixels) of the scintigraphic image. If the
radiopharmaceutical enters the examined tissue through the
bloodstream, not only the function but also the degree of blood
supply - perfusion of this tissue or organ can
be assessed from the rate of uptake of the radioindicator (§4.9.4, part "Scintigraphy of myocardial perfusion" and §4.9.8, part "Perfusion brain scintigraphy").
Functional imaging of the
distribution of the radioindicator in the relevant tissues,
organs and lesions then serves primarily for diagnostic
purposes, but can also be an important starting point for
radiotherapy, in nuclear medicine for biologically
targeted radionuclide therapy :
Fig.4.9.1 Scintigraphic diagnostics and
radionuclide therapy in nuclear medicine
Static scintigraphy
Static scintigraphic images capturing radiolabel uptake are
usually evaluated visually, but semi-quantitative
assessments can also be performed using radiotracer accumulation
ratios in relevant areas of interest (ROI) or tissue background.
This results in certain relative numerical values - indices
*). A series of scintigraphic images is evaluated both visually
and quantitatively using computational algorithms (see below "Radiopharmaceutical uptake"
and "Dynamic scintigraphy").
*) Some software also allow comparison with databases
of normal patients and determination of certain so-called
scores - agreed quantitative parameters to facilitate
decision-making between normal and pathological findings.
Thus, radionuclide gammagraphy
depicts functional and metabolic processes in tissues and organs,
not their anatomical or morphological structure. However,
scintigraphic images can provide certain information about morphology
indirectly - by deriving from the display of the
distribution of a radioindicator in the functional tissue of a
certain organ or in tumor tissue. Non-functional tissue areas
and, in general, areas where the radioidicist does not penetrate,
are not displayed. It is often useful to supplement and combine
("merge") scintigraphic functional images with
anatomical X-ray images (especially SPECT or PET with CT) - to
perform a functional-anatomical correlation (discussed above in §4.6 "Relationship
scintigraphy and other imaging techniques", the "Mergers
images of PET and SPECT with CT and NMRI"). This can lead to more
accurate and comprehensive diagnosis.
Disorders of function often precede
disorders of anatomical structures - especially if the disorder
is caused by altered molecular biochemical processes at the
cellular level. Using radioisotope nuclear medicine techniques
can therefore pathological changes often reveal earlier
than other diagnostic procedures - even before structural changes
are visible. Although scintigraphy has a smaller spatial
resolution than X-ray or MRI, but thanks register individual
photons g it is very sensitive to subtle changes in the
distribution of the radiopharmaceutical due to metabolic
abnormalities.
Accumulation
( uptake ) of radiopharmaceuticals
Rate of uptake - the accumulation
of applied radiopharmaceuticals - in the examined tissues and
organs is an important indicator of physiological or pathological
function. This parameter uptake (absorption) can be determined on the
scintigraphic image based on the measured number of
pulses in the marked region of interest (ROI) of the
investigated structure, which is basically directly proportional
to the accumulated activity. This number of photons emitted from
the accumulated radioactivity lesion or organ towards the
detector camera is, however, influenced by three factors :
- It is reduced by photons absorbed or scattered
in the tissue located between the examined organ and the body
surface (for gamma 140keV it is about 50%
per 6cm soft tissue).
- It can be increased by photons coming from a
radiopharmaceutical collected in the surrounding tissues in front
of and behing the organ under investigation - the body
background.
- The most important factor: Radioactivity in the
examined organ is determined by the applied activity
and the share of accumulation of this total activity in the given
organ (this proportion corresponds to the
functional status of the organ). The
measured number of pulses is then directly proportional to the activity,
acquisition time and sensitivity of the gamma camera.
To determine the percentage of
accumulation, we must first convert the activity
applied to the patient in [MBq] to the corresponding number
of pulses and acquisition time detected by the gamma
camera. This can be done either by multiplying the camera
sensitivity coefficient (§4.5,
passage "Sensitivity (detection efficiency) of
the gamma camera") for a given radionuclide and collimator (if we have measured it in advance),
or ad hoc by capturing an image of the applied activity
(syringe) with the radiopharmaceutical (subtracting
the activity of the "empty" syringe after
administration and correcting for the half-life of the
radiopharmaceutical and the acquisition times). Furthermore, it is desirable to make a correction
for the absorption (attenuation) of gamma radiation in
the tissue layer between the measured organ and the body surface (§4.3, passage "Adverse effects of SPECT and their
correction", point "Absorption
of gamma radiation").
Determination of the percentage
accumulation may be useful especially for assessing the accumulation
capacity of the thyroid gland (§4.9.1
"Thyrological diagnostics",
especially before radioiodine treatment - § ..., passage
"..."), relative renal
function (§4.9 .., "Nephrological
diagnostics") and accumulation of radiopharmaceutical in tumors
during biologically targeted radionuclide therapy
(§3.6, part "Radioisotope therapy"). In these images of tumor
lesions (especially on tomographic PET
images with 18FDG), a standardized value of
accumulation SUV is often used to assess tumor
viability (described in more detail above
in §4.2, section "Quantification
of positive lesions on gammagraphic images - SUV").
Specificity of
scintigraphic diagnostics
The specificity
of scintigraphic methods may be lower or higher
than for other modalities, depending on the mechanism of
pharmacokinetics of the radioindicator used. E.g. in skeletal
scintigraphy (§4.9.7 "Skeletal
cintigraphy") bone metastases are
seen earlier than on X-ray or MRI picture, but they cannot be
distinguished from focal changes caused by other mechanisms of
increased osteoblastic activity (inflammation, fractures) - high
sensitivity but low specificity. In
scintigraphic methods mapping the targeted and selective binding
of a radiopharmaceutical to the cells of the examined tissue
(tumor scintigraphy, perfusion scintigraphy of the myocardium or
brain, receptor diagnostics), scintigraphic diagnostics can be highly
specific.
Dynamic scintigraphy
In addition to imaging and localizing structures in which a
certain radiopharmaceutical accumulates physiologically or
pathologically, it is sometimes important to assess the temporal
dynamics of this accumulation or the passage of a
radioindicator through the examined organs. This is the task of dynamic
scintigraphy, capturing the time course of the
distribution of the radioindicator - individual phases of the
passage of the radiopharmaceutical through the examined organ -
by means of a series of sequential images of the
examined areas, scanned sequentially at selected time intervals
*). The acquisition times of the images are chosen with respect
to the speed of the studied process; they range from tenths of a
second (for fast events such as cardiology) to tens of seconds or
several minutes (kidneys, liver). The total scanning time is
determined by the duration of the investigated process, ranging
from one minute to 1-2 hours. The obtained series of images can
be evaluated both visually (to observe the
passage, accumulation and leakage of the radioindicator in
various places), but above all quantitatively.
In the pictures, we draw regions of interest
(ROI) of significant structures, from which we construct curves
of the time course of radiopharmaceutical distribution. We can
then perform mathematical
analyzes of curves - for significant
points and sections of curves various time intervals, ratios,
integrals and other quantities are determined, appropriate
functions are interpolated by least
squares method,
rate coefficients of radioactivity increase
or decrease are
calculated, curves are derived, integrated, filtration and deconvolution is performed, etc. - according to the used mathematical model of the investigated process. By this mathematical analysis of the time dependence
curves of the indicator radioactivity in the relevant tissues and
organs, we can obtain diagnostically important quantitative
parameters of their function, both total and regional.
*) A special type of dynamic scintigraphy is phase
scintigraphy of the cardiac cycle - ECG gated
ventriculography. It is not created by simple sequential
imaging, but by periodic recording and synchronous composing of a
large number of consecutive images in different corresponding
phases of the cardiac cycle - a detailed dynamic scintigraphy of one
representative cardiac cycle is created (described in detail
in §4.4 "Gated phase scintigraphy ").
Functional parametric
images
When evaluating dynamic scintigraphy, we can obtain various
quantitative parameters of the function, not
only total, but also regional, local. In the
extreme case, we can imagine that every image element
- the pixel (i, j) of the image matrix - will be considered as a
small elementary area of interest (microROI).
From this microROI we can construct a curve of
the time course of the radioindicator distribution at the
corresponding place and mathematically process
it using a certain model: eg interpolate an exponential or other
suitable function and determine a certain diagnostically relevant
dynamic parameter - eg velocity coefficient, slope gradient,
increase or decrease half-life of radioactivity. The value of
this locally calculated parameter is then stored in the same
localized element (i, j) new image matrices, which we
declare in the computer's memory. This is done for all pixels of
the image of the examined area. By such processing of time curves
from all microROI, ie from all pixels (i, j) of
the image, we get a new artificial image, which
no longer expresses the measured numbers of pulses on the
scintigram, but shows the distribution of a
diagnostically important parameter of the investigated
function - functional parametric image, clearly
mapping the local distribution of the function of the
investigated organ. Thus, a parametric image in individual
pixels, instead of the number of pulses, contains a number-value
that characterizes a functional parameter.
Functional parametric images are
most often used in the evaluation of gated ventriculography -
heart rate image, paradoxical image, Fourier images of phase and
pulsation amplitude in individual places of the heart chamber
(see below "Gated ventriculography", or in more detail in "Radionuclide
ventriculography" of the book
"Ostnucline"). Special parametric images are provided
by the so-called factor analysis (described
in the works of M.Šámal and H.Trojanová ) .
Clearance
Important global parameter that can be obtained by dynamic
scintigraphy is the so-called clearance. It is
the amount (volume) of blood or plasma in the body, that is
"purified - cleaned" of a certain monitored substance
per unit time. After a single intravenous administration of the
appropriate radioindicator, we first monitor its accumulation and
then its leakage from blood or plasma. The rate
of decrease in plasma activity concentration *) depends on the
elimination performance of the examined organs - kidneys or
liver; with impaired function of the relevant elimination organs,
the clearance value decreases. In dynamic scintigraphy, we
construct a curve (histogram) from the area of interest outside
the elimination organs, preferably from the precordium or lung
area. This elimination curve represents the time course
of the radioindicator concentration in the blood / plasma. We
then evaluate this curve from the "blood pool"
with compartmental analyzes - we interpolate bi-
or multi-exponential functions using the least squares
method. The elimination curve is basically created by the
composition of two exponential functions. The first, faster
exponential, is a manifestation of a relatively rapid balancing
of the radioindicator concentration between the blood
(intravascular) volume and the interstitial environment (by filtering plasma from blood capillaries into tissue
fluid to transfer nutrients and oxygen to cells) - dilution into the entire distribution area of the
radiopharmaceutical. The second, more gradual component, is a
reflection of the organ's own clearance by the elimination organ
(kidney or liver). By interpolating the biexponential function,
we mathematically separate both components, while the velocity
coefficient in the later and slower exponential indicates the
required value of plasma clearance. If the
radioindicator used is excreted only in the organ under
investigation, it is also the organ clearance
value. The value obtained by this calculation is relative [sec.-1]; the actual
(absolute) clearance in [ml./sec.] is obtained by multiplying the
velocity coefficient by the value of the total distribution
volume the indicator used in the organism. Calculation
of clearance is described in the passage "Processing
the blood-pool curve - clearance"
in the book "OSTNUCLINE".
*) Plasma clearance was
previously measured by sampling methods: after
i.v. administration of the radioindicator, blood samples were
taken at certain time intervals and their plasma activity was
measured using scintillation detectors. Using simplified
compartmental analysis, clearance values were calculated from
them (formerly by graphical analysis on semi-logarithmic paper).
Transit functions, transit
times
The elimination curve of the blood pool can be further combined
with the organ curves and used for so-called deconvolution
analysis, with the help of which we obtain the so-called
transit functions of the passage of the
radio-indicator through the elimination organs and their parts
(e.g. parenchyma and hollow system of the kidneys, or liver
parenchyma). It models a hypothetical situation, where we would
apply the radio-indicator directly into the inlet vessel
supplying the given organ and monitor the dynamics of the passage
of this "bolus" of the radio-indicator through the
examined organ.
The so-called transit times are also read on the
transit curves, expressing the time (in seconds or minutes) for
which the radio-indicator passes through the examined organ or
its part. The minimum, mean and maximum transit times are
evaluated.
The mathematical description of
deconvolution analysis, acquisition of transit functions, their
analysis and interpretation is in the passage "Deconvolution,
transit functions",
FIg.3.4.3 in §3.4 "Dynamic scintigraphy of the kidneys" of the book "OSTNUCLINE - Mathematical
analysis and computer evaluation of functional
scintigraphy".
Combination of diagnostics and therapy -
theranostics
Teragnostics is generally a treatment strategy that purposefully
combines diagnostics with therapy. New diagnostic
imaging methods, especially molecular imaging in
nuclear medicine, make it possible to integrate
individual (personalized) diagnostics and targeted therapy (or prevention) of serious diseases into a common
field, for which the name teranostics or teragnostics was newly used (created by composing names: therapy +
diagnostics => theragnostics). It's a kind of "diagnostic of the
therapy". The analysis of the diagnostics and
possibilities of therapy in an individual patient makes is
possible to determine, whether the selected therapy will be
effective, even before its initiation. And further assess the
response to the performed therapy.
Theranostics combines diagnostics and
therapy into one medical procedure in the spirit of the
shortened motto {find a pathological lesion}->{destroy
this lesion}. The pathological
lesion is found by diagnostic imaging, followed by the
administration of a therapeutic agent that destroys cells in the
pathological lesion. The process of destroying tumor cells can in
principle be monitored again by diagnostic imaging. Precise
targeting of tumor cells leads to higher effectiveness of therapy
with better accuracy, less damage to healthy tissues and thus
lower side effects. It is also a personalized therapy,
taking into account the molecular properties of the cells of a
specific patient.
In nuclear medicine, theranostics
consists in the "pairing" of therapeutic
and diagnostic radionuclides chelated to a
suitable compound - carrier/vector - aimed at a specific clinical
target (organ, tissue, group of cells). Due to their
radioactivity, diagnostic radioisotopes emit gamma
radiation (either directly from
the nucleus or during positron annihilation),
which allows scintigraphic imaging of the target
tissue. During their decay, therapeutic radioisotopes release
charged energetic particles such as alpha, beta
(possibly Auger electrons), which are capable of inactivating and
killing cells in the target tissue due to their
ionization effects. For such a theranostic pair
("matched pair of radionuclides"), the diagnostic
counterpart can effectively predict the biodistribution
of the therapeutic radionuclide.
For teranostics in nuclear medicine
is optimal when the atom of diagnostic gamma radionuclide (such as 99mTc, 18F or 68Ga) has a similar chemical
coordination of electrons in the valence shell as a therapeutic
beta or alpha radionuclide( 90Y, 131I, 177Lu, or 225Ac). This allowing the same biochemical vector
molecule to be used for scintigraphic diagnostics as
well as for subsequent radioisotope therapy - just labeled with
another radionuclide. The diagnostic drug is thus focused on the
same molecular target as the subsequented therapeutic
radiopharmaceutical, which allows to determine in advance the optimal
applied activity and estimate the effectiveness of
treatment --> theranostics :

Fig.4.9.2 Principle of teragnostics in
scintigraphic diagnostics and biologically targeted radionuclide
therapy in nuclear medicine.
Above: The same ligand-targeted
biomolecule is labeled first with a diagnostic radionuclide
(gamma or positron) and then with a therapeutic radionuclide
(beta or alpha) using a suitable chelator. Bottom:
Use of this created diagnostic radiopharmaceutical for
scintigraphy, or a therapeutic radiopharmaceutical for
biologically targeted radionuclide therapy.
Scintigraphy makes it possible to determine the
concentrations of biologically active substances directly at the
sites of their targeted action, which enables optimal and
individual dosing, with the possibility of predicting effects and
monitoring the results of therapy. We will first label the
relevant biologically targeted substance with a diagnostic
gamma-radionuclide, apply low activity and
perform scintigraphic imaging. In case of successful uptake in
target tissues (and sufficiently low
unwanted uptake in healthy tissues - in critical organs), we label the same substance with therapeutic beta- or
alpha- radionuclide and apply high activity to
the patient (determined individually based
on scintigraphy). It can be almost
certainly assumed, that this therapy will be successful..!..
Theragnostic
radionuclides
Radionuclides suitable for theragnostics can be basically of
three types :
1. One radionuclide
with mixed radiation beta- +gamma, beta- + beta+,
alpha + gamma, or alpha + beta+ , which will be marked
the relevant biologically targeted radiopharmaceutical. Gamma or
positron emission allows scintigraphic imaging of planar/SPECT or
PET. The emitted beta electrons or alpha particles then cause the
radiobiological therapeutic effect of the desired destruction of
pathological cells in the target tissue where the
radiopharmaceutical has been taken up - theranostics.
Such a radionuclide that is capable at the same time
to enable diagnosis and therapy, we can (working)
call it a "monotheranostic
radionuclide".
The best known example of such a
"monotheranostic" radionuclide is the
classical radioiodine 131
I , whose gamma radiation of energy
364keV allows scintigraphy (planar or
SPECT), while beta- electrons can
exert a therapeutic effect - with significantly higher applied
activity. It has been used for decades in radioisotope
diagnostics + thyroid therapy (hyperthyroidism
and metastases of differentiated cancer, see below §4.9.1 ), although the name
"theranostics" was not introduced at that time. More
recently, the iodine-131-labeled monoclonal antibody tositumomab (Bexxar) has been used
to treat lymphomas.
In principle, some other
"monotheranostic" mixed radiation radionuclides, such
as lutetium 177 Lu, can be used for theranostic purposes. So far, the
experimental teranostic radionuclide is terbium 149
Tb with mixed alpha-beta+ radiation:
annihilation radiation from positrons+ can be used for PET diagnosis, emitted alpha particles
cause a therapeutic effect (concomitant
gamma radiation is not very suitable here for theranostics; but
the main problem of 149-Tb is the complex conversion scheme with
a number of secondary radionuclides - see 149 Tb ).
2. Two
radioisotopes of the same element , one of which emits
gamma photons or positrons beta+ for scintigraphic diagnostics, the second isotope
emitting electrons beta- or alpha-particles for
therapeutic effect. If we label the same biochemical with these
two different isotopes, we get a diagnostic radiopharmaceutical
for scintigraphy and a therapeutic radiopharmaceutical that will
have identical biochemical properties to achieve
successful theranostics.
An example is iodine 123
I for scintigraphy and iodine 131
I for therapy (used
mainly in thyrology). So far, the
experimental pairs of theranostic radionuclides are the positron
isotope 64 Cu for imaging PET and the beta-isotope
67Cu
for therapy, similarly 64 Sc/ 67 Sc, or the pair 86
Y for PET diagnostics and 90 Y for beta therapy.
3. Two different radioisotopes of different
elements, one of which emits gamma photons or beta+ positrons for scintigraphy,
the second radionuclide is a beta- or alpha emitter
for therapy. Each of these radionuclides is chelated to the same
biochemical substance to give the appropriate diagnostic and
therapeutic radiopharmaceutical. Their identical biochemical
properties are no longer 100% ensured
here, they can be influenced by various chelators and complex
chemical bonds - they need to be carefully verified...
In the positive case, the theranostic approach will also be successful.
A new interesting method of 100% ensuring identical
pharmacokinetics of diagnostic and therapeutic
radiopharmaceuticals are the radiohybrid theranostic
radiopharmaceuticals described below.
Theragnostic method of is performed, so
far mostly experimentally, using several radionuclides, for a
number of monoclonal antibodies with the help of various
chelators. For scintigraphic imaging of planar/SPECT/PET, the
radionuclides 99m-Tc, 111-In, 18-F, 68-Ga, 89-Zr, 124-I are used,
which are subsequently combined with the beta-radionuclides 90-Y,
177-Lu, or with alpha-radionuclides 212-Bi, 227-Th, 225-Ac - in
each case the same monoclonal antibody.
Recently, for example, the combination (68Ga/177Lu) -PSMA J591 or
(68Ga/225Ac) -PSMA-617 at metastatic prostate ca appears to be
promising.
Radiohybrid
theranostic radiopharmaceuticals
A newly developed interesting "trick" is to bind two
chelators to a targeted ligand molecule simultaneously
(hybridly) with two required atoms, not
yet radioactive. For example, natural fluorine 19F and natural lutetium
natLu (consisting of 97.4% 175Lu and 2.6% 176 Lu). If we then add to such a preparation the appropriate radioactive
isotope - either 18F or 177Lu, it is labeled by the mechanism of isotope
exchange with one or the other radionuclide. As needed,
either 18F for diagnosis (lutetium remains inactive) or 177Lu
for therapy (here
conversely the fluorine remains inactive).
It also automatically ensures the identical
pharmacokinetics of the substance labeled with the
diagnostic and therapeutic radionuclide in the sense of point 3. above, as
the two molecules are atomically- chemically identical,
differing only isotopically. It is an ideal feature for theranostics.
It is currently being tested on the PSMA 18F/177Lu
.

Fig.4.9.3. Principle of radiohybrid theranostics. Above:
Ligand vector biomolecule with two bound chelators with
non-radioactive atoms (here natural fluorine and lutetium). Middle:
Binding of radioactive fluorine atoms 18F or lutetium 177Lu by isotope exchange with inactive atoms. Bottom:
The use of thus created diagnostic
radiopharmaceutical for scintigraphy (PET) or a therapeutic
radiopharmaceutical for biologically targeted radionuclide
therapy.
This approach is currently being tested for PSMA, a
radiohybrid rhPSMA-7 has been developed, primarily for 18F/177Lu
labeling, using a silicon fluoride acceptor for efficient
isotopic exchange of inactive 19F fluorine for beta+ radioactive 18F fluorine.
Radionuclide
examinations in nuclear medicine
In nuclear medicine, a number of methods have been developed for radionuclide
examinations of various tissues and organs in order to
determine their normal or pathological states.
In the beginning of the field of
nuclear medicine (60s-70s of the 20th century), sample
methods were often used - blood or
plasma samples taken from patients after application of a
radioindicator were measured using radiometers (mostly cavity
scintillation detectors). From the measured activity of these
samples (in relation to the applied activity), the parameters of
function - clearance, distribution volumes - of the respective
radiopharmaceuticals in the monitored organs, or blood
circulation were determined using mostly empirical methods,
dilution principles, etc. Or, the concentration of the
radiotracer in the body was measured using scintillation probes
aimed at organs of interest (eg kidneys, heart). During the
80s-90s and the first decade of the 21st century, these methods
were gradually abandoned. These were often
"blindly" methods; from today's point of view, they
provided less accurate and less reliable results with greater
laboriousness, with the possibility of significant individual errors;
so it is good that they are already abandoned...
Now a simple "equation"
applies, that :
Current (and
future) nuclear
medicine = scintigraphy + radionuclide therapy with open radionuclides .
The preparation of
the patient before the scintigraphic examination depends
on the examined process, the radiopharmaceutical used, the state
of health and the patient's previous medication. Above all,
before the examination, with a certain time interval, it is
necessary to discontinue such drugs that would adversely affect
the biodistribution of the radioindicator used, or the function
of the examined organ (for thyroid
examination they are iodine preparations, for cardiac nitrates,
beta-blockers, diuretics, cardiotonics).
Prior to non-thyrological examinations, Chlorigen is often given
to block the thyroid gland. Before to the actual scintigraphic
examination, an appropriate radiopharmaceutical
must be prepared at the nuclear medicine workspace (§4.8 "Radionuclides
and radiopharmaceuticals for scintigraphy"), for i.v. application
filled in a syringe with a specific value of activity optimized
individually for each patient (usually
based on body weight) *). The activity of
the radiopharmaceutical for application is measured in a
metrologically calibrated activity meter (§2.3, section "Well ionization activity meters").
*) Guideline values of the
recommended applied activity for different types of
radiopharmaceuticals are given in the table in §5.7 "Radiation exposure during radiation diagnosis and
therapy", section "Radiation
exposure of patients from radionuclide examinations".
The time course
of scintigraphic examination depends mainly on whether it is
static or dynamic gammagraphy, what is the course of the examined
process in the organism and how fast is the pharmacokinetics of
radioindicator used. In static scintigraphy, the
application of the radiopharmaceutical is usually performed
off-camera (in the application room), the volume and speed of the
application do not matter, the actual imaging is taken with a
certain time interval, it is necessary to wait
until the radio indicator is sufficiently taken up and
accumulates in the required tissues - it can even be in 2 hours (e.g for skeletal scintigraphy or for PET imaging of 18FDG accumulation in
tumor lesions).
In dynamic scintigraphy, the
radioindicator is applied directly below the scintillation
camera, the field of view of which is set to the patient's
examination area, whereas dynamic imaging starting immediately
with the application. For dynamic scintigraphy of fast
processes (such as blood flow
through the atria and ventricles during angiocardiography, or
monitoring the dynamics of the perfusion phase in the brain or
kidneys) it is necessary to perform a
so-called bolus application: rapid application
of a radioindicator with high activity in a small volume of about
0.5 ml. - compact bolus, with immediate start of
dynamic scintigraphy with a sufficiently high frame
frequency (one or more
frames/sec.).
Methods of clinical scintigraphic
diagnostics
Here we will briefly describe some more important methods of
scintigraphic diagnostics. In the introduction to the individual
areas of scintigraphic diagnostics, we will first present a brief
outline of the structure and biological function
of the examined tissue or organ and its most common pathologies,
based on which we will analyze methodological approaches
to the diagnosis of relevant disorders and diseases. For each
specific method, we will state its medical purpose,
the radiopharmaceuticals used, procedure of performing
the examination, and finally its processing and
evaluation, with examples of scintigrams and the results
of normal and pathological (all listed
scintigraphic images were acquired and evaluated at the Clinic of
Nuclear Medicine University Hospital Ostrava). Since there are a number of scintigraphic methods in
nuclear medicine, we have divided this topic into several
numbered subchapters according to the
investigated organs, systems or separate issues :
4.9.1.
Thyreological radionuclide diagnostics
The thyroid gland
is located in the front part of the neck and, despite its small
dimensions (approx. 5 x 7 cm), it is a
relatively important organ, intervening in a number of processes
in the whole organism. Thyroid function is closely linked to iodine
metabolism in the body. Sodium iodide NaI penetrates
thyroid cells by transport via the Na/I symporter (which
is a 37 kDa transmembrane glycoprotein) - the "iodine
pump". Within thyroid cells, iodine binds in the
thyroglobulin molecule to form monoiodine- and diiodine-tyrosine.
Their combination then produces thyroid hormones -
triiodothyronine (T3) and tetraiodothyronine (thyroxine T4).
Therefore, radioiodine is also efficiently taken
up by the thyroid gland. Thyroid hormones enter cells in the body
and are involved in regulating a number of metabolic processes in
the body. They affect the transport conditions on cell membranes
for the entry of sugars and amino acids into cells. T3 binds to
the corresponding T3 receptors on the surface of mitochondria and
thus regulates intracellular metabolism. It also binds to
T3-responsive domains in nuclear DNA and initiates mRNA
production for proteosynthesis in cells.
Thyroid pathology
The most common functional pathologies of the thyroid
gland are :
- hyperthyroidism
- increased thyroid function with excessive production of
hormones (T3, T4).
- hypothyroidism
- decreased thyroid function.
- functional autonomy - independence of
the function of certain areas in the thyroid gland on regulatory
mechanisms.
A common morphological
disorder is an enlarged thyroid gland or goiter,
which can be diffuse or nodular. Depending on
the function, the goiter may be eufunctional, hyperfunctional or
hypofunctional. Nodes - areas of increased
density, occur quite often in thyroid tissue. And not only one
node - unifocal, but also more nodes - multifocal disability.
In terms of function, they may have the same function as the
surrounding tissue, or they may be hyper- or hypofunctional.
The most serious thyroid disability
is its tumorous disease - thyroid cancer. From a
histological point of view, there are 3 basic types of thyroid
tumors :
- Differentiated adenocarcinoma, which is
further divided into follicular, papillary and mixed. Follicular
carcinomas (15-30% of all thyroid malignancies) are mostly
unifocal and spread mainly through the bloodstream. Papillary
and mixed cancers are the most common (30-70%), they are mostly
multifocal and metastasize mainly through the lymphatic system.
Differentiated thyroid carcinomas retain iodine
accumulation and are therefore successfully treatable
with 131I radioiodine (§3.6,
section "Radioisotope
therapy", passage
"") .
- Medullary carcinoma (approximately
5-10% of the incidence) is based on parafollicular
C-cells, it spreads mainly hematologically and its treatment is
more difficult than in differentiated ones. It often does not
respond to radioiodine...
- Undifferentiated (anaplastic)
carcinoma (approximately 10% of the incidence) originates from
follicular cells, metastasized by blood and lymphatic routes. It
tends to be quite aggressive with invasion of surrounding tissues
and the formation of more distant metastases. Its treatment is
difficult and usually unsuccessful (it does not respond to
radioiodine).
From a general point of view, the
issue of cancer is discussed in more detail in §3.6 "Radiotherapy",
radionuclide therapy, especially in the section "Radioisotope
therapy", not only cancer, but
also, for example, hyperthyroidism.
Radioisotope
diagnosis of the thyroid gland is the oldest
method of nuclear medicine (first tested in
1938). This is due to the strong ability of
the thyroid gland to accumulate iodine - and thus even the radioiodine,
the radioactive isotopes. Previously, only simple accumulation
tests were performed with 131I radioiodine, the amount of which in the thyroid gland
was measured with a single gamma-probe; it was determined what
percentage of the applied amount of radioiodine is taken up in
the thyroid gland. Later, scintigraphic methods
were introduced.
The
thyroid accumulation test
is now performed only before radionuclide
radioiodine therapy to determine the applied activity. The
patient is given about 0.5-1 MBq of radioiodine,
orally in the form of a solution of sodium radioiodide. After its
absorption from the GIT, iodine ions are taken up by the
functional tissue of the thyroid gland (or
even by metastases of differentiated thyroid gland). After 6 or 24 hours, the captured activity in the
thyroid gland is measured either by a simple collimated
radiometric probe (see Fig.2.4.3 b
in §2.4, passage "Scintillation probe") or by a gamma
camera (with marking and
quantification of ROI on the thyroid image)
and compared with the activity of the administered
radiopharmaceutical - the result is the percentage
of radioiodine taken up *). Normal values are about 5-15% in 6
hours and 10-30% in 24 hours. This measurement can also be
performed repeatedly over several days to
determine the dynamics of gradual leakage (clearance)
of radioiodine from thyroid.
*) The results may be skewed by some drugs
containing iodine, which saturates the uptake mechanisms and
reduces the accumulation of radioiodine - these must be
discontinued !
Measurement of
radioiodine accumulation in the thyroid gland, as well as its
clearance - effective half-life, is important for
individual determination of the required applied activity of
radioiodine to achieve optimal therapeutic effect in
hyperthyroidism and autonomic adenomas -
see §3.6, section "Therapy of thyroid
gland with radioiodine 131 I", section "Individually
applied activity - Marinelli equation".
Thyroid
scintigraphy
Purpose:
To show the distribution of functional thyroid tissue
in the primary diagnosis, its location, shape and size and reveal
possible anomalies - areas of increased or decreased function in
thyroid tissue, finding ectopic thyroid tissue. Furthermore,
showing the functional properties of palpable nodes and
functional autonomy. In combination with laboratory determination
of T3, T4, TSH levels, assessment of hyper- or hypothyroidism.
In thyroid cancer therapy, scintigraphy is used to demonstrate
residual accumulating tissue and to detect distant accumulating metastases
of differentiated thyroid cancer.
Radiopharmaceuticals:
The basic method consists in the oral administration of radioiodine
131
I in the form of sodium iodide
Na 131I.
Due to the higher radiation exposure (radiation b which is to
diagnostic unusable), however, 131I is no longer used for primary diagnosis, it is
replaced by an isotope of iodine 123 I-sodium ,
or 99 m Tc pertechnetate, which also taken up and accumulated in
cells similarl to iodide, but unlike there from does not bind to
thyroglobulin and does not enter into other metabolic reactions. 131I (application approx. 10MBq) is
used only in patients with proven thyroidopathy before
radioiodine therapy.
To finding less differentiated tumor
tissue and metastases are also used 99mTc-MIBI and 99mTc-Tetrofosmin. It
to image medullary carcinoma (which contains somatostatin
receptors) is further used 111In-pentetreoid, also 123,131I-MIBG.
Execution :
For scintigraphy of the thyroid gland, as a small organ, we use a
high-resolution collimator using ZOOM, or a pinhole
collimator (which increases the projection of the thyroid gland
over a larger usable area of the camera's scintillation
detector). After iv application of 99mTc-pertechnetate (approx. 100-200 MBq), a planar image
is captured in the AP projection after about 30 minutes. For
better morphological orientation, it is advisable to take a
picture with marking using a point source - "pointer".
Evaluation :
The normal image of the thyroid
gland has a like "butterfly" almost symmetrical shape,
with an approximately homogeneous distribution of the
radiopharmaceutical in both lobes of the parenchyma. The
pathological picture shows an inhomogeneous distribution
with "cold" nodes of reduced function, or
"hot" nodes of increased thyroid tissue function.
Possible functional autonomy of hot nodes can be
determined by repeated suppression scintigraphy of the
thyroid gland after several days of administration of
triiodothyronine. In functional autonomy, the accumulation of the
radiopharmaceutical in the "hot" deposit does not
change, while in the others parenchyma (paranodular tissue), due
to hormonal suppression, the accumulation decreases significantly
or disappears (§3.9 "Quantitative thyroid
scintigraphy" in OSTNUCLINE).
| Normal thyroid scintigram |
 |
Whole-body scintigraphy after radioiodine therapy of the thyroid gland . Multiple accumulating deposits in both lung wings - metastases of thyroid cancer - appeared. Under favorable circumstances, these malignant foci can be successfully eradicated by radioiodine therapy. |
| Hyperfunctional node in the right lobe of gland |
||
| Nodular goiter with unfunctional node on the left |
||
| Examples of typical images of thyroid
scintigraphy (the pictures were taken by MD. V.Dedek, PhD., KNM Ostrava) |
When searching for functional metastases
of differentiated thyroid carcinomas, it is appropriate to use whole-body
scintigraphy with radioiodine (application
approx. 100-200 MBq). Thyrological
diagnostics in nuclear medicine can then be followed by radionuclide
therapy of the thyroid gland - treatment of
hyperthyroidism, autonomic adenoma, thyroid carcinoma (see §3.6 "Radiotherapy",
section "Radioisotope therapy with open
emitters"). After therapy is followed by control
scintigraphy of the thyroid gland or metastases at
certain time intervals.
Parathyroid
scintigraphy (parathyroid glands)
The parathyroid glands are 2 pairs of
small formations located on the back of both lobes of the thyroid
gland. They are glands producing the parathyroid hormone,
that affect the calcium content - releases it from the bones into
the blood.
Purpose: Using scintigraphy, we try to show the
hyperfunctional parenchyma of enlarged
parathyroid glands (usually their adenoma), which by their
increased production of parathyroid hormone, adversely affect the
turnover of calcium in the body.
Radiopharmaceuticals: As there are no
radioindicators that are selectively taken up in the parathyroid
glands, the cationic complexes 99mTc-MIBI and 99mTc-Tetrofosmin are used, but they also accumulate in the
thyroid parenchyma.
Execution and evaluation: Displaying small
parathyroid glands against the background of much larger thyroid
tissue is not easy. We can help in two ways :
- Two-phase scintigraphy using faster leaching
of 99mTc-MIBI
from thyroid tissue, than from the parathyroid gland affected by
enlargement or adenoma. In about 15-30 minutes after iv
application of the radiopharmaceutical (approx. 700-800MBq) we
take the first image, the next in 2-3 hours.
- Subtraction scintigraphy performing computer
images subtraction. The image of the thyroid gland taken after
the application of 99mTc-pertechnetate alone (approx. 200MBq) is subtracted
from the "summation" image [of the thyroid gland +
parathyroid glands], taken after the subsequent application of 99mTc-MIBI or 99mTc-Tetrofosmin. Both
images must be captured under identical conditions, without
changing the position. After subtracting the image of the thyroid
gland tissue, in the remaining "summation" image, the
image of the parathyroid gland itself remains.
4.9.2. Nephrolological radionuclide
diagnostics
The urinary excretory system, formed by the system [kidneys -
ureters - bladder - urethra], is collectively called the uropoietic
system.
The kidneys *) are mainly serves to filter
blood (which is supplied to the kidneys by the renal
arteries), which removes metabolic products and other
unnecessary or harmful substances from the body, which then flow
out as urine out of the body. Waste products - catabolites
- of nitrogen metabolism (urea, creatinine), acid catabolites,
water and electrolytes are thus removed, thus maintaining a
stable internal environment. The kidneys also have a regulatory
function- ensure homeostasis of the organism - water, salts,
minerals, acid-base balance, participate in maintaining blood
pressure. The basic building block and functional unit of the
renal parenchyma is the nephron. The human
kidney contains about 800,000 to 1.5 million nephrons.
*) The kidneys are called ren in
Latin, and nephros in Greek - hence the synonym for renography
= nephrography in the examination methods.
The nephron begins with a
small ball of capillaries called the glomerulus,
where the branching renal artery brings blood. In the glomeruli,
the basic clearance function of the kidneys takes place - glomerular
filtration, which is a process of ultrafiltration
blood plasma under pressure across the glomerular membrane. The
microporous structure of the glomerular wall (which prevents the
flow of plasma proteins larger than about 100 kDa) and the
electrostatic barrier of the glomerular membrane (negative charge
of polyanionic macromolecules of the membrane and negative charge
of most plasma proteins prevent the transfer of even smaller
proteins with molecular weight above about 60). The glomerular
ultrafiltrate is primary urine, which is essentially
plasma without cells and large molecules of plasma proteins; more
than 150 liters of this liquid are made in kidneys a day. In
addition to waste metabolic products, it contains a number of
substances and nutrients (such as glucose) that should remain in
the body.
The glomerular filtrate enters
a hollow canal of the nephron, called the tubule.
Here, tubular resorption takes place, during
which part of the substances from the glomerular filtration is
reabsorbed and returned to the blood, leaving through the
vascular bed around the tubules, through a drainage vessel from
the kidney. Most water, glucose, amino acids, minerals return to
the blood by resorption. This maintains homeostasis - the balance
of water and salt in the body. In addition to resorption, tubular
secretion also occurs here - tubule cells actively take
up some substances from the blood (eg creatinine) and transport
them to the tubular cavities, ie to the urine. The total amount
of substance excreted in the urine is given by the sum of:
(glomerular filtration) - (tubular resorption) + (tubular
secretion).
After passing through the tubular system,
definitive secondary urine is formed, which consists of
water with dissolved urea, sodium chloride and a small amount of
other substances; about 1.5-2 liters per day is excreted. The
tubules open into thicker collecting ducts, funnel-shaped calyxes
and finally into the renal pelvis (pelvis renalis) of
the hollow kidney system, from where urine flows through the ureters
into the bladder. From there, after releasing the sphincter, it
flows out of the body through the urethra.
Pathologies od the
kidneys and urinary tract
The kidneys are relatively often
affected by inflammatory and infectious diseases. Pyelonephritis
is a bacterial purulent inflammation of the kidneys (renal pelvis
- pyelos as well as parenchyma), which can be acute or
chronic and can lead to deterioration in renal function if
repeated or prolonged. Glomerulonephritis is an
inflammatory disease affecting mainly the glomeruli in the
kidneys, which can occur after infections (especially
streptococcal), autoimmune processes and other causes. Some
kidney diseases can lead to deterioration of renal
function, which can be irreversible (nephron loss), in
extreme cases can result in kidney failure...
Very common kidney and urinary tract
involvement is lithiasis (urolithiasis)
- "kidney stones", formed by the accumulation and
increased concentration of mineral salts that crystallize
in the urinary tract, especially in the pelvis of the
kidneys or in the bladder. The most common are stones from
calcium oxalate or uric acid. They can grow to various sizes,
from small particles of "sand" to larger stones (> 1
cm), which can block the outflow of urine from the kidney. This
ureteral obstruction causes congestion in the
hollow system of the kidney, which also burdens the parenchyma
(which must filter against pressure); with prolonged obstruction,
renal function is irreversibly impaired.
When renal function is
impaired, glomerular filtration is reduced and thus waste
products are retained in the body and tubular resorption is
reduced, and the absorption of electrolytes and water is
impaired. This also affects blood pressure and can lead to
disorders of acid-base balance, or even hematopoiesis.
The renal parenchyma
can be affected by cystic (often
polycystic) disease. Renal tumors, such as Grawitz's
tumor, are relatively uncommon. .....
The
kidneys and their excretory functions have already become a
suitable object for radioisotope diagnostics in the beginning of
the field of nuclear medicine.
Until the 1970s and 1980s, radioisope
renography was one of the most frequent nuclear medical
examinations. After application of the nephrotropic
radioindicator 131I-hippuran, the course of radioactivity in the kidneys
was recorded with two collimated scintillation renographic
probes (see Fig.2.4.3b in §2.4, passage "Scintillation probe"), attached to the patient's back in the kidney
location. The electrical signal from the detectors was fed to a
double registration recorder, the pen of which plotted the
so-called nephrographic curves on paper. From
the shapes of the nephrographic curves it was possible to deduce
various pathological conditions and disorders of renal function,
as well as urine outflow from the kidneys. Semi-quantitative
analysis of nephrographic curves was sometimes performed.
However, it was only an approximate "blindly"
examination, without the possibility of regional assessment.
Replacing isotope nephrography with dynamic scintigraphy
has significantly refined diagnostics and provided much more
comprehensive informations :
Dynamic
renal scintigraphy
Purpose :
It is the most important method of nuclear nephrology. It is used
for a comprehensive assessment and quantitative analysis of perfusion
and excretory function of the kidneys (and their
parts), clearance and drainage - the dynamics of urine outflow
from the kidneys. It can also provide certain information about
the morphology of the kidneys, which, however, is derived from
the display of the radioindicator distribution in the functional
tissue of the kidneys (parenchyma) and from the outflow or
accumulation of the radiotracer in the hollow system.
Radiopharmaceuticals:
- 99mTc-DTPA
(diethylenetriaminepentaacetic acid), which is excreted by
passive ultrafiltration in the glomeruli (not resorbed in the
tubules). In addition to functional imaging, it is also suitable
for the determination of glomerular filtration by plasma
clearance.
- 99mTc-MAG3
(mercaptoacetyltriglycine), which binds to transport plasma
proteins and is excreted by tubular secretion (in glomeruli it is
almost not filtered). It provides contrasting images of the
functional renal parenchyma, captures the dynamics of urine
outflow from the kidneys well, and can be used to determine the effective
renal plasma flow (ERPF) by plasma clearance. For this
purpose, use is sometimes also ortojodhippuran
labeled with 123I (formerly
131I), which is
excreted from about 80% by tubular secretion and about 20% by
glomerular filtration.
Execution :
Under the scintillation camera, set in the rear projection on the
kidney area, approx. 200MBq of radio indicator is applied and
dynamic acquisition is started immediately in short time
intervals: perfusion phase approx. 1s/frame -
100 frames, followed by functional phase approx.
10-30s/frame, total acquisition time 30 minutes. The images are
stored sequentially in the computer's memory. In the case of
visible retention in the hollow system, a diuretic
is applied in about 15 minutes - a substance that increases
diuresis (intensity of urinary excretion) by affecting transport
in various parts of the nephron; furosemide is the most
commonly used.
Processing :
By observing the sequences of images, we can visually
observe the entry of the radioindicator into the kidney, its
uptake in the parenchyma, transport into the calyx-pelvic system
and outflow trough the ureter into the bladder. We can recognize
possible abnormalities. For quantitative analysis,
on suitable summation images we mark the areas of
interest (ROI): the area of the bloodstream (area around
the heart), left and right kidneys and their parts (parenchyma,
hollow system), tissue background (on which
correction is performed - subtraction).
From these areas, the computer then creates curves
("histograms") of the time course of activity in these
places.
The curve from the area of
interest ROI of the bloodstream represents the time changes
(especially the decrease) of the concentration of the
radioindicator in the blood (plasma). The rate of decrease in
plasma radioactivity concentration depends on the elimination
ability - clearance - of the kidneys, with
impaired renal function, the rate of clearance is reduced (calculation of clearance is described in the passage
"Processing the blood-pool curve - clearance" in the book "OSTNUCLINE").
Nephrographic curves
are created from the ROI of the kidneys, from which the time and
speed parameters of reaching the maximum, speed or half-time of
the decline, are determined. A diuretic test is
important in case of delayed excretion or retention of the
radiolabel in the kidney: if the decrease in the nephrographic
curve did not occur even after the application of the diuretic,
this indicates obstructive hydronephrosis.
By differentiating the
activity of the parenchyma and the pelvis, it is possible to
decide whether the pathology of the nephrographic curve is caused
by a functional disorder of the indicator passage in the
parenchyma, or changes in the outflow - dilatation of the hollow
system or obstruction of the urinary tract in the kidney. This is
exactly done by the so-called deconvolution analysis of
nephrographic curves to create transit functions.
The
mathematical description of deconvolution analysis, creation of
transit functions, their analysis and interpretation, is in the
passage "Deconvolution, transit functions", Fig.3.4.3 in §3.4 "Dynamic scintigraphy
of the kidneys" of the book
"OSTNUCLINE - Mathematical analysis and computer evaluation
of functional scintigraphy".
| Mathematical analysis and complex evaluation of dynamic functional scintigraphy of kidneys - MAG3 | |
 |
|
| Evaluation:
After intravenous administration of the radioindicator, the kidneys of the usual shape, size and placement are displayed, without focal changes. The nephrographic curve of the left kidney has a normal course, on the curve of the right kidney we observe a slowdown of drainage and retention, disappearing after diuretics. Conclusion: |
Here are examples of evaluation almost normal á and distinctly pathological â dynamic renal scintigraphy.
| Mathematical analysis and complex evaluation of dynamic functional scintigraphy of kidneys - MAG3 | |
 |
|
| Evaluation:
After intravenous administration of the radioindicator, a well-accumulating left kidney of the usual shape and size was displayed, without focal changes. The right kidney appears delayed as markedly hypofunctional and inhomogeneous - only the narrow margin of the functional parenchyma around the markedly dilated excavated hollow system is preserved, with significant retention. The nephrographic curve of the left kidney has a physiological course. The nephrogram of the right kidney has a markedly flat shape with a low functional segment, the curve has a permanently ascending course, unresponsive to the application of a diuretic in the 17th minute. Conclusion: Visual evaluation of sequential images and quantitative analysis of nephrographic curves indicate good left kidney function, but severely hypofunctional right kidney with marked renal parenchymal atrophy. Left kidney drainage is a physiological, on the right is an obstructive drainage disorder, without response to the administered diuretic. Global kidney function is almost normal due to age. Signature: MUDr. Jozef Kubinyi, Ph.D. |
The mathematical procedure for the analysis of
dynamic scintigraphy of the kidneys is described in detail in
§3.4 "Dynamic scintigraphy of the kidneys" of the book "OSTNUCLINE - Mathematical
analysis and computer evaluation of functional
scintigraphy".
Renovascular
hypertension - captopril
test
Elevated blood pressure is a disorder that can seriously endanger
health, especially vascular complications. It is usually a
primary hypertensive disease, but high blood pressure
can also be caused secondarily, by a disease of some other
organs. This is often secondary to nephrogenic hypertension
in kidney disease such as pyelonephritis or glomerulonephritis.
Here, nuclear nephrology can also be used in differential
diagnosis. A specific case is renovascular
hypertension - increased blood pressure caused by
insufficient perfusion of the kidneys (their ischemia) due to
stenosis of the renal artery. This retains water and sodium in
the body, as even otherwise healthy kidneys cannot sufficiently
fulfill their function. The RAAS renin-angiotensin-regulatory
system is activated: renin, produced to
an increased extent in the ischemic kidney, is converted to angiotensin
II by the action of a conversion enzyme, which
maintains the blood flow of the glomerulus at the required value
by increasing the pressure in the glomerulus. However, this
physiological compensation by systemic action on the arterioles
and an increase in aldosterone levels leads to an undesirable
increase in blood pressure. Inhibition of angiotensin converting
enzyme (ACE) by a suitable drug can block this regulatory
mechanism. Such a short-acting ACE inhibitor is captopril,
which can be used here for diagnostic purposes.
We therefore apply captopril
before starting dynamic scintigraphy which, by inhibiting ACE,
reduces tonus in vas efferens and reduces glomerular
filtration. The secretion of DTPA by glomerular and MAG3 by
tubular cells is slowed down, so that the originally normal
nephrographic curves become pathological - a decrease in
glomerular filtration and thus a slowing down of the transport of
the radiopharmaceutical by the renal parenchyma. By comparing
the kidney curves from native dynamic scintigraphy without
captopril with scintigraphy after captopril, we can reveal the
renovascular origin of hypertension.
Dynamic scintigraphy of the
transplanted kidney
The principle and methodological procedure are basically
analogous to the above-mentioned dynamic scintigraphy of the
kidney. In addition to the assessment of the clearance
function of the transplanted kidney, it is important to
assess in particular its perfusion, acute
tubular necrosis *) and the risk of rejection,
drainage of the graft and ureter, detection of
possible complications and anomalies in transplantation (such as urinoma).
*) Somewhat misleading name "acute tubular
necrosis - ATN" means a delayed onset of perfusion and
renal graft function after transplantation, depending on the
duration of cold ischemia kidneys in the time interval between
removing the kidney from donor and its transplant to the
recipient. Severe ATN may result in rejection.
Compared
to the above-mentioned dynamic scintigraphy of the kidneys, the
projection differs - in the AP projection, the camera captures
the area including the iliac arteries, the transplanted kidney
itself and the bladder. Areas of interest are drawn:
blood pool, arteria illiaca, transpl. kidney, bladder,
background. In addition to the parameters common in dynamic renal
scintigraphy, the Hilson perfusion index and bladder
outflow rate are determined. Analysis of dynamic
scintigraphy of the transplanted kidney is described in §3.5
"Dynamic
scintigraphy of the transplanted kidney"
OSTNUCLINE book.
| Mathematical analysis and complex evaluation of dynamic functional scintigraphy of a transplanted kidney | |
| Evaluation:
After intravenous administration of a radioindicator, the abdominal aorta and iliac artery are imaged in the usual way, followed by a well-perfused transplanted kidney. In the further course, the radiolabel is well concentrated in the transplanted kidney, then excreted into the bladder quickly enough. Conclusion: Visual evaluation of sequential images and quantitative analysis of the curves of the passage of the radio indicator indicate good perfusion and function of the graft , rapid transit through the parenchyma and free drainage of the hollow system. There are no signs of incipient rejection. |
Static
scintigraphy of the kidneys
Purpose: Using this simpler method it is
possible to obtain functional-morphological information about the
distribution of the functional parenchyma in the
kidney, and derivatively about the shape, size and location of
the kidneys, sometimes structural changes. Separate renal
function can be determined - % share of left and right
kidney in total function (renal functional symmetry test).
Radiopharmaceuticals: Labeled substances are
used as radiopharmaceuticals that are taken up by the renal
parenchyma, but do not pass into the urine. The most widely used
is 99mTc-DMSA
(dimercaptosuccinic acid), which is taken up in proximal tubule
cells.
Execution: After iv application approx. 100MBq 99mTc-DMSA is performed
in about 2 hours by its own static scintigraphy, mostly in 4
projections, the most important of which is the projection of PA
and AP.
Evaluation is mostly visual, the size,
shape and placement of the kidneys, the distribution of
functional tissue are evaluated. Computer processing is performed
to determine the separated function (corrected for the absorption of radiation g from various
deep-seated kidneys), is described in §3.7
"Static
scintigraphy of the kidneys" of
the book OSTNUCLINE.
Radionuclide urowlowmetry and cystography
Purpose: Used to examine the
dynamics of micturition, determination of bladder volume, bladder
residue, evacuation rate, detection of vesicoureteral reflux.
Execution: A patient whose bladder
is filled with a radioactive solution is urinated in front of a
camera detector, while dynamic scintigraphy of the ureter and
bladder area is scanned, at a frequency of about 1 frame/sec.
There are two methods of filling the bladder, direct and indirect
cystography. The indirect method consists in the
application of a nephrotropic radiopharmaceutical (usually 99mTc-MAG3, approx.
200MBq), after which a normal dynamic scintigraphy of the kidneys
is performed, during which the bladder is filled with renal
function. In direct cystography, the bladder is
filled with a radioindicator (approx. 50MBq) through the
catheter.
Evaluation: In addition to the visual assessment of a series of
images of the micturition, we mark the areas of interest of the
bladder, ureters and tissue background, from which we create
curves of the time course of radioactivity, especially the urodynamic
curve. By their computer analysis we can quantify the
course of micturition - determine the duration and speed
of micturition, bladder residue. We can
visually assess and quantify the regurgitation of urine
from the bladder to the ureters or possibly to the renal pelvis -
vesicoureteral or vesicorenal reflux
. ....
Computer analysis of dynamic uroflowmetry is described in §3.6
"Radionuclide
uroflowmetry" of the book
OSTNUCLINE.
| Mathematical analysis and complex evaluation of dynamic uroflowmetry | |
 |
|
| Evaluation: After the start of dynamic scintigraphy, micturition soon begins, during which there is a sufficiently rapid emptying of the bladder with a low residue. Vesico-ureteral reflux, more pronounced on the right, is well visible in scintigraphic images of the emptied bladder and urinary tract. Conclusion: Radionuclide uroflowmetry shows normal micturition flow and low bladder residue, but shows vesico-ureteral reflux . |
4.9.3 Diagnostics of the gastrointestinal
tract - liver and bile ducts, pancreas, spleen,
esophagus and stomach
Liver scintigraphy
The liver is an
important organ in which significant metabolic, detoxification
and elimination processes take place; they are incorporated into
the digestive tract and also into the reticuloendothelial
system (RES). They are one of the largest organs, weighing
about 1.5 kg in humans, are located in the right diaphragmatic
arch of the abdominal cavity. The liver parenchyma consists
mainly of polygonal liver cells - hepatocytes (60%) and
reticuloendothelial Kupfer cells (15%). Then there are
the hepatic star-shapet It cells, Pit cells and
walls of a large number of blood vessels and intrahepatic bile
ducts.
Hepatocytes
take up various substances from the plasma, transform them and
then excrete them into the bile, which leaves
the intrahepatic pathways (via the gallbladder) through the
ductus choledochus to the intestinal tract. Liver cells are
significantly involved in a number of metabolic and synthetic
processes :
- Carbohydrate
metabolism - liver cells take up glucose from portal blood
and convert it to lipids or glycogen, conversion of lactate and
alanine to glucose.
- Lipid
metabolism - fatty acid synthesis and oxidation, glycerol
formation, phospholipids, cholesterol, lipoproteins ...
- Amino
acid metabolism -
- Synthesis of plasma proteins -
- Detoxification
function - it is mainly the detoxification of ammonia
(formed during the decomposition of amino acids). Ammonia is
converted to urea and glutamine, which are then excreted in the
kidneys. Furthermore, some foreign molecules (especially
hydrophobic, which cannot be excreted by the kidneys) are
oxidized by cytochrome and excreted in bile or plasma (from where
they are then removed in the kidney).
Red blood cells have a limited lifespan (about 120 days), after
which they are taken up in the spleen and liver and sequestered.
From the hemoglobin the iron is separated, which is used to
synthesize new hemoglobin, while the remaining component (heme),
bound to the hemopexin protein, is phagocytic by Kupfer cells and
converted to bilirubin. It binds to the blood protein albumin and
is taken up by hepatocytes in the liver, where it binds to
glucuronic acid. This produces conjugated bilirubin,
which the liver cells secrete into the bile, which then
drains into the small intestine.
The liver also has a number of other functions - the production
of hormones and their degradation or inactivation, cholesterol
degradation, part of hematopoiesis, storage functions of lipids
and glycogen.
Hepatocytes secrete water, salt ions,
acids, cholesterol, phospholipids and bilirubin - liver bile
- into the bile capillaries, which gradually coalesce into the
bile ducts. Bile collects in the gallbladder - a
sac-shaped "reservoir" on the bile, from where it is
released in a controlled manner and drained through the bile
ducts - ductus cysticus - ductus choledochus - into the duodenum
and from there into the intestinal tract (small intestine), where
it is involved in fat digestion.
Kupfer cells
are fixed macrophages that phagocytose bacteria, foreign
proteins, persistent erythrocytes and some other cells. Pit
cells are large granular lymphocytes with significant
cytotoxic activity, which by their phagocytic ability cooperate
with Kupfer cells. It's cells (lipocytes)
contain a large amount of lipids.
The blood circulation
of the liver is about 1.5 liters/minute and has two
components :
1. The hepatic artery supplies blood rich in
oxygen (20% of the blood circulation of the liver), nourishes the
liver parenchyma.
2. Functional circulation from the portal vein
- vena portae (approximately 80% of the hepatic
circulation) brings blood containing absorbed nutrients from the
digestive tract, as well as various products of cell metabolism.
The vena portae branches into veins flowing through the
portobiliary space between the hepatocytes, the blood then drains
through the hepatic veins into the inferior vena cava.
Pathology of the liver
and bile ducts
The liver has a large functional reserve and the ability to
regenerate. However, the liver can be damaged due to excessive
exposure to toxic substances, hepatotoxins (such as
alcohol), inflammatory and infectious diseases (hepatitis A, B,
C). These damage can result in nodular remodeling, fibrosis, and
gradual disappearance of the liver parenchyma - liver
cirrhosis associated with liver failure and vascular
complications - by portal hypertension and portosystemic shunts
(see "spleen" below).
Pathologies
of the bile ducts, especially cholelithiasis,
are relatively common - stones in the gallbladder, which are
caused by increased concentration and decreased bile solubility.
Gallstones can cause inflammation and clog the bile ducts,
preventing the outflow of bile from the liver - obstructive
ikterus occurs, manifested as jaundice caused by the
accumulation of bilirubin in the plasma.
Liver cancer
- the primary liver tumor is hepatocellular carcinoma
(hepatoma). Much more common are secondary liver involvement with
metastases from other tumors (most often breast
or colorectal ca). A benign tumor of the liver is hemangioma.
Radionuclide
diagnostics of the liver primarily uses the functions of
hepatocytes and Kupfer cells. After administration of the
radiopharmaceutical, which is taken up from the bloodstream by
hepatopcytes, we can investigate the function of liver and
biliary tract by dynamic liver scintigraphy - cholescintigraphy.
By applying a radiopharmaceutical that is taken up (phagocytosed)
in Kupfer cells, we can disply the distribution of the parenchyma
by static scintigraphy of the liver and thus
(indirectly) obtain information about the morphology of the
liver.
Dynamic
liver scintigraphy - cholescintigraphy
Purpose:
It is used for comprehensive assessment and quantitative analysis
of hepatic function (and its parts), clearance
and drainage - dynamics of bile formation and outflow
through intrahepatic pathways into the gallbladder,
gallbladder evacuation, passage to the duodenum and intestinal
tract. It can also detect duodeno-gastric reflux. In addition, it
may provide some information on the morphology of the liver,
which, however, is derived from the display of the radioindicater
distribution in the functional tissue of the liver (parenchyma)
and from the outflow or accumulation of the radiolabel in the
bile ducts.
Radiopharmaceuticals
:
Iminodiacetic acid (IDA) derivatives labeled 99mTc - HIDA, EHIDA.
Execution:
After i.v. application of approx. 100-200 MBq of hepatotropic
radiopharmaceutical in the supine position in the front
projection, dynamic scintigraphy is immediately started at a
frame rate of approx. 20-30 sec./frame. To stimulate gallbladder
emptying, a cholekinetic stimulus - cholecystokinin or a fatty
diet (chocolate) is given at about 30th minute during the
examination. Dynamic scintigraphy is scanned for 60 minutes. If
the radio indicator does not appear in the intestines after this
time, further still images are recorded in 2 and 4 hours.
Evaluation
:
By visual evaluation of images of different phases of
radioindicator distribution in the liver and passage through the
bile system, we assess the distribution of hepatocytes in the
liver parenchyma, bile duct morphology, gallbladder deposition
and size, its emptying and bile drainage into the intestinal
tract, event. duodenal-gastric reflux.
On the relevant dynamic images, we mark the regions of
interest: bloodstream, whole liver, liver
parenchyma, ductus choledochus, intestinal tract, gallbladder (if
seen) and stomach (if duodenal-gastric reflux is suspected). From
the curves of the time course of radioindicator
concentration in these areas of interest, we evaluate and
quantify hepetocellular liver function -
clearance and rate of extraction of the radiopharmaceutical by
hepatocytes from the bloodstream, biliary outflow
dynamics, including determination of gallbladder ejection
fraction, degree of duodeno-gastric reflux.
By deconvolution of the liver
curves with the blood-pool curve, we can construct transit
functions and determine the transit times of
the passage of the radio-indicator through the entire liver,
liver parenchyma or its selected parts. By exponential analysis
of transit curves, we can further determine the hepatic
extraction fraction (HEF) of the liver parenchyma, its
individual lobes or selected parts (ROIs). HEF indicates how much
[%] of the radio-indicator is absorbed during one passage through
the vascular bed of the liver parenchyma - thus it quantifies the
liver parenchyma's own functional absorption ability, which
enables it to be distinguished from biliary tract pathology.
The
method of determining HEF is described in the passage "Hepatic
extraction fraction"
§3.10 "Dynamic scintigraphy of the liver" of the book "OSTNUCLINE".
Determining the functional
capacity of the liver and its individual segments and selected
areas is important not only in clinical hepatology,
gastroenterology, internal medicine, but also in patients
undergoing more extensive resection procedures with the removal
of part of the functional liver parenchyma. Here there is a risk
of insufficient function of the remaining functional residue and
the development of liver failure, with very adverse (even fatal) health consequences.
Mapping the functional fitness of the liver parenchyma can
contribute to the optimization of the planned surgical strategy.
| Mathematical analysis and complex evaluation of dynamic functional scintigraphy of the liver and bile ducts - cholescintigraphy | |
 |
|
| Evaluation:
After intravenous administration of the radioindicator, the liver of the usual shape and size is imaged in a timely manner. The liver parenchyma does not show focal changes. Bile ducts can be differentiated from 10th minutes, from 13th minutes the gallbladder begins to fill. In 30.min. a cholekinetic stimulus was administered. In the next course, we observe a rapid passage of the radioindicator through the biliary system, with a smooth outflow through the ductus choledochus into the intest. tract. Conclusion: Visual evaluation of sequential images and quantitative analysis of liver curves indicate good hepatocellular function, rapid transit through the liver parenchyma and free drainage of the biliary system, without signs of biliary obstruction. The gallbladder has a good filling and evacuation function. |
Mathematical analysis and computer evaluation of dynamic cholescintigraphy is described in detail in §3.10 "Dynamic liver scintigraphy" of the book "OSTNUCLINE".
Diagnosis of bile acid malabsorption
Bile acids are synthesized in the liver
from cholesterol. The primary bile acids, cholic and
chenodyoxycholic, are conjugated with glycine and taurine and are
expressed into the bile ducts. After the intake of fat in food,
they are secreted into the duodenum under the influence of
cholecystokinin. Bile acids have a decisive function in the
digestion and absorption of fats taken in food - fatty acids and
momoglycerides released during lipolysis in the intestine. Bile
acids with this process are gradually absorbed in the
small intestine and do not reach the large intestine.
With malabsorption,
bile acids are not sufficiently absorbed in the ileum, they
penetrate into the large intestine and are the cause of chronic
diarrhea. They cause increased secretion of electrolytes and
water, increased permeability of the colon mucosa, increased
colon motility and increased mucus production. This disorder of
reduction in the absorption function of the terminal ileum
occurs, for example, in Crohn's disease, inflammatory, toxic or
radiation damage; it often occurs after radiotherapy of
malignancies located in the lower parts abdomen and in pelvis.
Radiopharmaceuticals
:
The SeHCAT (Selenium HomoCholic Acid Taurine
Test) method for diagnosing bile acid malabsorption uses 75Se-
tauroselcholic acid as a radioindicator. It is a
synthetic bile acid conjugated with taurine (23-seleno-25-homo-taurocholic
acid), labeled with radioactive selenium 75Se. Tauroselchic acid
is similar to bile acid, it has the same physiological behavior
as conjugates of bile acids.
The physical properties of selenium-75 are given in §1.4
"Radionuclides", passage "Se-75".
Measurement of radiopharmaceutical retention kinetics was
previously performed experimentally using whole-body radiometers
or collimated scintillation probes. In nuclear medicine
workplaces, the use of a scintillation gamma camera without a
collimator proves to be the best - due to the low applied
activity, we need maximum detection sensitivity, but we do not
need a scintigraphic display of the radioindicator distribution,
we just need to measure the total number of impulses from gamma
radiation in a given time -> relative activity of the radiopharmaceutical.
Execution :
Approximately 400
kBq of 75Se-tauroselcholic
acid is administered orally (in a capsule) to the patient. Under
the camera without a collimator, placed above the
abdomen, the number of pulses registered for an acquisition time
of about 10 minutes is measured, the window of the analyzer with
a width of 20% is set to the photopeak of 289 keV 75Se. The first
measurement is performed 3 hours after application (day 0), the
second measurement is performed 1 week later, in the identical
position of the patient (on the back, same area of the abdomen).
In both measurements, the radiation background is subtracted,
which tends to be relatively high; measurements need to be made
under conditions where there are no radioactive sources in the
vicinity (e.g. other patients with applied
radioactivity). A correction is made for
the decay of Se-75 - in 7 days it is a coefficient of 1.04. From
the values measured in this way, we determine the retention
of the radiopharmaceutical in % (the value on the 7th
day is expressed as a percentage of the value on the 0th day). A
normal rate of loss is >20% per week. Retention of 10-15% is
considered mild malabsorption, 5-10% moderate, <5% is
classified as severe malabsorption.
This method is relatively
marginal in nuclear medicine, it is performed only rarely only in
some workplaces. A therapeutic test of the clinical response to
sequestrants after administration of cholestyramine and
biochemical tests are usually sufficient for gastroenterologists.
Nevertheless, in some more complex cases, this special
examination can be useful...
Static scintigraphy of the liver
Purpose: To obtain indirect information about the morphology of
the liver - findings of diffuse involvement and detection of
focal liver lesions.
Radiopharmaceuticals: Sn-colloid
(or sulfur colloid) labeled with 99mTc, which is rapidly taken up from the bloodstream by
Kupfer cells after application.
Execution: After i.v. application of approx. 150 MBq 99mTc-Sn colloid, in 15
min. performs scintigraphy in the front, back and possibly right
lateral projection. For better imaging of lesions deposited
deeper in the parenchyma, it is advisable to perform SPECT
imaging.
Evaluation:
In addition to the placement, shape and size of the liver, we
visually assess the distribution of the radiopharmaceutical in
the parenchyma on planar or tomographic images. Liver lesions are
usually accompanied by decreased Kupfer cell density, which
results in decreased radiopharmaceutical accumulation. The
finding is non-specific : local reductions
(cold deposits) may be caused by cysts, abscesses or tumors
(metastases), diffuse involvement (hepatomegaly,
uneven distribution in the parenchyma, increased accumulation in
extrahepatic RES - spleen and bone marrow) may be caused by
hepatitis, cirrhosis, metabolic disorders, malignancies.
Scintigraphy
of hepatic hemangiomas
Hemangioma is a benign mesenchymal tumor of blood
vessels. A cavernous type of hemangioma often occurs in
the liver. It is a highly vascularized structure that has a
higher proportion of blood - and thus a higher
concentration of erythrocytes - than the surrounding
tissue. After application of radionuclide-labeled erythrocytes,
hemangiomas appear as "hot" deposits of increased
radioactivity deposition than in the surrounding tissue.
Purpose: The examination is used to detect cavernous hemangiomas
in the liver and to distinguish them from other structures (such
as primary or metastatic tumors).
Radiopharmaceuticals: Autologous erythrocytes labeled with 99mTc
- labeled either in vitro, but more often in vivo
using Sn-pyrophosphate (applied 20 min. before application of 99mTcO4).
Execution: Simultaneously with the i.v. application of the
radiopharmaceutical, dynamic scintigraphy of the perfusion phase
*) is started in a projection in which the best imaging of
suspicious deposits is assumed. Total dynam. shooting about 2
min., frame rate 2-3 s./frame. After 40-60 minutes, static
scintigraphy of the liver area is performed, preferably in SPECT
tomography.
*) Note:
Previously performed dynamic scintigraphy of the perfusion
phase in hemangiomas it is based on the fact that in the
hemangioma there is an increased blood pool at a relatively
slower blood flow compared to the vessels of the surrounding
tissue. However, monitoring of the perfusion phase has been shown
to have little clinical benefit and is therefore generally not
performed.
Evaluation: On static planar
scintigrams and on reconstructed tomographic SPECT sections, we
look for deposits of increased deposition of
labeled erythrocytes, which indicate the presence of hemangiomas.
In SPECT scintigraphy, the limit of detection of hemangiomas is
about 1 cm.
Distinguishing
hemangiomas from other units suspected of malignancy is important
for primary tumor diagnosis. Biopsies should not be
performed on hemangiomas as highly perfused structures,
because there is a risk of bleeding .
Pancreas
scintigraphy
The pancreas is a small but
metabolically and endocrine important organ located in the
abdominal cavity in the duodenum, just below the liver.
The exocrine component, which opens into the
duodenum, produces digestive enzymes -
pancreatic lipase for the breakdown of fats, alpha amylase for
the breakdown of starch, proteases for the breakdown of proteins.
Under normal circumstances, digestive enzymes are inactive
form after their formation inside the pancreas (otherwise they would damage - "digest" - the
pancreatic tissue, pancreatitis would occur), only when they reach the duodenum are they
activated and can begin to perform their digestive function.
Endocrine part (whose
cells are arranged in the islets of Langerhans) produces pancreatic hormones - insulin
(regulates blood sugar levels), glucagon, somatostatin,
pancreatic polypeptide.
Pancreatic pathology
The most common disease associated with pancreatic is diabetes
- diabetes mellitus caused by tissue damage islets of
Langerhans, where insulin is formed. Inflammation
of the pancreas, pancreatitis, is caused by the retention
of digestive enzymes in the pancreas, which remain inside, are
prematurely activated and "self-digest" damage the
pancreatic tissue, causing swelling and an inflammatory reaction.
Acute pancreatitis is caused by sudden obstruction
of the pancreatic duct to the duodenum, usually by bile stones. Chronic
pancreatitis, caused by a slow outflow of pancreatic enzymes into
the duodenum, has a milder and longer-lasting course. In more
severe cases of necrotizing hemorhagic pancreatitis,
proteolytic pancreatic enzymes can enter the bloodstream and
cause toxic effects in various tissues and organs. A very serious
disease is (adeno)carcinoma of the pancreas,
which often metastasizes the whole body through the lymphatic
system.
Dynamic scintigraphy of the
pancreas
The pancreas is difficult to
access for functional diagnosis. For scintigraphic
examination of the pancreas the radiopharmaceutical 75Se-selenomethionine
H2 C-S-
(CH2 )2 CH (NH2 ) COOH labeled with
the radionuclide selenium 75Se was developed (physical
properties in §1.4 "Radionuclides", passage "Se-75
"). The intake of amino acids
in the pancreas is a reflection of the rate of synthesis of
digestive enzymes. The similarity between selenium and sulfur is
so close that the substitution of selenium instead of
sulfur in the methionine molecule leads to an analogue
that has all the metabolic properties of an amino acid, including
incorporation into proteins, and is therefore efficiently taken
up by the pancreas in digestive enzyme production.
The first
attempts at radioisotope examination of the pancreas in the 1960s
with collimated probe detection ("blind"
measurement - a priori to no avail...) and
then static scintigraphy with a motion gammagraph and camera
without computer acquisition, were able to assess only gross
pancreatic abnormalities. Valid results were obtained only by
dynamic scintigraphy of the pancreas :
Dynamic
scintigraphic examination of the pancreas can be useful
for early detection of pancreatic exocrine dysfunction, retention
or obstruction of the drainage pathways - in diabetic patients,
pancreatitis, cancer.
Gamma
camera equipped with a ME or HE collimator, the analyzer window
set to a 264keV peak, is placed the slightly obliquely above the
liver and pancreas area. After i.v. application approx. 100
kBq/kg 75Se-selenomethionine, dynamic
sequential images the liver and pancreas are taken on a
gamma camera at intervals of 5-10 minutes. for 60-120 minutes.
Selenomethionine is also taken up non-specifically in the liver (where proteosynthesis also takes place), so that
the image of the pancreas is often displayed in interfering
background against the radioactivity of the liver. To eliminate
this disturbing background, 99mTc-colloid
is sometimes applied at the end of the examination (with
the patient's position unchanged), which is specifically
taken up by the liver. The resulting scintigraphic images of the
liver are then subtracted from the 75Se-selenomethionine
images. By this gradual subtraction of images, the
disturbing image of the liver is suitably suppressed and better
separation and visibility of the pancreas is achieved.
The regions
of interest (ROI) of suitable parts of the pancreas are
then marked on scintigraphic images, from which dynamic
curves of the time dependence of selenomethionine
accumulation are generated. The curves are mostly evaluated
visually (but at our workplace we also developed a
program for their quantitative processing). In
physiological cases, the curve after the initial rapid increase
reaches a peak after 20-30 min. from the
application, followed by a slower decline. Reduced
function of the pancreas is manifested on the curve by a
flat shape, with a later onset and slowing of the rate of growth.
In this case, the pancreas is displayed less clearly on
scintigraphic images. Retention of digestive
enzymes within the pancreas is manifested by a later and slower
decline; with more severe pathology, the peak and decline do not
appear at all, the curve still has a slowly increasing trend.
 |
Dynamic scintigraphy of the pancreas.
Left: The area of interest (ROI) of the appropriate part of the pancreas is marked on the summary scintigraphic image. Middle: Typical normal and pathological curves of the time course of selenomuthionine uptake in the pancreas. Right: Different responses of the curves to cholecystokinin application. (This scintigraphy was taken on a Clincom instrument) |
In such pathological cases, in about 60.-90.
minute i.v. applies pancreozymin, more commonly called cholecystokinin
(also stimulates gallbladder contraction),
1 u/kg, which stimulates the secretion of pancreatic
enzymes (and possibly also secretin,
which, among other things, potentiates the effect of
cholecystokine and also has trophic effects on the pancreas).
It is analogous to the above cholekinetic stimulus in dynamic
cholescintigraphy, or the application of a diuretic (furosemide) in dynamic renal scintigraphy.
Depending on the response of the curve to this pancreatic
stimulator, it is possible to distinguish the decrease
in function, parenchymal pancreatic damage or obstruction ...
Pancreatic
scintigraphy was relatively infrequent, diagnostic yield
relatively low, with a significant percentage of indeterminate
findings. It was performed mainly in the 70s-80s. Pancreatic
cancer is now visualized by CT imaging and static PET/
CTscintigraphy.
Static scintigraphy
of the pancreas with 99mTc-
interleukin-2 is also tested
for imaging of chronic inflammatory changes in type 1 autoimmune
diabetes, to identify patients with pancreatic inflammation. It
makes it possible to detect an increased incidence of activated T
cells - the degree of lymphocytic infiltration even in smaller
inflammatory processes of insulitis, in the early period for the
treatment of immunotherapies.
Scintigraphy of the spleen and dynamic
splenoportography
The spleen (Latin
lien , Greek splén ) is
a somewhat "mysterious" organ located in the abdominal
cavity, near the stomach. Phylogenetically, the spleen probably
developed as an organ of hematopoiesis. However, it
retains this function only in the prenatal period (until about
the 6th month of fetal development), then it is taken over by the
bone marrow. After birth, the spleen functions only as a
"filtering" organ with a large number of macrophages,
retaining microorganisms from the blood and obsolete or damaged
("worn out") blood cells - sequestration of
erythrocytes. It is also has immune significance,
produces antibodies and immunocompetent cells, has phagocytic
ability (RES system).
The weight of the spleen is
about 100-200g, gradually decreasing with age. In some diseases,
however, the spleen enlarges - spenomegaly. Mild
splenomegaly (weight up to 500g) can also occur during
infections. Moderate splenoagaly (500-1000g) may accompany acute
leukemia, malignant lymphoma, polycythemia and more. Rarely,
severe splenomegaly (weight > 1000 g) occurs, eg in chronic
myeloid leukemia, ...
Anatomically, the spleen
belongs to the reticuloendothelial (RES) and hematopoietic
system. The blood supply to the spleen takes place through the portal
circulation (vena portae*), thus being
significantly connected to the liver. Therefore, we have placed
scintigraphic methods related to the spleen in the context of
liver scintigraphy.
*) The portal vein drains
blood from the organs of the abdominal cavity - from the
intestines, lower esophagus, stomach, spleen, pancreas - to the
liver.
Pathology of the spleen and portal pathways
One of the pathologies of the spleen is the above-mentioned splenomegaly.
Portal hypertension is increased blood pressure
in the basin of the portal vein (vena portae). The
portal vein block is most often intrahepatic due to liver
cirrhosis. Instead of the portal vein, the blood then flows
through the created "connectors" - portosystemic
short circuits - into the systemic circulation (into the
basin of the inferior vena cava). There is a development collateral
flow, overloading of the veins creates varices.
Blood from the digestive system bypasses the liver, so it is not
detoxified, which can lead to damage to some tissues (e g brain).
Increased destruction and sequestration of erythrocytes
in the spleen is manifested in hemolytic anemia (see "Half-life of erythrocytes and
localization of their destruction"). This often leads to
splenomegaly. In this case, splenectomy is recommended
to normalize the blood count.
Static scintigraphy
of the spleen
Purpose: Imaging of the functional
tissue of the spleen to determine its shape, size and placement,
including possibly inhomogeneities. It can also be used to
visualize and mark the spleen for application before dynamic
splenoportography.
Radiopharmaceuticals: 99mTc-labeled
autologous heat-damaged erythrocytes are used for selective
imaging of the spleen and are replicated to the patient.
Radiocolloids, mainly 99mTc-sulfur-colloid, whose larger colloidal particles are
taken up in the reticuloedothelium, are used to image the
reticuloendothelial system of the spleen (+ liver).
Execution: After application of
about 100-200MBq of the above radio indicator, planar
scintigraphic images in the front, back, and left side
projections are taken in about 20-30 minutes. For a more detailed
distinction of pathological structures, we can add the display of
SPECT.
Evaluation: In the pictures we assess the shape, size and placement
of the spleen; the size of the spleen can be estimated from the
dimensions of the scintigraphic image using empirical methods. By
observing the homogeneity of the distribution of the
radiopharmaceutical or the presence of focal changes, we can
infer abscesses, cysts, splenomegaly, hematomas or tumors in the
spleen.
Dynamic
splenoportography
Purpose: Examination of blood flow
through the portal vascular bed and detection of portosystem
shunts. Splenoporography is one of the less frequent
scintigraphic examinations, now it is almost abandoned ...
Radiopharmaceuticals: 99mTc pertechnetate.
Execution: The application of the
radioindicator is performed intrasplenically
with a thin needle in a small volume (up to 10 ml.) and fast
enough (bolus) so that the phase of the first flow is well
expressed. At the same time, we will launch the acquisition of
dynamic scintigraphy in the front projection - 60 images after 2
seconds, which captures the flow of the radio indicator through
the portal and system streams.
Evaluation: Visually evaluate
images capturing individual phases of passage: spleen ® v.lienalis ® v.portae ® liver ® systemic circulation.
Under normal circumstances, after itrasplenic application, the
radiolabel passes rapidly through the v.lienalis and v.portae into
the liver, where the flow slows down appropriately in the capillary
bed, then flows through the hepatic veins and inferior vena cava
into the heart and lungs, and then into the systemic circulation.
In the presence of shunts (connectors) of the
portal and systemic flow, part of the radioindicator passes out of the liver and reaches the heart prematurely. In addition to these portosystemic shunts, we can also
asses the possible obstruction of the v.lienalis or v.portae in a
series of images.
To quantify the dynamics of the flow of the
radioindicator through the portal and systemic streams, we mark
the relevant areas of interest: vena lienalis,
liver, heart + lungs, from which we create curves of the time
course of the passage of the radioindicator. From these curves we
can quantify the flow dynamics. For curves from the
v.lienalis, liver, and heart regions, the time of arrival
of the radiolabel, the time of maximum, the steepness
(gradient) of increase (the ascending section intersects the
linear function) and the half-time escape of the
radiolabel (the descending section interpolates the exponential
function) are determined.
The procedure for computer evaluation of dynamic
splenoportography is described in §3.16 "Dynamic
splenoportography" of the
book "OSTNUCLINE".
| Evaluation of dynamic splenoportography | |
 |
|
| Evaluation:
After intrasplenic application of 99m-Tc, we observe on scintigrams a fast flow of the radioindicator through the v.lienalis and v.portae to the liver, without obvious portosystemic short circuits. After the usual slowing down in the capillary bed of the liver, the radiolabel flows out through the inferior vena cava into the heart and lungs. Conclusion:
|
Here are examples of the evaluation of normal á and significantly pathological â radionuclide splenoportography.
| Evaluation of dynamic splenoportography | |
 |
|
| Evaluation: After intrasplenic application of 99m-Tc, we observe on scintigrams a fast flow of the radioindicator through the v.lienalis to caudal shunts. The liver is practically invisible. Long-term retention of the radioindicator in the spleen. Through caudal protocaval shunts, the radioindicator flows into the heart and lungs. Conclusion: |
Scintigraphy of the
esophagus and stomach
Esophagus used to swallow food (solid and liquid
phase) from the mouth to the stomach, where
there is a first stage digestion of food. Under a physiological
state, the swallowed bite is actively transported by the peristalsis
of the esophagus to the stomach, where it arrives in
about 7 seconds. The motility disturbances of the
esophagus may occur due to stenosis of the esophagus,
innervation disturbances, .. Food passage is then decelerated and
is irregular. A disorder of the lower esophageal sphincter causes
part of the food to return from the stomach back to the esophagus
- gastroesophageal reflux occurs.
Dynamic esophageal
scintigraphy - swallowing act
Purpose: Assessment of esophageal
motility, its patency, course of swallowing and detection of the
presence and severity of gastro-oesophageal reflux.
Radiopharmaceuticals: 99mTc Sn-colloid or 99mTc-DTPA.
Procedure: Orally administer about
50 MBq of radioindicator mixed with about 10 ml. water (or fruit
juice) and immediately (better with a little advance) we start a
fast dynamic scintigraphy sitting in the front projection - 120
images after 0.5 sec. (captures the passage through the
esophagus) and then about 60 images after 30 sec. (captures
gastric evacuation or late reflux). During the examination we can
possibly. perform a compression on the epigastrium or Valsava
maneuver to provoke gastroesophageal reflux.
Evaluation: First, we visually
observe images of the passage of the radioindicator through the
esophagus, its distribution in the stomach and then its gradual
evacuation to the intestinal tract. Under normal circumstances, a swallowed
bite is rapidly transported to the stomach with the help of
esophageal peristalsis, so that the passage of the radioindicator
through the esophagus must be sufficiently rapid
and smooth,
without temporary or permanent retention. In various pathological
conditions such as achalasia, disorders of patency (narrowing of
the lumen of the esophagus - tumor, external oppression of the
esophagus, etc.), or disorders of esophageal innervation,
disorders after operations on the esophagus, the passage through
the esophagus slows down. In
scintigraphic images, we then see slowed down or uneven passage through the
esophagus, which may be accompanied by retention
of the
radioindicator in some parts of the esophagus. However, only more
pronounced abnormalities are seen in the scintigraphic images; more detailed and sensitive analysis and
quantification of the esophageal passage is performed on the curves from individual parts of the esophagus
and on special mathematical constructions - transport
function
and condensed image.
A common
pathology is gastroesophageal reflux, when due to
insufficiency of the lower esophageal sphincter, part of
the gastric contents return to the esophagus, ie
abnormally oriented movement against physiological
direction of food passage. In the relevant scintigraphic
images, the resulting regurgitation manifests
itself as the presence of a radioactive deposit, especially in
the area of the lower third of the esophagus (reflux can extend
also to the higher levels of the esophagus - more
detailed and sensitive analysis of the presence and location of
reflux is performed on curves from individual parts of the
esophagus). Reflux can occur either passively
(spontaneously, under native conditions), or it can be caused by increased
pressure in the stomach (manifested by appropriate compression
of the stomach area) - then it is active reflux.
Analysis and computer
evaluation of dynamic scintigraphy of esophageal swallowing
function and gastric evacuation is described in detail in §3.20
"Dynamic
scintigraphy of the esophagus and stomach" of the book "OSTNUCLINE".
| Mathematical analysis and complex evaluation of dynamic esophageal scintigraphy - swallowing act | |
 |
|
| Evaluation:
After oral administration of the radioindicator, we observe in scintigraphic images first a rapid passage of the upper and middle part of the esophagus, then a somewhat slowed passage of the distal part of the esophagus. Once the stomach is reached, most of the radiotracer returns to the middle stage of the esophagus, where it retains for about 20 seconds and only then progresses to the stomach. This abnormal movement of the swallowed radio indicator is particularly evident in the condensed image and the transport function. Conclusion: |
Dynamic scintigraphy of
evacuation of the stomach and small intestine
Purpose: Monitoring the rate of
evacuation of food from the stomach to the intestine, or the rate
of transport trough the small intestine.
Radiopharmaceuticals: 99mTc Sn-colloid or 99mTc-DTPA, which we
mix into solid or liquid food.
Execution: To a patient sitting in
front of the camera, we give orally a small bite of solid
food, marked approx. 50 MBq 99mTc. We will start dynamic scintigraphy, in which we scan
the stomach area for about 1.5 hours at a frequency of 1 frame
per minute. If we want to investigate the evacuation of liquid
food, dynamic scintigraphy of the stomach may follow
dynamic scintigraphy of the swallowing act of the esophagus
(described above). However, a solid diet is more representative
for assessing gastric evacuation. In addition, scintigraphic
examination of small bowel transport may follow,
in the form of a slow dynamic study or sequential still images;
it is taken for several hours as needed. It is advisable to take
a control image of the abdominal cavity the next day (after 24
hours).
Evaluation: On the images of the stomach, we mark the ROI, from
which we generate a curve of the time course of the activity.
This curve begins with a flat arm corresponding to a phase in
which the ingested diet does not leave the stomach (or leaves it
only very slowly). This is followed by a various fast decrease in
activity, capturing the evacuation from the stomach to the
intestine. We evaluate half-time of the evacuation of the
stomach T1/2 -
the time required for the activity in the stomach to decrease by
half (the descending part of the curve
interpolates the exponential function, from the rate coefficient
of which we determine T1/2). Normal values of the half-time
of gastric evacuation in the case of solid food are in the range
of 60-90 min., in the case of liquid food approx. 30-40 min. If
scintigraphy of the small intestine followed, we determine in the
sequential images the time since ingestion, for which the
activity first appears in the initial wide part of the large
intestine (caecum). It is the so-called oro-caecum
time, whose normal values are about 2-5 hours. As the
half-time of gastric evacuation also affects the rate of small
bowel transport, it must also be taken into account.
Scintigraphic
localization of bleeding into the GIT
It is performed using labeled erythrocytes. We
take about 2-5 ml. blood, in which 99mTc is labeled with erythrocytes in vitro and reinjected
back. After i.v. application of approximately 500 MBq of these in
vitro labeled autologous erythrocytes is performed the abdominal
scintigraphy. First dynamic scintigraphy about 60 images after 1
min. If extravasal activity does not appear on the images by
then, we continue by acquisition of static images at
approximately hourly intervals. Possibly bleeding is reflected in
the scintigrams by an increase in the concentration of
radioactivity in the area where the bleeding occurs.
Scintigraphy of Meckel's
diverticulum - imaging of ectopic gastric mucosa
Diverticulum in medical terminology generally refers to local
bulging of a hollow organ wall. Meckel's
diverticulum (in the narrower
sense) is the bulging of the wall of the
small intestine formed by the ectopic gastric mucosa. It
can be scintigraphically imaged with 99mTc-pertechnetate, which is physiologically taken up by
gastric mucosal cells. After i.v. application of this
radiopharmaceutical, we perform dynamic imaging of the abdomen,
approx. 1 min./frame for 1 hour. Simultaneously with the display
of physiological accumulation in the gastric mucosa, a possible
district of the ectopic mucosa of the Meckel's diverticulum is
also displayed.
4.9.4 Nuclear cardiology
The heart (Latin cor
, Greek cardia ) is a hollow
muscular organ that, with its regular contractions, functions as
a pump that drives blood circulation throughout
the body. This ensures the transfer of respiratory gases,
nutrients and metabolic waste products. Cardiology
deals with the structure, function and diseases of the heart. The
heart of higher organisms, especially mammals and humans,
consists of several anatomical and functional parts :
- Cardiac cavities and supply vessels
Deoxygenated blood (passed through the organism) is supplied to
the heart through hollow veins - upper and lower, which
connect to the venous canal in front of the heart.
During the flow through the heart, the blood passes through 4
cavities, which are separated from each other by valves,
preventing the backflow of blood. Blood flows from the venous
canal into the right atrium. From there, it
enters the right ventricle through a tricuspid
valve. The right ventricle, with its contractions, expels blood
through the "crescent" valve into the lungs
- the main arteries of the pulmonary circulation. As it passes
through the lungs, the blood is oxygenated.
Oxygenated blood flows from the lungs through the pulmonary veins
into the left atrium and from there through the bicuspid
valve (also called mitral for resemblance to the
shape of a bishop's miter) into the left ventricle.
With the contractions of the left ventricle, blood is expelled
through the aortic valves into the aorta,
whereby oxygenated blood enters the main arterial circulation -
it passes through individual tissues and organs, releases oxygen,
transports nutrients, receives metabolic products and returns to
the heart via venous system.
The "pumping" of
blood takes place by alternating the phases of systole and
diastole of the heart chamber. In systole, the
heart chamber contracts and blood flows from the heart chambers
into the arteries. During the relaxation phase - diastole
- the muscles of the ventricles weaken and the heart fills with
blood with passive pressure. Each systole expels about 70 ml from
the heart. blood (so-called stroke volume). The amount
of water that the chamber pumps per minute is called
volum minute heart - cardiac output.
- Heart valves
act as one-way valves that allow blood to flow in only
one direction, while closing in the opposite direction and
blocking the backflow. There are 4 valves in the heart: - A double-
valve (mitral) valve between the left atrium and the left
ventricle; - Tricuspid (3 spikes) valve between the
right atrium and the right ventricle; - Aortic valve at
the interface of the left ventricle and aorta; - Crescent pulmonary
valve in the right ventricle in the lung. In order for the valve
to function properly, a sufficiently large opening for blood flow
must be created when it is opened, and when it is closed, it must
fit snugly to prevent blood flow back. A common disorder is the insufficiency
of the valves, when part of the expelled blood returns - the
so-called regurgitation, during which the heart must
then pump it again. This reduces the pumping efficiency and the
heart is overloaded.
- Heart muscles
The driving element of pumping is the heart muscle - the
myocardium, which drives the heart's pumping
activity with its regular contractions. It is a transversely
striated, highly powerful muscle. They are made up of cardiac
cells by cardiomyocytes. The strongest heart
muscle is in the left ventricle, which must expel blood into the
great circulation under considerable pressure.
- The
vascular supply of the
heart
In order for the heart muscle to work, it needs oxygen and
nutrients. The vascular supply of the heart muscle with
oxygenated blood is provided by two coronary coronary
arteries emanating from the aorta. They branch into a
network of vessels that surrounds the myocardium and resembles a
wreath in shape.
When some sections of the coronary arteries are narrowed (mainly
due to atherosclerotic plaques or embolizations), the vascular
supply of the heart muscle is reduced - ischemic heart
disease. Ischemic necrosis - myocardial
infarction - occurs after 20-40 minutes with complete
closure of the artery, in which irreversible death of the heart
muscle occurs in the basin of a closed vessel.
- Control of cardiac activity
The contraction of the heart muscle is stimulated by electrical
impulses. The control of heart activity is largely autonomous
- electrical stimuli for myocardial contraction are generated and
conducted in the heart wall, in the cardiac conduction system.
The main source of excitement is the sinoarthritic node
- a cluster of cells in the wall of the right atrium near the
venous canal. This node is affected by the autonomic (vegetative)
nervous system from the cardioregulation center in the brainstem,
in the elongated spinal cord (hypothalamus). The signal is
divided into two Tawar arms in the interventricular
septum, right and left, which faces the myocardium and spreads
excitement along the walls of the ventricles. These electrical
excitation signals can be sensed using an ECG.
Cardiovascular
pathology
Ischemic heart
disease consists of a narrowed lumen of the coronary
arteries of the myocardium due to atherosclerosis, which results
in impaired perfusion of the heart muscle. Severe
reduction in perfusion is manifested by angina pectoris,
complete closure leads to myocardial infarction . ......
Defects of the
heart valves consist either of a narrowing (stenosis) or
of their insufficiency, especially of the mitral or
aortic valve. This leads to backflow - regurgitation,
which reduces the efficiency of the heart's pumping function.
Valves can be affected as part of birth defects, but also as an
acquired disability in infectious endocarditis.
Heart rhythm
disorders, also called arrhythmias, can
be caused by a disturbance in the production of electrical
arousal, or a disturbance in the propagation of arousal. More
severe arrhythmias are corrected using a pacemaker.
Disorders of
myocardial contractility - hypokinesia, akinesia,
asynchrony, dyskinesia (or aneurysm) .....
Intracardiac shunts
are openings - defects - in the heart wall (septum) between the
ventricles or atria. ......
In connection with the above-outlined function of
cardiac activity and its disorders, cardiological
diagnostics performs in three basic directions :
1. Acoustic diagnostics of cardiac echoes of
systolic-diastolic function using a stethoscope and diagnostics
of electrical activity of the heart using
electrocardiography ECG. They are the oldest cardiological
methods. They are now being approached by ultrasound
sonography.
2. Diagnosis of central hemodynamics
- measurement of blood flow through the heart cavities and large
vessels, detection of intracardiac shunts and heart valve
insufficiency, including assessment of their severity.
3. Diagnosis of myocardial perfusion
- ischemic heart disease, ischemic myocardial viability ....
Nuclear medicine can offer cardiology four
diagnostic circuits :
- Methods examining systolic-diastolic function
of the heart as "pumps" can demonstrate overall and
regional impairment of heart wall motility or synchronization
with electrical activity of the heart, determine the overall
"performance of the heart pump". It is a equilibrium
ECG-gated ventriculography and SPECT of the myocardium.
- Examination of central hemodynamics -
blood flow through the heart cavities and large vessels. After
the application of the bolus of the
radioindicator, it is possible to monitor the dynamics of blood
flow through large vessels, filling of atria and ventricles,
including the detection of incacardiac shunts,
to determine the cardiac output,
cardiopulmonary blod volume, flow times and other
important hemodynamic parameters.
- Examination of the regional blood flow of the
myocardium, at rest and under load, allows to diagnose ischemic
heart disease, its location and severity.
- Verification of myocardial viability
damaged by ischemia. It is important for planning revascularization
procedures (by-pass, angioplasty) - revascularization only
makes sense in the case of a viable myocardium (which is perhaps
only temporarily hibernated by ischemia), not in the
case of an already unviable (necrotic) myocardium.
Equilibrium
gated ventriculography
Purpose:
It is a dynamic scintigraphic method that provides comprehensive
information about the activity of the heart as a pump of
blood circulation. Changes in activity in individual
cardiac compartments - chambers and atria during their pulsation
in the cardiac cycle are displayed. Because the radioindicator is
evenly and stably "mixed" in the bloodstream, changes
in activity - and thus in the emitted radiation g - are directly
proportional to changes in the volume of the
ventricles and atria during pulsation. We can determine the
hemodynamic functional parameters of the heart chambers, display
the regional kinetics of the heart walls, determine the
regurgitation fraction of the left ventricle (along with radiocardiography).
The method is useful for assessing the impact of ischemic heart
disease or myocardial infarction, or cardiomyopathy, on
ventricular function. It is also used to determine the
cardiotoxicity of cytostatics in chemotherapy of cancer.
In continuous dynamic imaging,
the number of pulses accumulated during one cycle would be too
low to imaging the shapes and sizes of the ventricles and
determine their volume changes. Therefore, the ECG gating
technique is used: in addition to scintigraphic pulses, an
electrical ECG signal is also captured from the
camera, which appropriately controls (triggers,
"gates") the acquisition process. Gating pulses are
derived from the R-wave of the ECG and synchronize
periodic storage of scintigraphic images in defined areas of
computer memory. Gradual addition of corresponding images from
individual cardiac cycles creates the resulting set of images,
which represents the phase dynamic scintigraphy
of one "representative" cardiac
cycle, created by synchronous summation of several
hundred ongoing cycles (described in detail
in §4.4 "Gate phase Scintigraphy"). By computer evaluation of
this phase scintigraphy, we can then assess the pulsation
of the walls of the ventricles and atria and create volumetric
curves during the cardiac cycle, from which we can
determine a number of quantitative parameters of
systolic-diastolic heart activity.
Radiopharmaceuticals:
A radioindicator should be used that is maintained at a
sufficient period of time a stable concentration and does not
leak from the bloodstream. They are 99mTc-labeled erythrocytes, which can be
prepared in two ways: 1. Laboratory in vitro
from a blood sample, wherein the labeled erythrocytes 99mTc is reinjected
back to the patient. 2. In vivo, in which the
patient is first administered the dissolved tin salt and after
about 15 minutes the required 99mTc-pertechnetate activity is administered. Tin ions Sn2+ will allow the
binding of technetium to red blood cells in the circulation.
Execution:
After application of approx. 400 MBq of radiopharmaceutical is
scanned by a camera detector, aimed at the heart area in the LAO
projection at an angle of about 35-50°, so that the ventricular
septum is approximately perpendicular to the plane of the
detector. The patient has attached ECG electrodes
(cardiomonitor), the R-wave output of which is connected to the
camera's synchronization circuit. Let's wait for the heart rate
to stabilize. We acquire in the ECG-gated mode
so that the heart cycle is divided into about 16-32 images,
reserved in the memory of the acquisition computer. We record
about 500-800 heart cycles, while cycles with premature or
delayed R-wave are eliminated. We can perform the examination at
rest and in ergometric or pharmacological load.
Evaluation:
In the simplest case, the regional motility of
the left ventricular wall can be assessed visually by means of cinematographic
projection of individual images of a representative cardiac cycle
in rapid succession (which makes visible the movement of the
heart sections - "heartbeat"). It can be assessed
semiquantitatively using the contour method, where the
evaluation program plots the contour of the chamber
in the end-diastole ED and end-systole ES into a single image. On
the mutual relation of these contours we can recognize disorders
- hypokinesia, akinesia, dyskinesia ( Fig.3.1.2 in "Radionuclide ventriculography"). Furthermore, we can construct parametric
images distribution of a certain parameter in the organ.
The simplest is the heart stroke image (image of
pulse volume - difference of ED-ES images) and paradox
image created by subtraction of ES-ED images, on which
the atria are physiologically imaged and pathologically
dyskinetic areas of the ventricle (which do not empty in systole
but, on the contrary, increase). Furthermore, it is possible to
compile an image of the ejection fraction, resulting
from the image of heart rate by dividing by the image of the
ventricular end-diastole (ED-ES)/ED. The most accurate analysis
of cardiac cycle dynamics is provided by regional Fourier
analysis using sine and cosine functions with certain
amplitudes and phases in each pixel. We obtain two parametric
images: the amplitude image, each site of which
is proportional to the intensity of pulsation (local heart rate
volume) and the phase image, expressing the
time-phase shift (delay) of the onset of myocardial contraction
at a given location, compared to the arrival of the ECG R-wave - Fig.3.1.3 , 3.1.4 in
"Radionuclide
ventriculography".
On the ED and ES images of the
representative cycle, we mark (manually or with the help of
mathematical algorithms, including taking into account parametric
images) the areas of interest (ROI) of the left
ventricle, or even right ventricle and area of tissue background.
The computer program creates a chamber volume curve
from which important hemodynamic parameters are
calculated: ejection fraction, heart rate, cardiac output,
end-diastolic and residual volume of the ventricle, ejection and
filling velocities of the ventricle - see pictures below. These
parameters are especially important for the left ventricle; for
the right ventricle, which has a less regular shape, accurate
determination is more difficult.
Mathematical analysis and computer evaluation of
radionuclide ventriculography is described in detail in §3.1
"Radionuclide
ventriculography" of the book
"OSTNUCLINE".
| Mathematical analysis and complex evaluation of radionuclide ventriculography | |
 |
|
| Evaluation:
On phase scintigraphic images of the cardiac cycle, nor on Fourier images of phase and amplitude, we do not observe regional heart wall motility disorders. Conclusion: |
Here are examples of the evaluation of normal á and heavily pathological â radionuclide ventriculography.
| Mathematical analysis and complex evaluation of radionuclide ventriculography | |
 |
|
| Evaluation:
On phase scintigraphic images of the cardiac cycle and on Fourier images of phase and amplitude we observe the following regional left ventricular wall motility disorders : hypokinesia of
segment : Virtually all except posterolat. Conclusion:
|
Dynamic
Bolus Angiocardiography
Purpose:
Rapid dynamic scintigraphy of the passage and dilution of a
radioactive bolus through the right heart, lungs, and left heart,
which provides information about the dynamics of blood
flow in cardiac structures and large vessels. By
analyzing this dynamics, we can obtain quantitative parameters of
chamber function, their volume parameters, detection and
quantification of intracardiac shunts. Together
with radionuclide ventriculography, the regurgitation
fraction of the left ventricle can be determined.
Radiopharmaceuticals:
Ordinary 99mTc-pertechnetate or better 99mTc-DTPA can be used for dynamic angiocardiography alone.
If gated ventriculography is subsequently performed (eg to
quantify regurgitation), 99mTc-labeled erythrocytes must be used as described above
for ventriculography.
Execution:
Application of tracer (about 400 to 800 MBq) are done under a
camera, directed at the area of the heart and lungs in the right
oblique slope detector cameras 30-45° (in
this projection, the images of the ventricles, atria, lungs and
aorta are optimally separated and distinguished). It is applied to the shortest possible vascular
distance to the heart - to the anecubital vein of the right hand,
to the subclavian vein or to the internal jugularis. Since this
is a dynamic scintigraphy of fast process, it is necessary to
perform a so-called bolus application (lat. bolus = bite ): fast single
application of a radioindicator with high volume activity in a
small volume of approx. 0.5 ml., in a short time approx. 1 s. (with rinsing of several ml of physiological solution
using a three-way valve), with immediate
start of dynamic scintigraphy with a sufficiently high frame rate
(approx. 4 frames/sec.). We scan the fast phase for approx. 60-100 sec., then a
slower sensing of the equilibrium phase can follow (10 sec./frame for approx. 5 min.).
Evaluation:
By visual inspection of sequential images of the passage of the
bolus through the cardiac circulation, we can qualitatively
assess possible abnormalities, especially premature circulation
and recirculation, which could be caused by heart shunts. Then we
mark the regions of interest (ROI) and create curves
distribution of the radio indicator from the right and left
ventricles, right atrium, lungs and possibly aorta.
To detect and quantify
the LR shunt, we use the time course of radioactivity in
the lungs - pulmogram. Under normal
circumstances, on this pulmogram, in addition to the sharp peak
of the first flow, after about 30-50 sec. appears only a low
broad peak of systemic recirculation, caused by the return of the
radioindicator through the systemic circulation back to the
heart. However, if an LP short circuit is present, another premature
recirculation peak will appear soon after the peak of
the first flow (or in the case of a small shunt, only the
extension of the descending arm of the curve), caused by
recirculation of shunt-passed blood from the left ventricle to
the right ventricle and then to the lungs. By mathematically
decomposing the pulmogram into the curve of the first pass,
system recirculation and short-circuit recirculation, we can quantify
the magnitude of the shunt using the ratio of
short-circuit flow and lung flow Qz/Qp (without
shuntt is close to 0) or ratio of lung flow and system flow Qp/Qs (without shunt is approaching 1) -
for details see "Bolus radiocardiography",
Figures 3.2.3 and 3.2.4. From
the right and left ventricular curves, we can determine the mean
transit time of the central circulation and the cardiopulmonary
blood volume. If a peak of premature circulation is present
on the aortic curve, the right-left shunt can be
detected and quantified by decomposition of the curves.
If the equilibrium phase was
sensed, by analyzing the curve from the left ventricle, it is
possible (a combination of the dilution and
Stewart-Hamilton principles - see "Bolus radiocardiography" fig. 3.2.1 and 3.2.2 ) to detrmine the cardiac
output. By analyzing the curve from the right ventricle,
the ejection fraction of the right ventricle can in
principle be determined. The combination of bolus
angiocardiography and gated ventriculography makes it possible to
quantify regurgitation in heart valves - to determine the regurgitation
fraction.
Mathematical analysis and computer evaluation of
radionuclide angiocardiography is described in detail in §3.2
"Bolus
radiocardiography" of the book
"OSTNUCLINE".
| Mathematical analysis and complex evaluation of radionuclide angiocardiography | |
 |
|
| Visual
assessment: After intrajugular bolus injection of the radiolabel, the unmagnified cavities of the right heart are imaged, followed by the filling of the unexpanded lung artery and pulmonary circulation, which empties reasonably rapidly into the normally configured cavities of the left heart and aorta. During the passage of the bolus through the left heart, we do not observe a premature occurrence of a radioindicator in the right heart and lungs. Conclusion: |
Here is the final protocol for the evaluation of angiocardiography without a short circuit á (but with regurgitation) and the intermediate results in the evaluation of a patient with a marked left-right shunt â .
| Mathematical analysis of LP shunt in the evaluation of radionuclide angiocardiography | |
 |
|
| By decomposing the pulmogram curve into primary circulation, systemic recirculation and premature recirculation, we observe a hemodynamically significant left-right shunt . A comparison of the bolus passage curves through the right atrium and ventricle indicates this shunt at the level of the ventricular septum. |
Myocardial
perfusion scintigraphy
Purpose:
It is a non-invasive method for the assessment of regional
myocardial perfusion and the effect of coronary stenosis for
blood supply to the heart muscle in the relevant basin - at rest
and during physical or pharmacological stress. It can be used to
detect ischemic heart disease, its location, extent and degree of
myocardial damage, assessment of myocardial cell viability.
Radiopharmaceuticals:
The basic requirement is that the radioindicator is efficiently
taken up by myocardial cells already at the first flow and fixed
in them (without redistribution) for the duration of
scintigraphy. In this case, the displayed distribution of the
radiopharmaceutical in the heart muscle is proportional to the
"supply" - the regional flow in the coronary artery.
However, this distribution also depends on the functional state
of the cardiomyocytes: the accumulation of the radiolabel does
not occur in areas where the heart cells are necrotic (or are
replaced by connective tissue after infarction). Thus, the
distribution of the radiolabel in the myocardium is proportional
to the regional blood flow through the myocardium and the
viability of myocardial cells.
Previously, mainly thallium, 201 Tl-
chloride, was used, as an analogue of potassium. It
enters myocytes via the cell membrane mostly through the active
process of the Na/K ATP (adenosine
triphosphate) system, partly also by
passive diffusion. The disadvantage of thallium is the low energy
of X and gamma radiation, which causes poorer resolution and
significant absorption of radiation in the tissue; also a
considerable radiation load (to which
abundant Auger electrons also contribute).
Approx. 100 MBq 201Tl is applied.
Note: In the near future, however, a
partial "renaissance" of thallium can be expected in
connection with the introduction of special semiconductor
CZK cameras in nuclear cardiology. These gamma cameras
have a higher detection efficiency for low-energy photon
radiation of about 73keV 201Tl.
Currently, 99m Tc - labeled radioindicators
are mainly used for scintigraphy of myocardial perfusion and
assessment of its viability, which provide significantly higher
quality images at lower radiation exposure. They are mainly 99mTc-isonitriles
- non-polar lipophilic complexes that enter myocardial cells by
passive transport and bind in their cytoplasm or mitochondria.
The radiopharmaceutical accumulates, depending on the blood
supply, in healthy viable cells, while in cells damaged (eg due
to ischemia) or even dead and replaced by scar fibrous tissue, no
accumulation occurs. The distribution of the radioindicator at
individual sites of the myocardium is then proportional to the
regional blood flow through the myocardium and the viability of
myocardial cells.
The concentration of these 99mTc-isonitrile
radiopharmaceuticals in myocytes remains stable for several hours
after i.v. administration and thus shows the immediate
perfusion situation of the myocardium at the time of
application, eg during exercise. The most common perfusion
radiopharmaceuticals are 99mTc-MIBI (2-methoxyisobutyl-isonitrile)
and 99mTc-Tetrofosmin (diphosphine
complex). Approx. 500-800 MBq of 99mTc MIBI or
tetrofosmin is applied.
PET
radiopharmaceuticals for perfusion myocardial scintigraphy
Myocardial scintigraphy using positron
emission tomography (PET) is performed relatively
infrequently. On the one hand, for more demanding PET
instrumentation, but mainly due to the difficult
availability of suitable positron radionuclides and
radiopharmaceuticals (discussed above in
§4.8., Section "Radionuclides and
radiopharmaceuticals for PET").
The simplest PET radioindicator for
perfusion is "labeled water",
in which ordinary oxygen 16O is replaced by a positron radionuclide 15O - ie water H215O. After application, it passes through
free diffusion through capillaries and cell membranes, so that
the distribution of radioactivity, measured by PET, is
proportional to blood flow. However, due to the high
concentration of radioindicators in the bloodstream, myocardial
imaging is not very contrasting. Another perfusion radioindicator
is ammonia 13NH3 labeled with nitrogen-13. Thanks to the high first
extraction (80%) and linear uptake according to blood flow in the
myocardium, it provides quality images. PET scintigraphy with
these short-lived radionuclides 15O (T1/2 = 2min.) and 13N (T1/2 = 10min.) is bound to centers with
a cyclotron and is used mainly for research purposes.
The short-term positron radionuclide rubidium
82
Rb is sometimes used for
scintigraphy of myocardial perfusion by the PET
method due to the fact, that it can be obtained from 82Sr/82Rb generator in the
workplace. It is applied in the form of chloride 82RbCl, behaving as an
analogue of potassium (similar to thallium 201 Tl mentioned
above; compared to thallium, however, rubidium-82 provides better
quality scintigraphic images at lower radiation exposure).
The most common PET
radiopharmaceutical fluoro-deoxyglucose 18FDG,
although it is mainly used for tumor imaging, but as a glucose
analogue, it is also taken up in the myocardium depending on
perfusion, ischemia and viability (see
"Metabolic scintigraphy, myocardial viability
imaging" below).
Execution:
The examination can be performed at rest or under load. At rest
conditions, the distribution of blood flow in the myocardium is
usually homogeneous, minor or moderate perfusion disorders do not
manifest. If the coronary stenosis is not greater than about 90%,
the resting flow through the myocardium is sufficient to ensure
normal myocardial metabolism; we get a normal perfusion
scintigram of the myocardium, despite possibly presence of
ischemic heart disease. Disorder of myocardial perfusion, even
without exercise, can only be observed in severe coronary artery
disease or after myocardial infarction.
Diagnostic sensitivity to perfusion disorders will only become
apparent during examination under stress, when
the requirements for oxygen supply to the heart tissue will
increase - for increase coronary blood flow. Normal coronary
arteries respond to this by visodilation and a corresponding
increase in coronary flow, which is reflected in an increased
concentration of radioindicator in perfusion scintigraphy.
However, pathologically narrowed coronary vessels are not capable
of this (according to their possibilities,
they are already dilated by compensatory mechanisms even at rest), the load has only a small effect on their flow. In the
basin of the coronary artery, which is affected by
hemodynamically significant stenosis, relatively lower perfusion
is manifested during stress than in the surrounding parts of the
myocardium - on the scintigram this place appears as a perfusion
defect in the myocardium, or at least as a reduction in
radiopharmaceutical distribution.
Therefore, i.v. application of the radiopharmaceutical is
performed during exercise, either physical (usually a bicycle
ergometer) or pharmacological - application of vasodilators
(dipyridamole, adenosine, dobutamine).
We perform our own
scintigraphy in about 10 minutes after application. Scintigraphic
scanning was previously performed planarly (in
LAO projection 30°, 60°) before the
introduction of SPECT tomographic scintigraphy, but SPECT
tomographic scintigraphy provides better differentiation of
individual parts of the myocardium (advantages
of tomographic scintigraphy over planar were discussed above in
§4.3 "Tomographic scintigraphy"). The most commonly used is
a two-detector SPECT camera *), whose detectors are set to an
angle of 90°. Approx. 32-64 projections are recorded at a total
angle of 180° around the patient - from the right front oblique
projection of RAO 45° to the left rear oblique projection of LPO
45°. An ECG-gated myocardial SPECT is performed
with R-wave synchronization of the electrocardiogram, analogously
as described above for gated ventriculography, we captures about
500 cycles.
*) Single-purpose special types of cardiological cameras
optimized for myocardial scintigraphy have also been developed.
At some workplaces, perspective semiconductor CZK cameras
are beginning to be used for SPECT myocardium (§4.2., Part "New and alternative physical and technical
principles of scintillation cameras",
passage "Semiconductor
multidetector cameras",
Fig.4.2.10 on the right). When using them,
it is sufficient to apply less than half of the usual activity,
while reducing the examination time.
If
stress perfusion scintigraphy is normal, resting scintigraphy is
no longer necessary.
Evaluation:
On tomographic images of coronary, sagittal and transverse
sections, the myocardium is displayed *) in the form of more or
less closed "rings" or "rolls" or
"horseshoes", on which we can visually
evaluate the distribution of radioactivity - assess the size,
number and location of perfusion defects and
hypoperfusions.
* ) In the pictures we can clearly see only the thicker wall of
the left ventricle, not the thinner wall of the right ventricle.
For the semiquantitative
evaluation is often used structure so-called polar maps
(slang "bull's eye"): coronal slices perpendicular to the short axis of the
left ventricle are transform and sum to each other to form
concentric circular profile with a tip in the center. The
brightness (or color) of the resulting circular area is modulated
by the different concentration of the radioindicator shown in the
summation of the individual layers. These profiles are stored as
concentric rings in a new circular image. This gives a clear
normalized polar map of the distribution of activity in the
myocardial wall - a map of regional perfusion of the
myocardium (in polar coordinates
centered in the apex), which is divided
into segments corresponding to the basin of
individual coronary arteries (according to
international recommendations, 17 segments are used). The relative perfusion values in the individual
segments are compared with the corresponding values in normal
patients stored in the normal database. This
results in relative indices - the so-called scores,
which help determine the severity of the myocardial perfusion
disorder (and possibly the corresponding
risk).
Visual images and polar maps are evaluated in
scintigraphy under stress and at rest.
In the case of ECG-gated SPECT myocardium, in addition to
perfusion, we can also determine the ejection fraction
of the left ventricle.
 |
Evaluation of stress +
rest scintigraphy of myocardial perfusion with 4DM SPECT program. We observe a significant reduction in perfusion in the basal segment of the lower wall, partially reversible (results from a comparison of polar maps at rest and stress. (scintigraphic
images were taken by |
Metabolic scintigraphy,
imaging of myocardial viability
Perfusion scintigraphy alone (showing hypoperfusion sites), or
analysis of general and regional contractile systolic function
(or dysfunction), may not be able to assess the maintenance of
myocardial tissue viability, which may be temporarily hibernated
due to hypoperfusion. To assess the function and condition of the
myocardial tissue itself, myocardial cells, it
may be useful to visualize metabolism glucose,
fatty acids or amino acids. Appropriate biochemically active
compounds labeled with radionuclides, especially positron
isotopes of biogenic elements, are used for this purpose. These
imaging methods have the ability to independently (separately or
simultaneously) assess blood flow and metabolism. Areas of
myocardium with reduced flow, but preserved metabolism can thus
be recognized - revascularization may be useful here.
In clinical practice, PET
examination of myocardial glucose metabolism
using 18F-FDG (fluorodexyglucose) is sometime
used. Under normal circumstances of a well-perfused viable
myocardium, myocytes gain the necessary energy mainly by
beta-oxidation of fatty acids. However, in ischemia,
anerobic glycolysis is becoming more important as a source of
energy for the work of cardiac cells. After i.v. administration, 18F-FDG accumulates to
an increased extent in the ischemic, but viable, areas of the
myocardium, while it does not accumulate in the normally perfused
areas (because glucose is not used to obtain energy there). FDG
also does not accumulate in the non-viable or necrotic myocardium
because metabolism does not take place there at all. By comparing
between regional blood flow and metabolism, we get information
about normal, hibernating and necrotic myocardium. In the case of
ischemic defects with preserved viability, it is
useful to perform revascularization (by-pass or
angioplastiy, stent), after which there is a "revival"
of these sites and often an improvement in myocardial
contractility and an increase in overall cardiac performance.
In particular for research and
experimental studies, imaging of the distribution of free labeled
fatty acids such as 123I- labeled BMIPP penta- and hexadecanoic acid
derivatives for SPECT is used to assess metabolism. For PET, it
is 11C-palmitate
for fatty acid metabolism and 11C-acetate (which is incorporated
into the Krebs cycle) for oxidative
metabolism.....
Receptor
scintigraphy of the myocardium
The spread of excitations in the myocardium and the regulation of
coronary flow are determined by the function of the sympathetic
nervous system in the heart. This function depends, among other
things, on the distribution of receptors,
especially noradrenaline receptors. The distribution of these
receptors can be visualized by 123
I -labeled MIBG, which binds
to them. ...........
Myocardial amyloidosis
scintigraphy
Amyloidosis *) is a systemic disease, caused by
a conformational change of the geometric structure of some
originally soluble proteins into an insoluble form of amyloid
fibrils, which can be deposited in the interstitial
areas of various tissues and organs - brain, heart,
kidneys.... This can adversely affect their structure and
physiological functions.
*) This misleading name
(Greek amylon = starch) arose from the fact that it
behaved similarly to starch when stained with Lugol's solution.
Later, however, biochemists showed that amyloid has the chemical
composition of proteins.
Cardiac amyloidosis is caused by the
deposition of insoluble proteins in the form of amyloid
fibrils in the intercellular spaces of the heart myocardium.
It leads to thickening of the heart wall and deterioration of its
contractility. The most common types of cardiac amyloidosis are
transthyretin (TTR) and light chain (AL) protein amyloidosis.
Purpose :
It is a non-invasive method for revealing the presence and
severity of deposition of insoluble amyloid proteins in the
myocardium, which could be the cause of deterioration of heart
function (cardiomyopathy). It makes it possible to distinguish
TTR amyolidosis from other causes of thickening of the heart
chamber walls (seen on echocardiography).
Radiopharmaceuticals :
In planar and SPECT scintigraphy, osteotropic
radiopharmaceuticals such as 99mTc-DPD (99mTc-3,3-diphosphono-1,2-propanedicarboxylic
acid), 99mTc-pyrophosphate,
or 99mTc-HMDP (hydroxy-methylene-diphosphonate)
are used here - see §4.9.7 "Scintigraphy of
the skeleton". These radiopharmaceuticals are accumulated not only in
the skeleton, but also in the extracellular space in the
myocardium, filled with fibrils of amyloid proteins.
Radioindicators 18F-florbetapir, 18F-florbetaben and 18F-flutemetamol are used in PET.
Execution :
After i.v. application of approx. 200 MBq radioindicator, static
scintigraphy of the chest region in AP projection is
performed in approx. 2 hours. It can also be part of whole-body
scintigraphy of the skeleton (cardiac
amyolidosis can sometimes appear even as a secondary finding in
classic whole-body scintigraphy of the skeleton). For a more detailed assessment of the anatomical
correlation, it is also advisable to obtain a SPECT/CT
scintigraphy of the chest.
Evaluation :
On scintigraphic images of the chest, we assess how differently
the radiopharmaceutical accumulated in the skeleton - in
the rib bones - and in the myocardium. The presence and
severity of cardiac amyloidosis is often assessed here using an
empirical so-called Perugini score :
Perugini score 0: The
osteotropic radiopharmaceutical was captured only in the
skeleton, the heart myocardium is not shown. Scintigraphy here is
not indicative of cardiac amyloidosis.
Perugini score 1: Uptake
of the radiopharmaceutical in the myocardium is present, but less
than in bone. It is a suspected finding of AL or TTR amyloidosis (endomyocardial biopsy should be used to confirm or
refute).
Perugini score 2: The
same or greater uptake of the radiopharmaceutical is observed in
the myocardium than in the skeleton. It is an indication for
TTR-amyolidosis.
Perugini score 3: Significant
uptake of the osteotropic radiopharmaceutical in the thickened
myocardium is present, with greatly weakened or absent uptake in
the skeleton. It is highly specific for TTR-amyolidosis.
Here are examples of chest scintigraphic
images for different amyloidosis scores (they
are older, lower quality planar images...)
:
PET scintigraphy has not yet shown significant progress over planar/SPECT scintigraphy. However, some results show with PET with 18F-florbetaben that images obtained a few minutes after application could help distinguish AL from TTR amyolidosis..?..
4.9.5. Lung scintigraphy (nuclear
pneumology)
The lungs (Latin pulmo
, Greek pneumo ) are a key
respiratory organ in higher animals and humans. They exchange
gases - especially oxygen and carbon dioxide *), between
blood and air. The chain [ventilation of the pulmonary alveoli ® diffusion of
gases through the alveolocapillary membranes ® perfusion of the
lungs ® blood circulation] transports oxygen
from the air to the cells of tissues and organs and removes
carbon dioxide from the tissues into the atmosphere.
*) The main source of energy for cells
during metabolism is oxidation (especially of
glucose), which produces "energetic" molecules such as
ATP (adenosine triphosphate), the "waste" products are
mainly water and carbon dioxide. Thus, gas exchange is required
for the metabolism to function - oxygen supply and carbon dioxide
removal. In higher organisms, this gas exchange is not sufficient
by passive diffusion, but takes place by active breathing
(respiration, ventilation) of air from the atmosphere through the
lungs (in fish by oxygen exchange from the water in the gills).
The lungs have a spongy
consistency, they consist of more than 300 million pulmonary
cellars - alveoli, which are small hollow
thin-walled sacs (about 150 mm in diameter). Their wall - the alveolocapillary
membrane - is formed by one layer of thin cells,
type I pneumocytes (wall thickness is about 1 mm). The total area
of the alveolocapillary membrane is about 60 m2. There are also
thicker type II pneumocytes in the alveolar wall, which
produce substances that reduce surface tension (surfactant) and macrophages,
which phagocytose dust and foreign particles.
Respiratory gases diffuse through the
membrane of the alveoli in the direction of pressure and
concentration gradients; depends on the partial pressure of these
gases in the inhaled air and in the non-oxygenated blood flowing
in the capillaries around the alveoli. Oxygen has a lower partial
pressure in deoxygenated blood and therefore passes through the
membrane from the alveoli to the blood. Carbon dioxide, on the
other hand, has a higher partial pressure in the venous blood and
therefore passes from the capillaries through the membrane into
the air in the alveoli, from where it is exhaled.
Anatomically, the lungs are a pair
organ - the left and right lungs. They are divided into lobes
(3 lobes have the right lung, 2 lobes have the left). The lobes
are further divided into bronchopulmonary segments, each
of which has its own air and blood supply.
Air is fed
into the lungs (and removed) trough bronchi,
which are tubes with cartilaginous walls, that branch many
times inside the lungs into even finer tubes, down to the
alveoli. Airflow in the lungs - respiration
- takes place alternately inhalation (inspirium) and
exhalation (expirium). When inhaling, the contraction of the
intercostal muscles and the diaphragm increases the volume of the
thoracic cavity, and new air is drawn into the lungs by the
airways due to the negative pressure. During exhalation, the air
used is blown out of the airways into the atmosphere by the
passive pressure when the chest is contracted.
Blood
circulation of the lungs - pulmonary perfusion - starts
the pulmonary artery, emanating from the right
ventricle and delivering non-oxygenated blood. In the lungs, they
branch many times up to the capillaries that
surround the alveoli. Here, oxygen diffuses into the blood and
carbon dioxide into the alveoli. The vessels carrying the
oxygenated blood connect in the pulmonary veins, which open into
the left atrium. From there, the left ventricle pushes oxygenated
blood through the aorta into the bloodstream, distributing it
throughout the body. Deoxygenated blood, which is also enriched
with carbon dioxide, then leads through the venous system to the
right atrium, from where the right ventricle returns it to the
lungs for further oxygenation and CO2 removal - small cardiac circulation ( pulmonary,
cardiopulmonary), continuing to the left atrium. Oxygenated
blood is then pumped through the left ventricle into the large
blood circulation - systemic. Normally, almost the same
amount of blood flows through the pulmonary circulation as the
systemic circulation, but under lower pressure.
Pathology of the lungs
and respiratory system :
Pulmonary edema
("emphysema"), as a result of pulmonary hypertzenze,
increased pressure in the pulmonary circulation, left ventricular
failure, ....
Pulmonary embolism is a blockage of the pulmonary
vessels from the venous system or the right heart due to
thrombosis. It leads to hypoperfusion or aperfusion of
certain parts of the lungs. Sudden obstruction of the middle lung
branches is called a pulmonary infarction.
Bronchial asthma - spasm and bronchial constriction
associated with dyspnea ........
Pneumoconiosis is a
ventilation disorder caused by fibrosis due to prolonged
inhalation of dust, such as silica (silicosis),
popularly called "dusting of the lungs". .......
Inflammatory and infectious diseases , tuberculosis.....
Tumors - primary lung cancer, metastases of other tumors
to the lungs....
Three
basic conditions must be met for the order functioning of the
respiratory system: 1. Good pulmonary perfusion;
2. Good ventilation of the pulmonary alveoli; 3.
Proper function of the alveolar membrane. Methods of nuclear
medicine also focus on the diagnosis of these components of the
respiratory system.
Pulmonary perfusion
scintigraphy
Purpose:
Imaging the distribution of capillary perfusion in the lung
parenchyma, revealing regional perfusion defects due to
embolization or other involvement of the pulmonary arterial river
system (compression by inflammatory or tumor foci, pleural
effusion, .....).
Radiopharmaceuticals:
99mTc-MAA (labeled macroaggregate of
albumin, or albumin microspheres).
Execution:
After iv application of approx. 200 MBq of radioindicator, static
scintigraphy of the lung area is performed in 4-6
projections, the most important of which are PA and AP
projections.
Evaluation:
On the images we visually evaluate the homogeneity of the
distribution of the radio indicator in the lung wings and
possibly local or segmental defects that would
indicate hypoperfusion due mainly to embolization.
Regional quantification of relative perfusion of
individual parts and segments of the lung can also be performed.
Pulmonary ventilation
scintigraphy
Purpose:
Imaging the distribution of alveolar ventilation of the lung
parenchyma, to reveal regional ventilation defects for
peripheral airway patency - due to silicosis or other disorders.
It can also be used to assess the contribution of the function of
individual parts of the lungs to the overall respiratory function
(when deciding on surgery).
Radiopharmaceuticals:
- Inert radioactive gases: krypton 81mKr
, xenon 133Xe
;
- Radioactive aerosols marked 99mTc .
Procedure:
Scintigraphic examination of pulmonary ventilation can be
performed in two ways :
- Inhalation of
radioactive aerosol
Before scintigraphic examination of pulmonary ventilation, the
patient breathes for about 10 minutes air with aerosol 99mTc-DTPA
(activity in the nebulizer approx. 1000
MBq), the particles of which are trapped in
the alveoli. Then we take static images of the lungs in
individual projections under the camera.
- Inhalation of radioactive gas
Ventilation scintigraphy of the lungs is more preferably
performed by inhalation of radioactive inert gas - krypton
81m
Kr (activity in the generator
approx. 5 GBq) or xenon 133Xe (if appropriate respiratory equipment
is available, see below), with simultaneous scintigraphic
scanning.
81mKr is obtained from
the generator 81Rb/81mKr. The principle of this generator is
in the left part of figure. The parent rubidium 81Rb is fixed in the
solid phase in a small column, through which a stream of elution
air is passed by means of a fan (air
pump with adjustable power). Through the radioactive decay of
rubidium-81, is continuously released daughter gas krypton 81mKr, which is
entrained by the passing air and led into a breathing
mask, from which the patient inhales a mixture of air
and radioactive 81mKr. One-way valves are included in the circuit
of the breathing mask, further upstream of the outside air mixing
valve to ensure free breathing. The exhaled air is led into
an extinction vessel (volume
approx. 30 liters), from which, due to the
very short half-life of 81mKr, practically non-radioactive air emerges.
During this examination of pulmonary
ventilation, inhaled air with a trace content of
radioactive 81mKr enters the pulmonary alveoli, while the
emitted radiation gammaof 191keV is scanned by a gamma
camera. The scintigraphic image of the site of reduced
activity shows areas of the lung with impaired
ventilation, where krypton-81m, and thus no air, does
not get (either at all or reduced).
Generator 81Rb/81mKr for scintigraphy of
pulmonary ventilation.
Left: Principle of generator operation.
Middle: One of the technical
arrangements of the Rb-Kr generator. Right:
Disintegration scheme 81Rb and 81mKr; in
the black field is the scintillation spectrum of gamma radiation 81mKr.
Evaluation:
On the images we visually evaluate the homogeneity of the
distribution of the radio indicator in the lung wings and
possibly defects, that would indicate ventilation
disorders due to eg coniosis. Regional
quantification of relative ventilation of individual
parts and segments of the lungs can also be performed.
Dynamic ventilatory
scintigraphy of the lungs
is a relatively complex method for the analysis of
respiratory function of the lungs. The patient's
breathing is connected to a closed circuit spirometer,
into which approximately 300 MBq 133Xe is applied and at the same time dynamic lung
scintigraphy is scanned in the PA projection.
A more detailed description of
the design and evaluation of dynamic ventilation scintigraphy is
in §3.11b "Dynamic lung scintigraphy (133-Xenon
ventilation)" of the
OSTNUCLINE book. Due to the considerable complexity and
instrumental demandigness of the method, as well as the difficult
availability of 133Xe, dynamic ventilation scintigraphy is practically no
longer performed...
Combined perfusion +
ventilatory pulmonary scintigraphy
For a more comprehensive assessment and differential diagnosis of
pulmonary pathologies, it is useful to compare perfusion and
ventilatory static scintigraphy and to correlate the
corresponding images in individual projections. In addition to
separate pulmonary perfusion (with 99mTc MAA) and separate pulmonary ventilation (with 99mTc-aerosol, or with
gaseous 81mKr),
simultaneous combined perfusion + ventilation
scintigraphy is often performed - application of 99mTc-MAA and then
alternating inhalation of 81mKr , with simultaneous scintigraphy (with the analyzer window alternately swithed to 140keV 99mTc and 190keV 81mKr). All these scintigraphies are performed in a number of
different projections - the basic ones are AP and PA, as well as
oblique LPO, RPO, sometimes even lateral LL, RR. The resulting
scintigraphic studies then have 4, 6, 8, or 12 images :
| Computer evaluation of multistatic scintigraphy of combined pulmonary perfusion and ventilation | |
 |
|
| Visual
evaluation: When evaluating scintigraphic images of lung ventilation in all projections, we observe a homogeneous distribution of the radioindicator in both lung wings - without a defect . In scintigraphic images of lung perfusion, we observe an inhomogeneous distribution of the radioindicator in both lung wings with several areas of hypoperfusion, without segmental defects Conclusion: |
The procedure for computer evaluation of perfusion and ventilation lung scintigraphy is described in §3.11a "Static lung scintigraphy (perfusion, ventilation)" of the "OSTNUCLINE" book.
4.9.6 Scintigraphic diagnostics in oncology.
Scintigraphy of inflammation.
Imaging of tumor tissue is one of the most
important task of scintigraphic diagnostis. It serves both for primary
tumor diagnosis (in combination with other imaging methods),
helps in the planning of radiotherapy, allows
you to assess the response to treatment and the
success of therapy, during longer-term monitoring, it helps to
detect in time possible recurrence of tumors.
These individual aspects are discussed in §3.6 "Radiotherapy", section "Diagnostics
of cancer". In
scintigraphic tumor diagnostics we can use the following options
:
- Imaging the tumor as a defect in functional
tissue
after application of radiopharmaceuticals that accumulate
physiologically in healthy functional tissue but are little or
not absorbed in the tumor tissue. It then appears on the
scintigram as a "cold lesion" (photopenic lesions). It
is a non-specific method (it is not
possible to decide whether the defect is caused by a malignant or
benign structure) and is relatively less sensitive
(cold lesions are shown with less contrast and are more difficult
to recognise in images than "hot" deposits). It can be
used secondarily in liver or kidney scintigraphy. In lung
scintigraphy, we can observe local reductions or outages of
perfusion or ventilation due to oppression of blood vessels and
bronchi by lung tumors and metastases. In thyroid scintigraphy,
the functional parenchyma absorbs radioisotopes of iodine and 99mTechnecistan well,
while malignant tumors and benign dysfunctional adenomas appear
as "cold" focal defects in the background of the
parenchyma (see scintigraphic images in
§4.9.1 "Thyrological diagnostics").
- Scintigraphy of tumor metabolic
activity
depicting altered (usually increased) tumor cell metabolism, or
tumor-induced tissue metabolism in the immediate vicinity of
tumors. Imaging of the thyroid gland and its tumors based on the
metabolic uptake of radioiodine 131/123I is classic (§4.9.1 "Thyreological radionuclide diagnostics"). PET imaging of the
distribution of 18F-fluoro-deoxyglucose (FDG), or 18F-3-fluoro-3-deoxy-thymidine (FLT), or 18F-fluorocholine is
currently most commonly used for gamma-visual imaging of others
tumor metabolic activity. FDG is taken up in viable tumor cells
and, unlike glucose, does not exit the cells, thus providing contrasting
images of viable and proliferating tumor lesions.
PET imaging with 18F-FDG is very beneficial in hemato-oncology in the
diagnosis of lymphomas and multiple myelomas.
Semi-quantitative assessment of the metabolic activity of the
depicted lesions is often performed using the SUV
value (defined and discussed above in
§4.1, section "Scintigraphic
image quality - detectability of lesions",
passage "Quantification of
positive lesions on gammagraphic images - SUV"). PET scintigraphy should
be performed in hybrid combination with X-ray CT imaging
to obtain anatomical images in correlation with scintigraphically
imaged tumors. However, the increased accumulation of FDG is not
only specific for tumors, it can also be in inflammatory foci (see "Scintigraphy of inflammation"
below) .
|
Example
of PET/CT scintigraphy with 18FDG in a patient with lymphoma. ( PET / CT images were
taken by |
. -
Imaging of
non-specific binding of the radiolabel to tumors
Some radiopharmaceuticals show increased uptake in tumors and
metastases, and the mechanisms of these uptake are not well known
and are not specific to the tumor species. Increased
proliferation and metabolic activity of tumor cells or increased
permeability of tumor neoangiogenesis capillaries may contribute
to higher accumulation. Such a radiopharmaceutical is 67Ga-citrate, which
appears to increase uptake into viable tumor tissues of
lymphomas, melanomas, lung cancer and at the detection of their
metastases. However, it also accumulates in inflammatory lesions (see "Scintigraphy of inflammatory
deposits" below) . A
very important method of cancer diagnosis is skeletal
scintigraphy (see §4.9.7 below ) using osteotropic
radiopharmaceuticals, which allows very early detection of
skeletal metastases.
- Scintigraphy of special tumor
receptors
Some tumors contain specific receptors on cell membranes or in
the cytoplasm, mainly for peptides. Using these radiolabeled
peptides, the concentration of their receptors and thus the
respective tumor site can be scintigraphically imaged. It is used
here, for example, imaging of somatostatin receptors
in neuroendrocrine tumors, lung carcinomas, medullary thyroid
carcinoma, carcinoid, ... The most commonly used
radifarmaceuticals are 111In-pentetreoid and 99mTc-depreotide, or DOTA preparations labeled with 68Ga (PET gammagraphy).
For the diagnosis of prostate tumors, labeled ligands of the prostate-specific
membrane antigen PSMA - 68Ga-PSMA-11, most recently 18F-PSMA-1007, are used in a theranostic combination
with radionuclide therapy (ch. 3.6, section "Biologically
targeted radionuclide therapy", passage "Prostate
cancer "). Estrogens (such as
estradiol) labeled with 18F or 123I are rarely used for the diagnosis of hormone-dependent
breast cancer.
- Immunoscintigraphy
is based on the highly specific nature of antigen-antibody
immunological reactions. A monoclonal antibody (§3.6, passage "Monoclonal antibodies"), labeled with a suitable
radionuclide, binds selectively to the appropriate tumor
marker (antigen) after application, after which the
relevant tumor can be imaged by scintigraphy. ........ scintigraph. pictures ...add..... In more detail "Diagnosis
of cancer "...
Scintigraphic diagnostics can
be useful in monitoring the function of healthy
tissues and organs in connection with oncological treatment.
Radiotherapy not only affects the target tumor tissue, but can
adversely affect organs located in the irradiated area - radiotoxicity.
Systemic chemotherapy has side effects on many tissues and organs
- chemotoxicity. For the uncomplicated course of
oncological treatment, it is useful to monitor the function of
critical tissues and organs during and after therapy.
Scintigraphic diagnostics such as radionuclide ventriculography , myocardial perfusion , and dynamic
renal scintigraphy may also contribute
to this.
Scintigraphy
of inflammatory foci
In addition to tumor lesions, scintigraphy is also used in the
diagnosis of inflammatory foci. Active
inflammation is accompanied by hyperemia, increased metabolic
turnover, increased cellular fluid, and migration of leukocytes
to the site of inflammation. Several procedures are used for
scintigraphy of inflammatory deposits :
- Scintigraphy
with 67Ga-citrate, which first binds to
circulating transferrin in plasma after i.v. administration. Due
to hyperemia and increased capillary permeability, gallium bound
to the transport protein penetrates into the extravascular space
in the inflammatory focus and is then bound to lactoferrin and
taken up intracellularly in the lysosomes of neutrophilic
leukocytes. However, gallium citrate is also taken up in some
tumors (as mentioned above).
- Scintigraphy
after administration of 99mTc-exametazime, HMPAO, or 111In-oxine- labeled autologous leukocytes in
vitro, which then migrate and increase in concentration
sites of inflammation.
- Scintigraphy
using in vivo labeled antigranulocytes
monoclonal antibodies such as 99mTc-sulesomab and 99mTc-besilesomab that bind to leukocytes. Leukocytes,
including those so labeled, are increasingly concentrated at the
site of ongoing inflammation. These monoclonal antibodies of
murine origin may be at risk of undesired immunogenicity
upon repeated administration, leading to false negative results (immune anaphylactic reactions are unlikely in
diagnostic use due to small trace amounts of the substance
administered, in contrast to therapeutic applications) - discussed in §3.6, passage "Monoclonal antibodies").
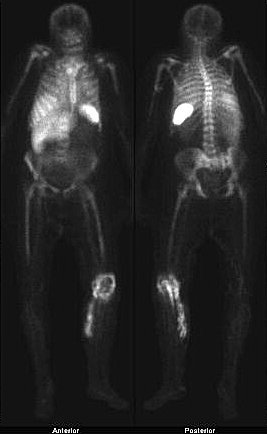 |
Scintigram of a patient with left
knee TEP inflammation using the 99mTc-besilesomab radioindicator. (scintgraphic images were
taken by |
- Scintigraphy using labeled somatostatin
analogues such as 111In-pentetreoid and 99mTc-depreotide. They bind to structures containing
somatostatin receptors - in inflammation they are lymphocytes and
macrophages. Otherwise, of course, they also accumulate in some
tumors (especially neuroendocrine).
- PET
scintigraphy after application of 18F-fluorodeoxyglucose (FDG), which
accumulates in inflammation due to the increased glucose
metabolic turnover that accompanies inflammation. However, FDG is
also taken up in viable tumors - which is the main use of FDG.
- 3-phase
scintigraphy of the skeleton in musculoskeletal
inflammation, showing, inter alia, regional hyperemia
accompanying osteomyelitis - infectious purulent
inflammation of the bone and bone marrow (see
the section "Dynamic (3-phase) scintigraphy of the
skeleton" below in §4.9.7).
4.9.7. Bone scintigraphy
The skeletal system - the skeleton - serves
primarily as a mechanical support and reinforcement of the
organism. In conjunction with the muscles that are
attached to the bones by tendons, it also mediates the body's locomotor
activity. In addition, some bones in their cavities - bone
marrow - provide space for hematopoietic tissues. Bone
is composed of cells of osteoblasts, osteocytes,
osteoclasts, fibrous and amorphous intercellular mass.
Osteoblasts
are cells of roughly cubic shape with numerous protrusions
through which they are in contact with each other. Bone metabolism
takes place in osteoblast organelles. Osteoblasts produce collagen
fibers and an amorphous (proteoglycan) intercellular mass.
They also produce alkaline phosphatase enzymes, which cause bone mineralization.
Osteoblasts are present in bone especially where bone tissue is
formed or rebuilt. During development, osteoblasts gradually lose
their organelles and protrusions and turn into elongated osteocytes.
Osteoclasts
are larger "breaking" cells that, by producing acid
phosphatase and collagenase, release bone minerals and disrupt
bone structure. This frees up space for new bone formation - they
help growth processes and bone remodeling.
Intercellular
bone mass it consists of bundles
of collagen fibers cemented by an amorphous proteoglycan mass,
which is mineralized in the finished bone tissue. The
mineral component consists of microscopic crystals of calcium
phosphate - hydroxyapatite, whose needles
are bound to collagen fibers. It is this mineralization,
that contributes to bone strength and hardness.
Overall, bone consists of an average of
60% minerals, 28% organic matter (of which about 4% fat) and 12%
water. The reduced content of the mineral component leads to
porous and less solid bone - the so-called osteoporosis.
Skeletal pathology
The most common disorders here are fractures -
arising from a mechanical force exceeding the mechanical strength
of the bone (in case of previous bone damage, eg osteoporosis,
the pathological fracture can be caused by a small
force).
Inflammatory bone diseases - osteomyelitis ....
Degenerative bone disease ....
Tumor bone changes
can be primary, arising from bone tissue - osteosarcoma
, chondrosarcoma , large cell osteoblastoma.
However, secondary tumors are more common - metastases
of other tumors to the skeleton; most often ca breast or
prostate.
Scintigraphic
diagnostics of the skeleton focuses primarily on the detection of
pathological conditions related to changes in bone metabolism.
This is especially important in tumor diagnosis during early
detection of metastatic infiltration into the skeleton and in
inflammatory and degenerative bone diseases.
Static scintigraphy of
the skeleton
Purpose:
This is a functional examination that shows the distribution and
changes in bone metabolism and the distribution of bone
reconstruction in order to reveal pathological processes of
tumor, inflammatory or degenerative.
Radiopharmaceuticals:
As osteotropic radiopharmaceuticals, labeled phosphate
complexes are used for single photon scintigraphy (planar,
SPECT), which bind mainly to the surface of hydroxiapatite
crystals, partly also to calcium phosphate. The most commonly
used is 99mTc-MDP (methylene diphosphonate), or 99mTc-HDP
(hydroxymethylenediphosphonate - oxidronate). 18F-sodium
fluoride (NaF) is used for PET imaging, which reacts
with hydroxiapatite to form fluoroapatite, which is incorporated
into the bone mineral component.
Execution:
After i.v. application of approx. 500-800 MBq 99mTc-MDP, the
radiopharmaceutical gradually accumulates in metabolically
functional bones, depending on regional blood flow and
osteoblastic activity of bone tissue. Scintigraphic imaging is
performed about 2-4 hours after application (when
only about 5-3% of the administered activity persists in the
bloodstream, so we can find a sufficiently contrasting image of
the skeleton with a low body background).
When using 18F-fluoride, about 100-300 MBq is applied and PET imaging
is performed as early as 1 hour after injection (fluoride has a faster absorption in the bones and a
faster breakdown of unbound radioindicator from the blood). Prior to the scintigraphy, the patient is urinated so
that the accumulated activity in the bladder does not
trans-illuminate trough the image of pelvic bones. Planar images
of either individual parts of the skeleton are taken in suitable
projections - targeted scintigraphy, or it is
better to first obtain whole-body planar scintigraphy
in the projection of PA and AP with a sliding movement of the bed
with the patient under the camera. Planar scintigraphy can be
supplemented by emission tomography of SPECT
"suspicious" sites. When using 18F-fluoride, of course, PET scanning is performed. For a
more accurate assignment of displayed pathological lesions to
anatomical structures, it is appropriate to perform X-ray CT
imaging with fusion SPECT/CT or PET/CT images on
hybrid instruments; it then allows to
specify the spatial location of active deposits, whether the
lesion is really in the skeleton and how to possibly extends
beyond the bone.
Evaluation:
The displayed distribution of the radiopharmaceutical in the
skeleton is not uniform, but is given by regional vascularization
and the intensity of bone osteogenesis. In places with more
intensive metabolism, there is a higher accumulation of
radiopharmaceuticals. Physiologically, these are sites with
growing bone in children, or bone regeneration after fracture.
Pathological changes in the skeleton are usually manifested by
locally increased accumulation of radiopharmaceuticals - "hot
deposits" osteoblastic, less often decreased
accumulation ("cold lesions""- osteolytic
processes without surrounding osteoblastic reaction). Symptoms of
pathology may also be an overall diffuse increase
in radiopharmaceutical uptake in metabolic bone diseases, bone
marrow involvement, or generalized massive tumor infiltration -
so-called "superscan",
excessively intense and contrasting skeletal imaging.
Pathological finding on the skeleton does not provide direct
information about the etiology of increased osteoblastic
activity. This may be inflammation, traumatic changes, tumors.
The importance of bone
scintigraphy, however, is early detection of skeletal tumors -
primary, but especially bone metastases. This
sites, behaving as osteoblastic lesions, are
shown as significant deposits (solitary and multiple) of
increased accumulation of osteotropic radiopharmaceuticals.
Left: Normal skeletal
scintigram of the skeleton. Right: Multiple metastases
(ca. breast) to the skeleton.
Evaluation of skeletal scintigraphy is
basically visual, but it is also possible to
perform a quantitative analysis of radiolabel uptake in selected
osteoblastic foci (expressed, for example,
as SUV - Standardized Uptake Value) and based on this to assess disease development and
response to treatment.
The procedure for computer evaluation of
static skeletal scintigraphy is described in §3.12 "Static skeletal
scintigraphy" of the book
"OSTNUCLINE".
Dynamic (3-phase)
scintigraphy of the skeleton
Purpose:
It is a combination of dynamic and static scintigraphy of a
selected area of the skeleton. It is used to assess the perfusion
of bones and surrounding tissues, to assess regional hyperemia
due to osteomyelitis, bone trauma, arthritis, bone tumors,
inflammatory lesions of the surrounding tissues.
Execution:
After rapid i.v. application of osteotropic radiopharmaceutical 99mTc-MDP, dynamic
scintigraphy of the examined area is started
immediately. Scintigraphy is performed in 3 phases :
1. The perfusion (angiographic) phase
("flow") detects the regional blood flow of the
monitored part of the skeleton and surrounding tissues,
2sec./frame for about 5 minutes.
2. Tissue phase "blood pool",
capturing the transition of the radiopharmaceutical from the
blood vessels "blood pool" into the extracellular space
of soft tissues and bones. We take about 10 images/30 sec.
3. The skeletal late phase is a
common static scintigram after 2-3 hours, the same as the static
skeletal scintigraphy.
Evaluation:
The procedure for computer evaluation of dynamic 3-phase skeletal
scintigraphy is described in §3.13 "Dynamic (3-phase)
scintigraphy of the skeleton" of
the "OSTNUCLINE" book, here we present only an
example of the result protocol :
| Computer evaluation of dynamic 3-phase scintigraphy of the skeleton | |
 |
|
| Visual
evaluation: After intravenous administration of 99m-Tc-diphosphonate, we first observe in the dynamic phase a good and symmetrical perfusion of the thigh areas, the left knee and tibia show increased perfusion with foci of (probably peristatic) hyperemia. In the further course in the skeletal phase, we observe deposits of increased accumulation of the radioindicator in the head of the left fibula, in med. condyle of the left tibia and in the lateral parts of the knee joint. Conclusion: |
4.9.8 Scintigraphic diagnostics in neurology
- CNS
The central nervous system (CNS) of vertebrates
consists of the brain and spinal cord. The brain
(encephalon) is the central governing organ of the
nervous system of all higher animals and humans. It manages and
controls most bodily functions, as well as perception, thinking,
memory, emotional and cognitive functions. In humans, the brain
has a volume of about 1500 cm3 and weighs an average of 1350 grams. Very complex
processes in the brain, as the most basic organ of the central
nervous system, take place on several levels. There are mainly
two basic groups of cells in the brain - neurons
and glia.
Neurons,
nerve cells, are the basic functional units of nervous tissue.
They are highly specialized, fully differentiated effector cells
that receive, transmit and process special chemical-electrical
signals (information), which allows the body to respond to
external stimuli. Numerous protrusions emerge from the basic cell
- the body of the neuron (it contains the
nucleus) - so-called dendrites (shorter
protrusions that are centripetal, transmit excitations to the
neuron) and axons (long protrusions that are
centrifugal, used to transmit excitations out of the neuron).
There are a large number of chemically controlled ion
channels and electro-chemically controlled signal channels
in the neuronal membrane. Individual neutrons are using synapses
functionally interconnected into complex neural networks.
Synaptic connections of neurons,
used to transmit excitations, take place between the nerve
endings of one neuron and the entrance membrane of another
neuron. Synapses have a presynaptic part, a synaptic
cleft and a postsynaptic part. The arousal created
by the irritation of a neuron first spreads across the axon in
the form of an electric charge. A special chemical substance - a neurotransmitter
(nerve mediator) is secreted from the synaptic
vesicles in the nerve ending - the terminal - due to an
electrical signal from the respective precursors, which causes a
synaptic potential on another neuron *). Neorotransmitters are
low-molecular substances, providing unidirectional transmission
of excitation from one controlling nerve cell (presynaptic) to
another nerve cell (controlled, postsynaptic), which can again be
a nerve or muscle cell, or a glandular cell. These substances,
when secreted from the presynaptic cell, diffuse through the synaptic
cleft to the membrane of the postsynaptic cell, where they
bind to neuroreceptors (lock-key system) and
elicit the appropriate cellular response.
*) Excitement transmission is an
electro-chemical process. The electrical signal
- the action potential - travels from within the
1st neuron through the axon to the points of contact
with the dendrites of 2.neuron through the synaptic
cleft. When the action potential reaches here, the chemicals neurotransmitters
are released, which after diffusion through the synaptic
cleft bind to the receptors of the postsynaptic cell, activate
other postsynaptic receptors, and create a postsynaptic
potential. The sum of a larger number of postsynaptic potentials
creates a new sufficiently high action potential, which
propagates to another neuron.
About 10
types of neurotransmitters are known, such as acetylcholine,
dopamine, serotonin, glutamic acid, aspartic acid, glycine,
somatostatin, ... For scintigraphic diagnostics, in particular, dopamine
signaling pathways (dopaminergic system) are available, which are
important for brain regulation of motor activities.
Upon termination of the interaction,
unbound neurotransmitters are actively transferred
("pumped") back to the presynaptic terminal via transporters
of a proteinaceous nature. In the cytosol of the neuron, they are
either catabolized or transported back to the synaptic vesicles.
The human brain contains about 100 billion (1011) neurons, between
which there are a huge number of about 1015 synaptic connections. All higher nervous activity,
including mental activity, is a manifestation of complex
biochemical reactions and electrical activities of neurons in our
brain **).
**) Neurons form neural networks through
elongated "dendritic" protrusions and axons that
provide contact with other neurons. These contacts allow an
electrochemical signal traveling through one nerve cell to
trigger a current wave in other cells. Because each neuron can
connect with thousands of other cells - both near and far, such
networks can take on a huge number of arrangements and degrees of
complexity. How consciousness emerges from clusters of our
neurons is still shrouded in mystery, but the basic outlines of
these mechanisms we can understand already now.
"Molecular imaging"
methods in nuclear medicine make it possible to visualize in vivo
the distribution and density of receptors and transmitters in the
brain (see "Receptor scintigraphy of
the brain" below) .
Glie (neuroglia)
are cells of the brain supporting tissue. The largest cells of
this species are astrocytes (astroglia)
that envelop the vessels of the CNS. Plasma astrocytes are found
in the gray matter, fibrous astrocytes are mainly in the white
matter of the brain and spinal cord. Oligodendrocytes
(olygodendroglia) are found mainly in the white matter and
produce myelin - a protein that envelops axons. Epyndimal
cells form the lining of the CNS cavities, in the choriedeus
plexus they produce liquor (cerebrospinal fluid). The
smallest glyal cells are microglia with a large
number of protrusions, which as part of the monocyto-macrophage
system have a defensive function, the ability to phagocytose.
From an anatomical
point of view, the brain consists of a brainstem
that connects to the spinal cord and continues
with the elongated spinal cord, the Valor bridge
(formed by transverse fibers of the cerebellum), the midbrain
and finally the terminal - large brain.
The terminal brain forms the largest section of the CNS. It
consists of two hemispheres, which are connected
to each other via the corpus callosum. The surface of
the hemispheres is formed by the gray cortex,
formed by neurons with numerous dendritic protrusions, the
interior of the hemispheres contains white matter
from bundles axons of neurons. Deep inside the
hemispheres of the terminal brain is the area of the gray matter
of the striatum (corpus striatum), where, among
other things, signal pathways for controlling physical activity
are formed. ..... .
Cerebrospinal
fluid or liquor is a clear colorless
fluid that fills the cavities in the CNS and the gaps between
nervous tissue and the envelope structures. It has a similar
composition to blood plasma. It is formed by active secretion by
ependymal cells in the choriedeus plexus (70%) and also by
filtration of blood plasma (30%) by chorioid capillaries. The
volume of cerebrospinal fluid is about 120-200 ml. It circulates
through the lateral chambers, the main 3rd and 4th chambers,
flows around the brainstem and spinal cord. Cerebrospinal fluid
provides an optimal homeostatic environment (constant ion
concentration) for CNS cells, protects the brain from mechanical
shocks and changes in pressure and temperature, metabolically
ensures the removal of some products of catabolism and supplies
brain cells with some bioactive substances.
Vascular supply to the
brain
The complex and intense signaling activity of the brain is very
energy demading. The brain is therefore richly supplied with
oxygenated blood with nutrients (especially glucose), which are
supplied from the left ventricle by two pairs of arteries.
Most of the brain is supplied by the carotid arteries
(arteriae carotidas internae), the brainstem and
cerebellum are supplied through the arteriae vetebralis.
The cerebral veins then drain the deoxygenated blood into the
rafting system (sinuses), from where it continues to the right
heart.
The internal environment of the brain is separated
from the vascular system by the so-called blood-brain
barrier, which allows only limited and selective
transport of substances between the blood and brain tissue.
Brain pathology
The most common serious diseases (which can
lead to irreversible brain damage and endanger life) are vascular disorders of the brain.
They can be chronic or acute. Chronic disorders lead to
a gradual decrease in the flow through the blood vessels leading
to individual parts of the brain, which leads to ischemia
and the possibility of a decrease in the function of the relevant
parts. Acute vascular disorders (vascular cerebral
accidents) - stroke (ictus, cerebral
infarctus, popularly called "wounding a stroke") are
sudden damage to brain tissue due to a disturbance in the
cerebral blood circulation. According to the mechanism of origin,
strokes are divided into two types :
-> Ischemic strokes arising from bloodlessness
(hypohemia) of a certain part of the brain due to occlusion and
impassibility of blood vessels, most often by clogging of the
cerebral vessel with a clot, embolization into the brain. The
occlusion of the artery stops the blood supply to the relevant
part of the brain, where the oxygen-free cells begin to die - ischemic
necrosis (infarction) of the brain tissue. This can lead to
a malfunction of the physical or mental functions that the
affected part of the brain controls. Ischemic strokes account for
about 80% of all strokes.
-> Hemorrhagic strokes occur as a result of a
rupture of the wall of a cerebral blood vessel
("rupture" of some blood vessel inside the skull),
leading to incracranial haemorrhage. It can be intracerebral
bleeding into the brain tissue - into the brain parenchyma
(intraparenchymatous bleeding), or bleeding into the ventricular
system - subarachnoid hemorrhage. Hemorrhagic strokes
(representing about 20% of strokes) are usually significantly
more severe than ischemic strokes. Hematoma and subsequently
cerebral edema increase intracranial pressure, there may be an
oppression of vital brain centers (respiration, heart rhythm),
compression of blood vessels leading to general hypoperfusion to
the closure of flow through the cerebral vessels - aperfusion and
brain death.
The clinical consequences of a stroke (if
the acute phase survives) depend on the type, extent and location
of damaged brain tissue. It is usually unilateral paralysis of
the limbs, speech disorders, changes in the psyche. They can be
permanent or they can partially remedied
(possibly with the help of rehabilitation).
One type of ischemic stroke is the so-called transient
ischemic attack (TIA), in which the symptoms last for
several minutes to hours and then disappear spontaneously.
Degenerative
brain diseases are caused by the gradual extinction of a number
of certain brain cells (dementia, Alzheimer's disease)
or changes in the distribution of signaling mediators
(neurotransmitters) such as dopamine (hyperkinetic-hypomotor Parkinson's
disease, hypotonic-hypermotoric Hungtington's disease).
Then there is epilepsy - a disorder of excitement in the cerebral
cortex, leading to seizures or temporary loss of consciousness.
At a more subtle level of higher nervous activity, mental
disorders occur such as schizophrenia, depression,
hallucinations ...
Serious diseases are brain
tumors. These are either primary tumors
originating from brain tissue, or secondary brain metastases
transferred into the brain from a malignant tumor elsewhere in
the body. Primary tumors, which originate from the brain tissue
itself (intrinsic), are most often gliomas,
they come out from glia cells. The astrocytoma
is partially differentiated, but may degenerate into anaplastic glioblastoma.
Highly malignant multifocal glioblastoma can
develop primarily. Benign brain tumors, such as oligodendroglioma
and ependymoma, also occur.
Tumors from
neurons occur only rarely, because they have virtually no cell
division. In early childhood, neuroblastoma
occurs, caused by a malignant reversal of immature nerve cells.
Nuclear
medicine provides several methods of scintigraphic diagnostics of
the brain - its regional blood flow, functional imaging and
metabolism, distribution and density of receptors and
transporters of synaptic systems in the CNS, searching for tumor
foci, mapping of cerebrospinal fluid (liquor) spaces.
Static
scintigraphy of the brain to detect violation of the blood-brain barrier
Purpose: To demonstrate focal disruption of the blood-brain
barrier in connection with a brain tumor or vascular lesion. The
radiolabel from the vascular bed partially passes through the
disrupted blood-brain barrier and accumulates in the pathological
tissue, which then appears on the scintigram as an area of
increased activity against the background of low hemisphere
activity (where the radiolabel normally does not penetrate). Radiopharmaceuticals: Simple 99mTc-pertechnetate is used, or more
preferably 99mTc-DTPA (provides
more contrast imaging ...).
Execution: About 1 hour after i.v. application of the
radiopharmaceutical, static scintigrams of the brain area are
taken on a gamma camera in 4 basic projections (AP, PA, DX, SIN),
sometimes even in the vertex projection. Another option is
scanning using the SPECT method, which provides possibilities for
a better view of brain structures. It is possible combine with
the dynamic perfusion scintigraphy of the brain described below:
the radioindicator in the form of a bolus is applied directly
under the camera, in the AP projection we start the dynamic
scintigraphy, then we take static images in the necessary
projections.
Assessment: On scintigraphic images in various projections or
sections of SPECT, deposits of increased deposition of the
radioindicator are sought, indicating penetration from the
vessels through the broken blood-brain barrier into the brain
tissue.
 |
Extensive focal lesion of the
meningioma falcis cerebris - left lateral and anterior projection. (taken with a PhoGamma camera on a CLINCOM device in 1974) |
Brain perfusion scintigraphy
Adequate blood flow to brain structures is one of the basic
conditions for proper brain function. Scintigraphic methods
enable non-invasive diagnosis of brain perfusion, imaging of its
symmetry or regional defects in perfusion.
Dynamic scintigraphy of cerebral perfusion (brain angiography, cerebral
circulography)
Purpose: We display the dynamics
of blood flow - cerebral circulation - throught
carotid arteries, hemispheres, posterior pit and assess, if
necessary asymmetries that can be associated with obstruction
and lead to ischemia. On scintigrams we can also
show meningioma, bleeding, chron. subdural hematoma.
Radiopharmaceuticals: A simple 99mTc-pertechnetate is used,
or more preferably 99mTc-DTPA (provides
a more contrast image ...).
Design: The camera detector is set above the cranium in the AP
projection so that the sagittal plane is exactly perpendicular to
the detector plane. Nasus-meatus ac.ext. junction runs
vertically. After i.v. application of about 500MBq of radio
indicator, the acquisition of fast dynamic scintigraphy of about
100 frames at 0.5 sec./frame is immediately started.
Subsequently, event. a still static image lasting 2-5 min.
Evaluation: When visually observing sequential images, we can
recognize possible occlusion of large cerebral vessels. Perfusion
of cerebral hemispheres, especially larger outages in regional
cerebral perfusion, can be assessed in the images of early
arterial phase and late arterial phase. For a more detailed
evaluation, the flow curves from the left and right hemisphere
ROIs are used (ROIs must be defined in a strictly symmetrical and
standardized way, possibly using a static image). Under normal
circumstances, these circulation curves must
have an identical course with a steep increase, reaching the peak
early and then initially a rapid decrease, followed by
recirculation. One-sided shift of the peak (to a longer time) and
a decrease in the amplitude of the curve indicate a relative decrease
in perfusion relevant hemispheres. A decrease in the
amplitude of the curve indicates a disruption of the flow through
large vessels or a decrease in the intensity of the flow in the
capillary phase, a delay in the onset of the peak of the
perfusion curve occurs when the affected hemisphere is supplied
with collateral circulation. Curves can also be quantified to
compare the perfusion of both hemispheres. The index of
relative flow through the left and right hemispheres is
calculated from the integrals of the curves from the arrival of
the activity to the first maximum (the normal range of the index
is about 0.9 - 1.1).
| Computer evaluation of dynamic scintigraphy of brain perfusion | |
 |
|
| Visual
evaluation: After intravenous application of 99m-Tc on scintigraphic images of bolus passage through the cerebral circulation, we observe a good and symmetrical perfusion of both cerebral hemispheres, without occlusion of large cerebral vessels. Conclusion:
|
|
 |
Asymmetric circulation
curves in the pathological case of significantly reduced
perfusion of the right hemisphere during occlusion of the right car.carotis int. (evaluated on GAMMA-11) |
The procedure for computer evaluation of
dynamic brain perfusion scintigraphy is described in §3.8 "Dynamic brain
perfusion scintigraphy" of the
book "OSTNUCLINE". This method is now being replaced by
more perfect static SPECT scintigraphy of the brain using
lipophilic radiopharmaceuticals :
Static SPECT
scintigraphy of brain perfusion
Purpose:
Imaging regional brain perfusion and functional manifestations of
brain tissue through perfusion. It maps the viability of nerve
cells, the intensity of regional metabolism. It allows to assess ischemia,
in stroke it helps to distinguish between ischemic (caused by embolic, mostly thrombotic, artery or
arteriole closure) and hemorrhagic (caused by intracerebral or subarachnoid haemorrhage), information on cerebrovascular reserve
may be obtained. The method of demonstrating reduced perfusion is
also useful for the differential diagnosis of dementia.
Radiopharmaceuticals:
Lipophilic radiopharmaceuticals - 99mTc-HMPAO
(hexamethylpropyleneaminoxine), 99mTc-ECD (ethylcysteine dimer, also
called bicisate), or 123I-isopropyl-p-iodomephetamine.
Design:
Before application, let the patient calm
down in silence and dim light with his eyes closed. After about
20 minutes about 700MBq of radio indicator is i.v. applied. SPECT
scintigraphy of the head area is then performed. Examinations can
be performed under native conditions, or - to obtain information
on cerebrovascular reserve capacity (CVRC) - after
stress by acetazolamide or CO2 inhalation.
Evaluation:
Lipophilic radiopharmaceuticals cross the intact blood-brain
barrier and are fixed in brain cells in direct proportion to
regional Celebral Blood Flow (rCBF) and the function (vitality)
of neurons. After entering brain cells, the radiopharmaceutical
loses its lipophilic character and binds to the polar compound,
preventing its back-diffusion from the cells and redistribution;
this fixes the perfusion conditions that were at the time of
application.
During SPECT reconstruction,
we show transverse, sagittal and coronary sections, on which we visually
assess the distribution of the radiopharmaceutical, which is
proportional to the regional perfusion. We assess areas of reduced
radiopharmaceutical accumulation that may be due
to decreased perfusion or neuronal
brain cell dysfunction. In addition to visual
evaluation, semi-quantitative evaluation can also be
performed by means of numerical ratios of accumulation of the
radioindicator in suitable areas of interest (ROI) against each
other and with respect to the tissue background, event. in
comparison with the images created in the normal database.
A marked perfusion
defect is observed especially in ischemic stroke in the
area of the brain that is supplied from the artery affected by
the embolic occlusion. In hemorrhagic strokes, a
focal decrease in radiopharmaceutical accumulation is observed in
the affected area due to the destruction of surrounding brain
tissue by bleeding. Bilateral hypoperfusion of the posterior
parts of the hemisphere cortex occurs in Alzheimer's disease,
while it is not observed in other types of primary or secondary
dementia. In vascular multi-infarct dementia, multiple foci of
reduced perfusion appear in the cerebral cortex of one or both
hemispheres. Anomalies in regional blood flow are also observed
in a number of other CNS diseases and mental disorders. Total aperfusion
of the hemispheres, cerebellum and brainstem is a reliable method
of detecting brain death.
If
scintigraphy has been performed with stress (eg CO2 inhalation), we compare perfusion images in corresponding sections
and look for differences in radiopharmaceutical deposition on
post - stress and native scintigrams. After stress, the flow
through the unaffected vascular bed in the brain increases, while
vessels with atherosclerotic narrowing are unable to respond by
dilation - they do not have the necessary cerebrovascular
reserve capacity CVRC. When comparing the images, under
these pathological circumstances we observe a decrease
in radiopharmaceutical accumulation in the
affected vessel basin compared to healthy tissue (as seen below in the right half of the image:
native scintigram is practically normal, but relative
hypoperfusion appears parietally to the right in the image after
CO2
exposure as a consequence of a reduction in CVRC). Information on CVRC is useful in stenosis of some of
the major branches of the arterial cerebral circulation, to
assess the effectiveness of angiosurgery.
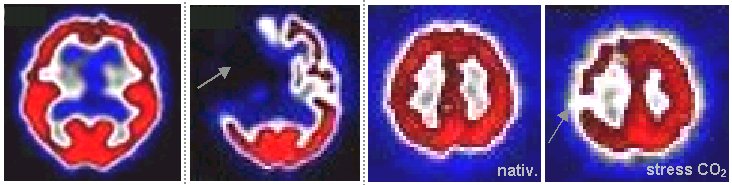 |
|||||
|
|
|
|||
| (scintigraphic images of transverse sections taken by P.Širùèek, MD, PhD., KNM FN Ostrava) |
Brain amyloidosis scintigraphy
Amyloidosis is a systemic disease, caused by a
conformational change of the geometric structure of some
originally soluble proteins into an insoluble form of amyloid
fibrils, which can be deposited in the interstitial
areas of various tissues and organs - brain, heart, kidneys....
This can adversely affect their structure and physiological
functions.
In the brain, it is
localized b-amyloidosis in
some neurodegenerative diseases and in general in the elderly. b-amyloids can form extracellular
aggregates - plaques - of fibrillar amyloid. It
accumulates in the gray cortex of the brain (mainly
in layers II and III). Neuritic plaques can deform and damage
neurons and their synaptic connections. It can lead to
inhibition of higher nervous activity, reduction of cognitive
functions - degenerative disease of the CNS.
Purpose
:
Scintigraphic visualization of amyloidosis -
imaging of the deposition of amyloid plaques in
the brain. It is mainly used in degenerative diseases of the CNS
such as Alzheimer's disease...
Radiopharmaceuticals :
18F-labeled
polyethylene glycol stilbene derivatives 18F- Florbetaben, 18F- Flutemetamol, 18F- Florbetapir are
used, which have a high specific affinity for beta-amyloid
plaques (it can also be used in
myocardial amyloidosis).
Execution :
Intravenous application of approx. 200 MBq of
radiopharmaceutical. PET/CT acquisition is taken in 90 min. after
application, supine position with head in the field of view of
the camera. Duration of acquisition approx. 20 minutes.
Evaluation :
Visual evaluation of PET images. Only white matter accumulation
is considered physiological. A pathological finding shows
increased activity in cortical areas (frontal
lobes and anterior cingulum, lateral temporal lobes, precuneus
with posterior cingulum and temporoparietal cortex) or in the striatum. Activity in cortical gray and
adjacent white matter is compared. For anatomic-physiological
correlation, it is advisable to use fusions with CT images, or
even MR (if available).
Validity of PET
scintigraphy for amyolidosis ?
Convincing links between brain amyloid deposits and dementia have
not been found in experimental studies or in clinical use.
Significant deposits of amyloid have been found in the brain in
many cognitively normal people. And vice versa, the absence of
amyloid in people diagnosed with Alzheimer's dementia. Therefore,
PET scintigraphy of brain amyloidosis cannot be used for the
diagnostic verification of degenerative CNS diseases, but it can
contribute to the differential diagnosis of their causes.
PET scintigraphy of
cerebral amyloidosis is indicated relatively rarely. It does not
allow a direct diagnosis of cognitive disorders, the therapeutic
outcome is uncertain...
Scintigraphy of brain receptor systems
Scintigraphic methods of "molecular imaging"
in nuclear medicine, as the only imaging method,
allow in vivo imaging of the distribution and density of neuronal
receptors and transporters in the brain. It is used clinically
mainly for examination of the dopamine system :
Scintigraphy of the
dopaminergic system in the brain
Purpose:
This is a display of the distribution and intensity of signaling
pathways of dopamine neurotransmitters - the dopaminergic
system. Imaging of the pre- or postsympathetic part of
the dopaminergic nigrostriatal system serves for the differential
diagnosis of diseases leading to disorders of motor functions,
especially Parkinson's disease, tremors and
dementia.
Parkinson's syndrome,
manifested by a progressive decrease in movement speed, muscle
rigitity and tremor, is mainly caused by a disorder of
the dopaminergic function of the striatum due to the
death of the relevant neurons, which leads to a dysfunction of
the feedback extrapyrimide circuits.
Radiopharmaceuticals:
For presynaptic imaging, radioligands bound to
the dopamine transporter are used, mainly 123I-ioflupane - a cocaine analogue that
binds to presynaptic dopamine transporters (trade
name DatScan; less common alternative preparations are
iometopane - Dopascan, 123I-IPT, 99mTc-TRODAT, 99mTc-TECHNEPINE).
For postsynaptic imaging, radioligands with
binding to the dopamine receptor R2, especially 123I-IBZM
- iodobenzamide (or 123I-epidepride, 123I-IBF, 123I-iodolisuride) are used.
Furthermore, for PET imaging of dopaninergic
pathway disruption, then 18F-DOPA (L-dopa).
Procedure:
Accumulation of free iodine in the thyroid gland must be blocked
before the examination. After i.v. application of about 150-200
MBq of radioindicator, SPECT brain scintigraphy is acquired in
about 3 hours.
Evaluation:
During SPECT reconstruction, we show sections taken through the striatum
area, on which we assess the accumulation of radioindicators,
capturing the density of dopamine transporters or receptors.
Radioligand uptake is usually assessed visually,
but semi-quantitative assessments can also be made using
ratios of radiolabel accumulation in the areas of interest (ROI)
of putamine and caudate versus tissue background. Some software
also allow comparison with databases of normal patients
and determination of certain scores - agreed
quantitative parameters (indices) facilitating the
decision between normal and pathological findings. The specific
interpretation of scintigrams depends on the radioindicator used
:
When examining the presynaptic
part of the dopaminergic system, the binding of the
radioindicator is mapped (eg 123I-ioflupane) to dopamine transporters - proteins on the
membrane of presynaptic terminals of nitrostritial neurons that
reverse resorb dopamine from the synaptic cleft. The decrease in
relevant neurons is associated with a decrease in density
associated with a decrease in the density of presynaptic
transporters. After application of a presynaptic ligand that
binds to dopamine transporters, we evaluate the accumulation of a
radioindicator in the presynaptic terminals in the striatum. In a
normal finding, two symmetrical "crescentic" striatal
formations of the same intensity are shown. In Parkinson's
disease, the binding of ligands to striatal dopamine transporters
is reduced. Pathological findings are either asymmetric or show
reduced radiopharmaceutical accumulation. The decrease in
striatic activity correlates with the severity of Parkinson's
disease (its duration and psychosomatic impairment).
When examining the postsynaptic part
of the dopaminergic system, ligand binding (eg, 123I-IBZM) to dopamine
D2 receptors, located on the membrane of postsympathic
dopaminergic neurons in the striatum, is mapped. In Parkinsonism,
these receptors remain intact, while in all other
neurodegenerative diseases (including secondary Parkinson's
syndromes), these postsynaptic D2 receptors are damaged or
blocked; dopaminergic treatment is therefore ineffective.
In Parkinson's syndrome, there is
typically a reduced or asymmetric accumulation in the striatum on
the presynaptic picture (with 123I-ioflupane) and a normal distribution on the
postsynaptic picture (with 123I-IBZM) - see the middle and right picture :
| 123I ioflupane | 123I ioflupane | 123I IBZM |
 |
||
| physiological Parkinson's syndrome of the 2nd degree | ||
| Normal and
pathological images with 123I-ioflupane and 123I-IBZM (scintigraphic images were taken by M. Havel, MD PhD, KNM FN Ostrava) |
||
In addition to the dopaminergic
system, for the purposes of neurology, especially research and
experimental studies, radionuclide receptor diagnostics even of
other CNS neurotransmission signaling pathways are sometimes used
:
- The GABA system
acts as an inhibitory mediator in the brain. Imaging the degree
of binding of the respective ligands ( 123I-iomazenil, 11C-flumazenil) can help to find epileptic foci, as well as to visualize
glioma brain tumors.
- The opioid system is important for the
perception and influence of pain, it interacts with dopamine and
acetylcholine receptors. Scintigraphy using radioindicators ( 123I-iodomorphin, 11C-carfentanil) is tested in
schisophrenia and some types of epilepsy.
- The serotonin system is involved in the
management of sleep and some neurological and mental activities.
Imaging of presynaptic transporters (using 123I-beta-CIT, 11C-beta-CIT) and serotonin receptors (using 123I-8-hydroxy-PAT) can be used in Alzheimer's disease, depression,
schizophrenia, Parkinsonism, partial epilepsy.
- The cholinergic system is involved in
memory, cognitive function, concentration; on the contrary, its
disorders can lead to dementia. Imaging of presynaptic
acetylcholine transporters (using labeled
derivatives of 2- (4-phenyl-1-piperidyl) cyclohexan-1-ol -
vesamicol) and postsynaptic receptors (using indicators 11C-nicotine or muscarinic 11C-methylbenztropine, 123I-IQNB) may demonstrate loss of
cholinergic receptors in dementias (Alzheimer's, Pick's).
-
Histamine system - a change
in the distribution and density of receptors is manifested in
some psychoses, in depression. .....
Metabolic scintigraphy
of the brain
Purpose: The function of brain
tissue depends on the supply of oxygen and the supply of glucose,
which is a source of energy. This delivery is done by the
bloodstream. Decreasing this supply - ischemia - causes
a decrease in the energy molecules needed for the biological and
informational functions of brain cells. Using appropriate
radioindicators, we can investigate regional oxygen utilization,
regional glucose metabolism, or regional changes in amino acid
transport and protein synthesis rates. In addition to research
and experimental studies, this is also important for the clinical
diagnosis of impaired blood flow, decreased function or loss of
brain cell viability. ............
Radiopharmaceuticals, design, evaluation:
Almost exclusively positron radiopharmaceuticals are used,
scintigraphy is performed on a PET camera. To examine the
regional utilization of oxygen, 15O gas is inhaled
until a balance between 15O in hemoglobin and tissue oxygen is reached. In
metabolically active parts of the brain, radioactive water H215O is
formed from 15O-oxihemoglobin, the activity of which at steady state
depends on the regional flow and the regional oxygen extraction
fraction (rOEF). Can be confronted with the examination of the
regional blood flow rCBF.
To examine glucose metabolism, i.v. application
of 18F-FDG
(fluorodeoxyglocose) is used. Upon entering the cells, FDG is
phosphorylated as normal glucose, but its further metabolism is
blocked .....
For the metabolism of amino acids and proteins
is used 11C-methionine
.
Static
scintigraphy of cerebrospinal fluid pathways
Purpose: To monitor the movement and circulation of
cerebrospinal fluid - liquor - in the intracranial
subarachnoid space in order to assess the patency of cerebrospinal
fluid pathways, to detect of possible cerebrospinal
fluid fistulas, differential diagnostics of communicating and
obstructive hydrocephalus.
Radiopharmaceuticals: The most
commonly used is 111 In -DTPA (or 169 Yb -DTPA or 99mTc-DTPA) .
Design: After intrathecal application (lumbar puncture) of
about 30-50 MBq of radioindicator, we scan the head area in 5
hours and in 24 hours (or even in 48 hours) in AP, DX, SIN
projections. In case of suspicion of liquor fistulas -
communication of the cerebrospinal fluid spaces with the external
environment, we insert tampons into the nasal passages or into
the external auditory canals in approximately 6-8 hours after the
application; in 24 hours we pull them out and measure their
activity in a well scintillation detector.
Evaluation: ....... is described in more detail in §3.18 "Radionuclide
cisternography" of the book
"OSTNUCLINE".
| Evaluation of static scintigraphy of cerebrospinal fluid pathways - radionuclide cisternography | |
 |
|
| Visual
evaluation: After intrathecal application of 111-In-DTPA on scintigrams in 5 hours, we observe the presence of a radioindicator in the basal cisterns, in the subarachnoid space above the convexities of the hemispheres it reaches about half height symmetrically. We observe a lighter reflux into the ventricles. On scintigrams 24 hours after the application, the radioindicator in the subarachnoid space reaches to the right to half the height of the hemisphere and slightly higher to the left. Part of the radioactivity is located in the lateral ventricles. Measurement of radioactivity of nasal longets did not reveal its increased level. Conclusion: |
4.9.9 Examination of the venous and
lymphatic system - radionuclide phlebography and
lymphoscintigraphy; Sentinel nodes. Scintigraphy of labeled blood
elements. .
Venous
system
The blood
circulatory system consists of arteries, veins and blood
capillaries. Veins (Latin vena, Greek flebos) are vessels that drain partially
deoxygenated blood, pass through the systemic circulation, back
to the heart - and then back to the lungs for further
oxygenation. .
Pathology of the venous system: A common disease is the
deterioration of blood flow -venous insufficiency. In
the veins are formed varicose veins, blood clots - thrombosis. It
is manifested by swelling and inflammation, in the lower limbs in
severe cases, shin ulcers develop.
Lymphatic system
In addition to blood, lymph (sap) also
flows in the body - a yellowish fluid
similar to blood plasma, which is formed in the intercellular
space from tissue fluid. Part of this fluid, together with
metabolites, is produced by cells. Another part comes from blood
capillaries, the wall of which is partially permeable to blood
plasma. This interstitial fluid between cells
mediates the exchange of oxygen, carbon dioxide, nutrient supply
and metabolite removal. From the interstitial space, the lymph is
first drained by capillaries, which connect to the lymphatic
vessels. The lymphatic vessels eventually connect to two ducts,
which open into the bloodstream.
Lymphatic pathways lead through the lymph
nodes, which serve to filter and accumulate lymphocytes and
macrophages, significantly contribute to the body's immunity (defenses),
preventing the progress of infection.
Pathology of the lymphatic system: Lymphatic
pathways can be affected by inflammation, including inflammation
of the lymph nodes, manifested by swelling. Disruption of the
lymphatic system - insufficiency or blockage - can occur as a
result of injury, surgery, radiotherapy, inflammation and
infections, tumor processes. If the lymph is not sufficiently
drained from the tissues, there is a swelling called lymphedema.
A serious tumorous disease of the lymphatic system (lymph nodes)
is malignant lymphoma (its therapy in nuclear
medicine is mentioned in §3.6, section "Radioisotope therapy").
Note:
From a clinical point of view, radionuclide
phlebography is usually included in the group of cardiovascular
examinations. Here we included it in a separate subchapter
together with lymphoscintigraphy - for similarities of systemic,
scintigraphic technique, acquired images and localization mostly
to the lower limbs.
Radionuclide
phlebography
Purpose: Assessment
of venous patency by imaging the flow of radiopharmaceuticals
through the venous systems of the limbs (or the veins of the trunk), most
often in swellings that could be caused by impaired venous
outflow, phlebothrombotic involvement. After i.v. application of
a radioindicator to the peripheral vein of the limb, we display
the flow of the radiopharmaceutical through the venous system.
After the flow through the venous system, the radiopharmaceutical
MAA is subsequently captured in the capillary bed of the lungs,
where we can scintigraphically display possible embolization.
Radiopharmaceutical: 99mTc- macroaggregates
of albumin (MAA). ..........
Execution:
Often two subsequent scintigraphic examinations are performed
when applying a radiopharmaceutical with retracted and released
tourniquets (consisting of rubber
bands) to differentiate the flow and
filling of the deep and a superficial venous system.
Lower limbs: Application 99mTc-MAA into a vein in the dorsum of the foot with the
tourniquets retracted above the ankle and below the knee. A
scintigraphic imaging of the flow of the radioindicator through
the venous system up to the level of the inferior vena cava is
performed. After releasing the tourniquets, the application of
the radiopharmaceutical and the display of the flow through the
venous system are repeated.
Upper limbs: Application of 99mTc-MAA into a vein
in the dorsum of the hand, scintigraphic imaging of the flow of a
radioindicator through the venous system up to the level of the
upper vena cava.
Subsequently, lung scintigraphy can be performed - to
assess possible perfusion disorders due to embolization.
Planar scintigraphic images of the area of the examined
bloodstream are taken. It is advantageous to scan in a
"sliding" whole-body mode with a smooth movement of the
patient under the camera, up to the area of the lungs, where the
image of pulmonary perfusion is formed :
 |
Examples of of the lower limbs
radionuclide phlebography. Left: Physiological finding of good and symmetrical flow through the venous system of both limbs. Right: Pathological case of phlebothrombic disordes with blocked venous outflow in the right lower limb. (Arrows indicate the position of the contractive bands.) Examinations were performed in whole body mode, at the top are images of perfusion of the lungs (no apparent embolization). (scintigraphic images were taken by L.Mrhac, MD, KNM FN Ostrava) |
Evaluation: Display of scintigrams in monochrome gray-black
scale with a suitable level of modulation for displaying even low
levels of activity. Visual evaluation - we assess especially the
possibility of phlebothrombotic disease, or even pulmonary
embolization.
Lymphoscintigraphy
Purpose: Imaging
of the lymphatic system and lymph outflow from the examined area,
assessment of slowing down or blocking lymphatic drainage. It
helps in the differential diagnosis of swelling of the lower and
upper limbs, which could be caused by impaired lymphatic outflow.
It is also very useful in tumor diagnosis for the detection of
sentinel nodes (described below).
Radiopharmaceutical: 99mTc-labeled colloid
of albumin with a particle size of about 10-80 nm, which
penetrates well through lymphatic vessels and nodes (to image sentinel nodes, larger particles of about
100-600 nm are used in the colloid, which are trapped in the
connective tissue of the nodes). Applied
activity approx. 20-80 MBq per injection, total activity approx.
100-150 MBq.
Execution:
When the labeled colloid is applied subcutaneously, the
superficial lymphatic system is displayed, when it is applied
deeper into the muscles, the deep lymphatic system is displayed.
For examination of the superficial lymphatic system, it is
administered subcutaneously or intradermally by injection between
the thumb and the other finger on the hand or foot. For
examination of the deep lymphatic system, it is applied
subfascially deep into the muscles, on the hands into the muscles
of the hypothenar, on the leg into the space behind the Achilles
tendon, or into the muscles in the heel or retromalleolar area.
After this application, the colloidal radiopharmaceutical is
absorbed into the lymphatic capillaries (not into the venous system) and
is transported by the lymphatic system to the regional lymph
nodes. This movement of the radiopharmaceutical trough the
lymphatic system and its accumulation in the lymph nodes can be
monitored scintigraphically.
After application of the
radiopharmaceutical, static planar scintigraphy is performed in
half an hour, preferably on a two-head gamma camera (used for
whole-body and tomographic imaging). Eventually, dynamic
scintigraphy can be performed from the radiopharmaceutical
application until 30 minutes. This is followed by another
examination after about 30 min. of physical exertion (for lower
limbs walking, for hands arm exercises, finger movement),
followed by static scintigraphy.
For comparison, both paired limbs are examined simultaneously.
Note: The radiopharmaceutical
may be administered even to other sites where lymphedema is
suspected.
After passing
through the lymphatic system, part of the radiopharmaceutical
enters the venous system and is then taken up by
reticuloendothelial cells of the liver and spleen, which are then
seen in scintigraphic images at later times (however,
these images are no longer evaluated in lymphoscintigraphy).
 |
Example of lower limb
lymphoscintigraphy. Left: Physiological scintigram of good and symmetrical flow through the lymphatic system of both limbs Right: Pathological case of a slight decrease in lymph flow in the right limb and blockage of lymphatic outflow in the left lower limb. Imaging were performed in the whole body mode; the uptake of radiopharmaceuticals in the liver is displayed in upper part (this is not evaluated in lymphoscintigraphy) . (scintigraphic images were taken by L.Mrhac, MD, KNM FN Ostrava) |
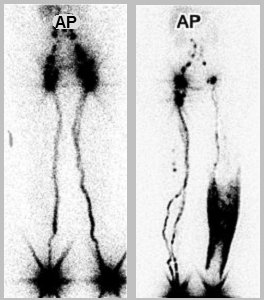 |
Another example of lower limb
lymphoscintigraphy. Left: Physiological scintigram of good and symmetrical flow through the lymphatic system of both limbs Right: Significantly pathological case with blockage of lymphatic outflow in the left lower limb, with extensive swelling - lymphedema of the calf. (scintigraphic image were taken by L.Mrhac, MD, KNM FN Ostrava) |
Evaluation :
Image modulation should be optimized to highlight areas of lower
activity, with suppression of high activities at
radiopharmaceutical application sites. Visual evaluation is
usually performed, the course of transport through the lymphatic
system and imaging of the catchement nodes are assessed - in the
lower limbs in the groin, in the upper limbs in the axils. In
lymphedema, diffuse retention of the radiopharmaceutical is
observed in the subcutaneous tissue of the affected area. If the
lymph outflow is severely affected (blocked), stagnation of the
radiopharmaceutical at the application site is observed
throughout the examination.
A semi-quantitative evaluation can also be
performed by determining the amount of radiopharmaceutical in the
catchment area of the nodes (in the groin or axillae) in relation
to the amount of radiopharmaceutical applied (in percent); it is
rarely done...
Sentinel nodes - scintigraphy,
radiation-guided surgery
Lymph capillaries have "slits"
through which even living tumor cells can enter. Tumor cells thus
spread from the primary lesion mainly through the lymphatic
pathways, so the lymph nodes around
the tumor site are the first to be affected. The first
such node in the lymphatic "basin" of a tumor lesion is
called the sentinel node ("guard"
node). The accumulation of a radiolabel in the nodes can be
visualized scintigraphically. If we apply a suitable colloidal
radioindicator to the peripheral part of the tumor site (most
often 99mTc
nanocolloid, particle size approx. 100-600 nm, activity approx.
40-150 MBq), it will spread through the lymphatic system and be captured
and collected in those nodes, that are lymphatic connected with a
tumor foci.
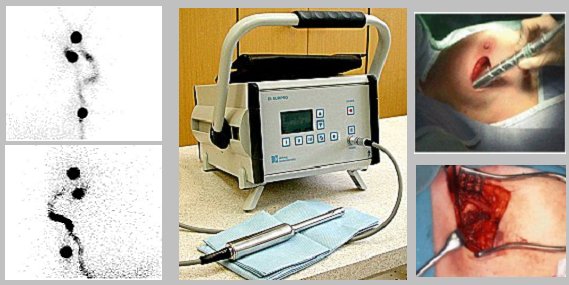 |
| Scintigraphy and radiation-guided
sentinel node surgery. Left: Example of scintigraphic imaging two axillary sentinel nodes in malignant melanoma. Middle: Radiometer with miniature collimated gamma-probe for perioperative sentinel node detection. Right: Measurement and excision of the sentinel node. (scintigraphic images were taken by Doc. O.Kraft, MD, PhD., Nuclear Medicine Department, University Hospital in Ostrava) |
It is important to monitoring the
radioindicator during the actual surgical procedure, when using a
collimated detection gamma-probe, the surgeon
can find a sentinel node containing the radioindicator directly
in the operating field. And also in the case of an resected node,
can measure whether it contains a radioindicator *).
*) Along with the radioindicator, a blue dye (isosulfan blue) is
applied at the same time, which also penetrates the nodes, so
that the surgeon can recognize the sentinel node also by its blue
color.
After the application of the
radio indicator, a scintigraphic imaging is first performed,
according to which we draw the displayed nodes. Then the patient
goes to his own surgical procedure, during which
the detection gamma probe is used both for
perioperative detection of the sentinel node and for detection of
radioactivity in the already resected node. This is followed by
histological examination of the sentinel node to classify the
type of tumor, which will help optimize the further course of
therapy.
Scintigraphy of labeled blood elements
The blood consists of blood plasma
(approx. 60% by volume), in which cellular blood elements
of three species are dispersed in the form of a suspension :
- Erythrocytes
(red blood cells) are the most important blood elements,
they make up about 40-48% of the volume (this
share of erythrocytes in the total blood volume is called the hematocrit).
They contain the red blood pigment hemoglobin.
The main function of erythrocytes is the absorption of
oxygen from the lungs in hemoglobin and its transfer to
the tissues and the transfer of carbon dioxide in the opposite
direction.
- Leukocytes
(white blood cells), which are an important part of the
body's immune system. There are several types of
leukocytes :
Lymphocytes - ... B-lymphocytes,
T-lymphocytes, ... Monocytes, ....... Macrophages, ........
Granulocytes, ....... Dendritic cells .... .
The role of these leukocytes in cancer therapy is mentioned in
§3.6, section "Chemoterapy" and "Targeted
biological therapy - monoclonal antibodies".
- Platelets
(thrombocytes) disc-shaped, with a size of only 2-4
micrometers. It is formed in the bone marrow from megakaryocytes.
Their main role is blood coagulation to stop
bleeding from a damaged blood vessel.
Leukocytes and platelets make up only about
1% of the total blood volume ....
Blood elements, together with
blood plasma, flow continuously through the vascular system and
gradually penetrate into all tissues and organs, where they can
participate in a number of physiological or possibly even
pathological processes. Thus, if we label a blood element with a
suitable gamma radionuclide, we can, after i.v. the
application, scintigraphically shows where it has penetrated
physiologically or pathologically in the examined tissues and
organs, how it is distributed there, with what
possible anomalies.
Labeled erythrocytes
Mostly 99mTc-labeled erythrocytes are used, which
can be prepared in two ways: 1. In vitro
laboratory from a blood sample in which the erythrocytes are
labeled with 99mTc and reinjected back into the patient. 2. In
vivo, in which the patient is first administered the
dissolved tin salt and after about 15 minutes the required 99mTc-pertechnetate
activity is administered. Sn2+ tin ions allow the binding of technetium to circulating
red blood cells.
Labeled erythrocytes are used for :
- Blood-pool equilibrium dynamic gated myocardial
scintigraphy - is described in detail in §4.9.4,
section "Equilibrium
gated ventriculography".
- Scintigraphy of localization of bleeding into the GIT.
After i.v. application of labeled autologous erythrocytes, the
possibly bleeding site on the scintigrams is manifested by an
increase in the concentration of radioactivity in the area where
the bleeding occurs (§4.9.3, passage "Scintigraphic
localization of bleeding into the GIT").
Labeled leukocytes
After blood collection, separation and
washing, leukocytes are labeled in vitro with 99mTc
HMPAO (300-500 MBq) or 111In-oxine
(20-40 MBq). Another (newer) possibility is in vivo labeling with
antigranulocyte monoclonal antibodyes MAbs, such as 99mTc-sulesomab and 99mTc-besilesomab,
which bind to leukocytes.
Labeled leukocytes are used to image inflammatory
deposits in tissues and organs. After application of
autologous labeled leukocytes or MAbs, scintigraphy is performed
in 30 minutes, 4 hours, or even in 24 hours - whole body
scintigraphy, targeted images, or SPECT. It is described in
§4.9.6, passage "Scintigraphy of inflammatory deposits".
Labeled platelets
For scintigraphy, platelets are labeled in vitro with 111In-oxine
(similar to leukocytes). This requires isolation of platelets from whole blood,
differential centrifugation, buffer washing and other procedures.
In the laboratory, it is quite demanding.
In scintigraphic diagnostics in nuclear medicine, labeled
platelets are so far used relatively rarely, mainly in three
areas : deep vein thrombosis, cardiac thrombi and rejection of
transplanted organs (mainly kidneys). ......................
..................
4.9.9 Less significants and rarely used
radioisotope examinations
Finally, for completeness, we briefly mention some methods that
are marginal in nuclear medicine or are already abandoned
- either because they investigate rare disorders and diseases, or
have been displaced by other newer methods or modalities. Above
all, this includes practically all non-scintigraphic
methods *), using sample measurement or radiation detection using
scintillation probes. Although they are still used "out of
inertia" in some workplaces (or are required by clinical
partners), from the point of view of the field of nuclear
medicine, these are methods that have been abandoned in
principle. Some of these methods were clinically useful at the
time and played-up an important role in the development of the
field of nuclear medicine (eg radionuclide
renography or thyroid accumulation), others
were controversial and not very valid from the very beginning (eg radionuclide cardiac circulography or stethoscopy
using a scintillation probe). Only later,
experience from much better scintigraphic diagnostics showed, how
gross errors the gamma-probe methods were making
with their "blindly" view.
*) The only exception to the importance of
non-scintigraphic diagnostics is the perioperative detection of sentinel
nodes in the operating room using a miniaturized gamma
probe (see "Radiation-guided surgery - sentinel nodes" above).
After all, even some scintigraphic
procedures, described in more detail in the main text of
this chapter, have shifted during development - whether rightly
or wrongly - among less used and partially abandoned methods (eg dynamic scintigraphy of brain perfusion, static
scintigraphy of liver and spleen, dynamic splenoportography,
....); even such elegant and well-developed
methods of dynamic scintigraphy as radionuclide gated
ventriculography and bolus angiocardiography are becoming less
and less common... They are also experimental
methods, used temporarily in some workplaces for research
purposes; after the completion of the research, their results
will be used for publications, but the relevant methods will not
penetrate into clinical practice (examples
may be metabolic studies of the brain, or scintigraphy of
migration of 111In marked dendritic cells to lymph nodes during immune
anticancer vaccination - § ... "...") .
Nuclear hematology
Practically all classical nuclear hematology,
which was "on course" especially in the early periods
of nuclear medicine, in the 60s-70s, belongs to the category of
marginal almost abandoned methods. There were mainly three
methods used :
- Determination of circulating blood
volume
is based on the dilution principle. We apply an
exactly known amount of radioindicator to the circulation and,
after perfect mixing in the bloodstream, we take a blood sample
of known volume (approx. 1 ml) and measure it in a calibrated
cavity scintillation detector. Using the dilution law, we then
calculate the volume in which the circulating radiolabel was
mixed and diluted. Autologous erythrocytes labeled with chromium 51 Cr are
used as a radioindicator (sodium chromate), which do not escape
from the bloodstream during the measuring period. To determine
the circulating volume of the erythrocyte mass, we measure the
activity of a whole blood sample. The total volume of blood is
made up of the volume of plasma and the volume of blood elements,
especially erythrocytes. Circulating plasma volume
measurements were sometimes performed with 131I-labeled serum albumin, but mostly a result from 51Cr-erythrocytes of
total blood volume was used, from which plasma volume was
calculated using hematocrit.
- Survival of erythrocytes and
localization of the site of their destruction
is determined especially in the diagnosis of the causes of
anemia. Under physiological circumstances, erythrocytes live for
about 120 days. Old and "worn" erythrocytes are
normally captured mainly in the spleen, where they disappear
(destruction, sequestration). In some pathological cases
(hemolytic anemia), red blood cells are prematurely and to an
increased extent destroyed mainly in the spleen, to a lesser
extent in the liver. It is therefore useful to determine
the lifespan of erythrocytes in the body. For this
purpose, it would be most appropriate to label one generation of
"new" erythrocytes and directly measure their true
lifespan. This method (with the labeling of
precursor marrow cells by radioactive isotopes of iron in the
form of sulphate or chloride), due
to its complexity and length, it was used only rarely for
experimental purposes. For clinical use, the method of labeling
a mixture of all red blood cell populations present
in the bloodstream is used. In the blood sample taken,
erythrocytes are labeled by incubation with 51Cr-chromate sodium; these labeled autologous
erythrocytes are then reinjected back into the patient.
Then we gradually take blood samples in 24 hours, 2 days, .. (2
times a week) ... for 2-3 weeks, until their activity (measured
in a well scintillation detector, corrected for the decay of 51Cr and possibly to
hematocrit) will fall to about half the initial value. Measured
values of time dependence of activity 51Cr in these blood samples is interpolated by an exponential
function, from which we determine the half-life of
chromium-labeled erythrocytes - the so-called "chromium
half-life"; it is about half the true survival
half-life of erythrocytes. The normal value of this half-life is
about 20-30 days, in severe hemophilia it can drop to 5 days.
Simultaneously with the measurement of
survival, the analysis of the site of increased
erythrocyte destruction can also be performed. We
measure the organ activity with a collimated
scintillation probe: the heart area (precordia)
- it serves as an indeferent reference tissue, liver
and spleen area (under
reproducible conditions - marks on the skin, drawn immediately
after application by probe navigation). The
first measurement is made about an hour after application, the
next measurement on the days when samples are taken to determine
survival; here, too, a correction is made for the adioactive
decay of 51Cr.
The measured values of activity (number of pulses) above the
liver and spleen are related to the activity above the heart - we
standardize the count of pulses above the liver and
spleen to the count of pulses above the heart. We determine excessive
activity in the liver and spleen - normalized
"extra impulses" (in the case of
the spleen, then the so-called hepatolienal index, which
is the ratio of count frequency measured above the liver and
spleen). Clear rendering in the graph helps
us to analyze the time course of organ activity and compare it
with the normal limit. The picture below shows a pathological
case of a patient with severe hemolytic anemia (after
splenectomy, there was a long-term normalization of blood counts
and half-life of erythrocytes) :
| Evaluation of erythrocytes survival and localization of their destruction by ERYT program | |
 |
|
| Erythrocyte
survival half-life : Exponential analysis of the activity of blood samples taken for 12 days after application of 51Cr-labeled autologous erythrocytes shows a significantly shortened erythrocyte survival half-life of 6.9 days (normal value is 25-35 days) - indicating severe hyperhemolysis . Erythrocyte destruction : Measurement of organ activity by a collimated scintillation probe over the heart, liver and spleen shows normal sequestration in the liver, but markedly increased sequestration of erythrocytes in the spleen . Conclusion:
|
- Examination of iron kinetics
using 59 Fe
Iron is an important biogenic element - it
is part of hemoglobin, myoglobin, ferritin, transferrin.
Examination of iron kinetics is mainly used to diagnose
erythropoiesis disorders. After iv application of 59Fe-citrate, the plasma
clearance of iron is first determined:
blood samples are taken at 5, 10, 20, ...., 180, 240 minutes
after application and in centrifuged plasma, activity is measured
in a well scintillation detector. The time in which the plasma
activity decreases by half - the half-life T1/2 of the iron
leakage from the plasma is evaluated. Furthermore, the daily
turnover of plasma iron is determined, which is the
total amount of iron that escapes from the plasma per unit time
(1 day) [mmol / liter of blood / day]. Further plasma sampling (3
times a week for 14-21 days) determines the utilization of
iron by erythrocytes, which is the percentage of applied
iron 59Fe
that is incorporated into the hemoglobin of circulating
erythrocytes. In rare indications, the scintillation probe
measures the activity of the radioiron over the organs
involved in ferrokinetics - bone marrow, liver, spleen.
These laborious and lengthy
ferrokinetic tests have only been useful in special cases and are
now easier and more accurate to diagnose with biochemical
methods.
Sample methods of nuclear hematology are now abandoned, but
scintigraphy methods using radionuclide-labeled blood elements
are still important ("Scintigraphy of labeled blood
elements" are mentioned
above).
Next marginal methods
Sample methods of examination of resorption of
substances in the organism (in the small intestine), bleeding
into the GIT, or loss of proteins through the intestinal wall by
measuring stool samples are already abandoned from the GIT
examination :
- Schilling test
is an examination of the resorption of vitamin B12 (cyanocobaltamin, which is
absorbed in the ileum bound to the glycoprotein) in an organism; it is necessary for erythropoiesis and
also for the formation of leukocytes and platelets. After oral
administration of approximately 40 kBq of 57
or 58Co -labeled vitamin B12, together with 1 g
of unlabeled vitamin (to saturate the
binding capacity of cobaltamine), both
labeled and unlabeled B12 begins to be excreted by the kidneys. Urine is
collected for 24 hours after application, its activity is
measured using a scintillation detector and expressed as % of
applied activity. Sufficient resorption of B12 should be greater than 10%.
In the 1960s, B12 resorption was experimentally investigated by its
retention in the body by measurement on a whole-body detector
(7.day after application) - a long-abandoned method.
- Demonstration of bleeding into the GIT
,
the sampling method is replaced by scintigraphic imaging "Scintigraphic
localization of bleeding into the GIT".
Among the scintigraphic methods we can
name some of the following marginal (but occasionally performed)
methods :
- Scintigraphy
of scrota
is used to assess perfusion testicles and scrotal
tissues, especially when testicular torsion is suspected
and inflammation of the testes and epididymis. Simultaneously
with the application of 99mTc-sodium pertechnetate with the camera set to the
scrota area (with a suitable ZOOM magnification), perfusion
dynamic scintigraphy acquires about 60 images at 1 sec. and
then in about 5 minutes a static scintigram showing the
distribution of the radiopharmaceutical in the tissue and
bloodstream of the scrotum. Decreased perfusion is
observed in acute torsion in the affected testis and reduced
accumulation of the radiopharmaceutical in the tissue phase. At
24 hours after the onset of torsion, a peripheral margin of
increased radiopharmaceutical accumulation may be observed in the
tissue phase due to reactive hyperemia of the surrounding tissues
around the ischemic testis. The method may have the acute
importance of early diagnosis of testicular torsion, as
only early intervention can save the testicles from irreversible
necrotic changes.
- Scintigraphy of the salivary glands
is used for inflammation of the salivary glands and in case of
insufficient production of saliva - dry mouth (Sjögren's
syndrome). Scintigraphic imaging is based on the ability of the
salivary glands to scavenge anions. 99mTcO4-
pertechnetate is used, i.v. application approx. 300MBq. It starts
dynamic scintigraphy, in which the area of the salivary
glands is imaging in the front projection - about 60 images after
1 minute. In the middle of the examination, if necessary. applies
a salivation stimulus to the mouth - lemon juice.
Sometimes static scintigraphy is performed in front and side
projection. Dynamic scintigraphy is evaluated from the course of
curves from the areas of interest of the parotid gland, gl.
sublinguals to submandibulares. The normal curve has an ascending
phase, reaching a peak in about the 20th minute, with a
subsequent gradual decrease, which is significantly accelerated
by the salivation stimulus. In acute inflammation, due to
hyperemia, the accumulation of the radioindicator in the salivary
glands is increased, the time to reach the maximum is shortened
and the decrease of the curve is slowed down; in chronic
inflammation, the curve is generally flat. In Sjögren's
syndrome, the ascending phase of the curve is normal, but the
descending part is flat, including the phase after the salivation
stimulus.
- Scintigraphy of the pancreas
with a radiopharmaceutical 75Se-selenomethionine - is described in §4.9.3, passage
"Pancreas scintigraphy".
- Diagnosis of bile acid
malabsorption
using 75Se-
tauroselcholic acid, when evaluating the reduction of the
absorptive function of the terminal ileum (e.g. in Crohn's
disease, inflammatory or toxic damage). It is also mentioned in
§4.9.3, passage "Diagnosis of bile acid malabsorption".
- Scintigraphy ......... ...... more .......................... .the description of other methods will
come more add from our book on computer evaluation of
scintigraphy .....? ........
--------------------------------------------------
--------------------------------------------------
----------------------------
Author's note to §4.9 "Clinical
scintigraphic diagnostics in nuclear medicine"
---------
--------------------------------------------------
--------------------------------------------------
-------------------
The author of this treatise is a physicist,
who is basically not competent to comment on the clinical
significance of scintigraphic methods. However, for several
decades I have been dealing not only with nuclear and radiation
physics, but also with its applications in biology and medicine,
mathematical modeling and computer analysis of scintigraphic
studies. I have participated in research and development of a
number of methods of nuclear medicine. During my 40-year close
collaboration with fellow physicians in the field of nuclear
medicine, I also somewhat "sniffed" the clinical
aspects of radioisotope methods. However, it is not my own
professional "parquet" and so I apologize for
a number simplifications in the interpretation of individual
scintigraphic examination methods in clinical nuclear medicine.
We physicists see it all too "mechanistic" and
simplified, we are interested primarily in the internal
mechanisms and the nature of the studied phenomena, but we do not
have to cover the specific medical side comprehensive enough ...
This treatise in §4.9 certainly does not
try to "compete" works (books,
scripts, articles in journals) certainly
more erudite colleagues physicians in the field of nuclear
medicine. I only felt a kind of "debt" and a challenge
to express myself (albeit debatably..?..) from my point of view even on the clinical
aspects of such a nice and interesting method as scintigraphy
in nuclear medicine.
Rather, it is a supplement to the detailed explanation of the
physical and technical aspects of scintigraphy in the previous
§4.1-4.7 treatise "Scintigraphy". The §4.9 is intended more for physicists,
technicians and radiological assistants working in the field of
nuclear medicine and elsewhere, as well as students of physical,
biomedical or medical disciplines.
§ I welcome the comments of colleagues §