Detection and spectrometry of photon and corpuscular
radiation for research, technological applications and medicine
2.
Detection and spectrometry of ionizing radiation
2.1.
Introduction - methodology of ionizing radiation detection
2.2. Photographic
detection of ionizing radiation
2.3. Ionization
detectors
2.4. Scintillation
detectors
2.5. Semiconductor detectors
2.6. Detection and
Spectrometry radiation a and b . Liquid
scintillators. Neutron detection
2.7. Measurement of
radioactivity of samples (in vitro)
2.8. Absolute
measurement of radioactivity and radiation intensity
2.9. Measurement of
radioactivity in the organism (in vivo)
2.10. Calibration and
inspection of spectrometric instruments
2.11. Statistical
fluctuations and measurement errors
2.1.
Introduction - methodology of ionizing radiation detection
Ionizing radiation is invisible to the eye, so
in order to be convinced of its existence at all, it is necessary
to detect it using relevant physical
methods and appropriate instrumentation,
which converts invisible radiation into other visible or
measurable quantities.
In addition to "visibility",
detection allows us to investigate the properties
of this radiation and use it in a number of
scientific, technical, industrial and medical applications. It
provides us with quantitative information on intensity, energy,
spatial distribution and possibly other properties of radiation.
In this chapter we will describe the individual methods
and devices for the detection of ionizing radiation and
for the measurement of its energy - spectrometry.
In the introductory §2.1 we will give a basic division of
detection methods and devices and summarize some common
methodological aspects of ionizing radiation detection. In the
next §2.2-2.10 we will describe in more detail specific types of
detectors and spectrometers, their principles, properties and
technical construction.
Types of
ionizing radiation detectors
A number of ionizing radiation detectors have been developed
which (in addition to the common basic phenomenon of ionizing
radiation effects) use various principles and technical
constructions. Instruments for detecting ionizing radiation are
sometimes collectively referred to as radiometers.
They work either independently, or are part of devices for
measuring certain quantities and monitoring certain events using
radiation methods.
Dosimeters
A special type of radiometers are the so-called dosimeters.
They are usually simple detection devices that are calibrated in radiation
dose units (Gray, Sievert) or dose rate. They are used
in radiation monitoring to assess the effects of radiation,
especially on living tissue (see §5.1 "Effects of radiation on matter. Basic quantities of
dosimetry."). For measurement of dosimetric characteristics
of radiation, see also §2.8 "Absolute measurement of
radioactivity and radiation intensity", section "Measurement of radiation intensity
and dose rate".
Ionizing radiation detectors can be
divided according to three criteria: the time course of
detection, the physical-technical principle of
detection and the complexity of the
measured radiation information.
× 1. According to
the time course of detection, we distinguish two
basic groups of detectors :
- Continuous
"on-line" detectors ,
providing ongoing information on the
presence and instantaneous intensity of
radiation or the number of quanta of ionizing radiation.
The response (signal, measurement result) of such a
detector should be proportional to the
instantaneous intensity of the radiation. If the detector
is no longer irradiated, the signal at its output drops
to zero or to the background value. Detectors of this
type are, according to the classification below, almost
always electronic (luminescent
screens are no longer used).
- Cumulative
( integral ) detectors ,
which gradually collect their growing
response during exposure. This response (signal,
measurement result) remains in the detector even after
the end of the exposure (if the detector is irradiated
again, the new signal is added to the original one) and
can be evaluated later. The evaluation
gives an indication of the total value of irradiation for
the entire period during which the detector has been
exposed to irradiation (intermittent or uninterrupted).
According to the classification below, this group
includes mainly photographic and material detectors (such as thermoluminescent or OSL). They are mainly used in radiation
dosimetry.
However, some
electronic detectors can also operate in cumulative mode.
E.g. the electronic dosimeters can be switched
either to the mode of measuring the instantaneous dose
rate or to the mode of measuring the dose, the value of
which is then accumulated in the device from the start of
the measurement to the stop and reading. As a rule,
however, in the case of electronic devices, it is
possible to continuously monitor or read the accumulated
value even in the cumulative mode, which is not possible
with photographic and material detectors. Electret
ionization chambers operate from electronic
detectors in a purely cumulative mode.
Terminological note:
The division of detectors (as such) into continuous and
cumulative is conditioned by the current state of
detection technology and electronics. It may lose its
meaning in the future. Future detectors will probably
always be electronic and continuous. Cumulative
(integral) measurement will only be the result of
choosing the electronic evaluation mode.
× 2. According to
the detection principle.
Various types of detectors provide a
response to the interaction of ionizing particles by various,
often very different, mechanisms. They therefore differ in their
properties and thus in the possibilities and areas of their use.
According to the detection principle, we distinguish three groups
of detectors :
- Photographic ,
based on the photochemical effects of radiation
(film dosimeters, X-ray films, nuclear emulsions), or
using photographic imaging of traces of
particles in a certain material environment (fog and
bubble chambers - we have included
this group of detectors here somewhat unconventionally). Detectors of this type will be discussed
below in §2.2.
- Material ,
uses longer-term changes in the properties
of certain suitable substances (chemical composition,
volume, color - radiochromatic detectors,
excitation - thermoluminescent dosimeters and OSL)
by the action of ionizing radiation. Or heavy particles,
especially alpha, leave certain traces
in the material that can be made visible or detectable.
Due to their low sensitivity, they can
only be used for high radiation intensities or long-term
cumulative detection (similar to photographic detectors).
Note: From
a fundamental point of view, photographic detectors are
actually material detectors. However, due to their wide
use and specific properties, they are often classified
into a separate group. Photographic and material
detectors will be described together below in §2.2
"Photographic detection
of ionizing radiation";
their problematics and applications often overlap.
Weakening
response - Fading
For most materials of cumulative detectors meet with
unfavorable phenomenon called fading:
spontaneous attenuation of the signal - detector response
- with the time that occurs continuously in the period
between irradiation and evaluation. Due to physical and
chemical influences in the detector material, there is a
spontaneous disappearance of the latent image in
photographic materials, or a spontaneous deexcitation of
metastable electron levels of thermoluminescence and OSL
dosimeters.
All
photographic and material detectors operate in a cumulative
(integral) mode in the sense of the above
classification. In the area of radiation detection
discussed here, they are used mainly for dosimetric
purposes.
- Electronic
detectors ,
in which a part of the absorbed energy ionizing radiation
is converted into electrical currents or
pulses (either
direct or mediated process), which
is amplified and evaluated in the electronic
apparatuses (Fig.2.1.1). The input part of the
detection device is its own detector
- radiation sensor,
which converts part of the radiation energy into a
measurable electrical response. This is then processed in
the electronic circuits of the radiometer and displayed
or written in the recording device.
Electronic radiometers can operate
in two detection modes:
× Current mode , in which the
detector provides a weak electric current (continuous in
time), proportional to the mean intensity of the incident
radiation.
× Pulse mode
, in which the detector provides a response in the form
of electrical pulses, by which it immediately reacts to
individual incident particles and thus registers and
"counts" them. The output quantity is the number
of pulses, proportional to the number of incident
radiation quanta. The number of pulses per second (cps)
is called the pulse rate (frequency) [imp./s.],
[s-1]. The measured frequency of pulses is
proportional to the intensity of radiation (fluence of
quanta) at the location of the detector (assuming a linear response of the radiometer).
Electronic
detectors include gas ionization chambers
(including proportional and G.-M. detectors), scintillation
detectors, semiconductor detectors,
microcalorimetric detectors, magnetic spectrometers. All
these types of electronic radiation detectors will be
discussed in more detail in most of the text (§2.3 -
§2.11) of this chapter; the group of electronic
detectors is by far the most important.
Fig.2.1.1. Basic block diagram of an electronic
continuous radiation detector.
To some extent, the block diagram
is similar for a radiometer with an integral
detector. The difference is that the cumulative
detector and the evaluation part are separated,
while in the case of continuous detectors they
are built into one apparatus. |
Electronics
- optoelectronics - photonics
Some special scientific and technical fields deal with the
transmission of energy and information :
¨ Electronics
is a scientific and technical field dealing with the transmission
of energy and information through electrical signals
- especially electron currents and electromagnetic fields and
waves excited by them.
¨ Optoelectronics,
also called photonics, is a scientific and
technical field dealing with the transmission of energy and
information through photons, especially visible
light. It deals with photon sources, such as
lasers and light emitting LEDs, light transmission
techniques (eg optical fibers), methods detection of
photons and their conversion into electrical signals
(photodiodes and phototransistors, CCD, photomultipliers) and
processing of these signals in electronic circuits, including
computer software. Emissions, interactions and detection of
photons take place at the quantum level, so there is
sometimes talk of quantum photonics.
Electronics and optoelectronics play a key
role in the detection of ionizing radiation (§2.4 "Scintillation
detection and gamma-ray spectrometry",
§3.2 "X-rays - X-ray diagnostics", section "Electronic
X-ray imaging detectors"), in electronic sources of ionizing radiation (X-ray
tubes, accelerators) as well as in the relevant measuring and
control technology.
Significant opto-electronic components or
devices are LASERs (Light Amplification by
Stimulated Emission of Radiation). They are electronic
sources of very intense coherent rays of light (or infrared or
ultraviolet radiation), which arises on the principle of stimulated
emission, in which excited atoms jump en masse to lower
energy levels, which is accompanied by light emission with an
avalanche increase (chain effect - emitted light stimulates more
and more deexcitation with photon emission). The use of lasers
in nuclear physics is mentioned in several places in our treatise
- eg §1.3, section "Fusion of atomic nuclei", passage "Inertial thermonuclear fusion",
or §1.5, part "Charged
particle accelerators", passage
"Laser plasma accelerators LWFA" and "Ion
sources". However, a more detailed explanation of the
physical principles and technical design of lasers lies already
outside the scope of our nuclear and radiation physics (and besides, in the laser technology the author is not
an expert...).
× 3. Complexity
- completeness, details - of the measured information
The ionizing radiation we need to detect
often consists of particles and quanta of different kinds and
energies that come from different directions and places in space,
from different radioactive, electronic or cosmic sources.
According to the completeness - details of the measured
information, measuring instruments of ionizing radiation can be
divided into 4 groups :
- Radiation
detectors ,
perform only a simple registration of interactions of
particles (quantum radiation) with the detector, with
eventual determination of the time moment of the
interaction. They indicate only the intensity of
radiation, resp. number of radiation quanta,
without information about the type of radiation and its
energy. Such non-spectrometric detectors
do not provide radiation energy information and can only
be used for basic detection of particles or photons.
These simplest detectors include film and
thermoluminescent dosimeters, ionization chambers
including G.-M. detectors.
- Ionizing radiation
spectrometers ,
which measure not only the intensity or number of
radiation quanta, but also the energy of
radiation quanta *) and possibly its other
characteristics. The result is mostly the energy
spectrum N = N(E), which graphically captures
the dependence of the frequency of quanta N, ie
the intensity of radiation (on the vertical axis) on the
energy E (horizontal axis). This spectrum thus
expresses the energy distribution
(relative representation) of the quanta of the studied
radiation (for continuous and line
spectra see §1.6, section "Radiation energy", specific methods of spectrometry are
described below in §2.4 "Scintillation detection and spectrometry
of gamma rays"). Spectrometry of ionizing radiation is also
collectively called nuclear spectroscopy.
*) Usually, the energy
of a particle or photon absorbed in the detector
is determined from the magnitude of the amplitude of the
signal pulse obtained by the interaction in the detector.
From it, after callibration,
spectrometric analysis determines the actual
energy of detected quanta. Energy can also be determined
from the motion of charged particles in a magnetic field,
or from the absorption of radiation and the range of
particles in matter. All of these methods will be
described below.
The term spectrum introduce
in optics by I.Newton already in the 17th century, when
he discovered that white sunlight is a mixture of many
colors of the rainbow. It is based on lat. spectrum =
image, revelation, delusion - an image of something
that is not physically present.
In the
spectrometric mode can operate particular scintillation detectors,
semiconductor detectors
and magnetic spectrometers; will be described in more detail below.
One of the
types of spectrometers are the so-called calorimeters
- detection systems that absorb all
the energy of a particle and their output response
(impulse) is proportional to this energy (the name is
derived from thermodynamic terminology). They are mainly
used for the analysis of high-energy radiation (gamma,
protons, neutrons, p- mesons , heavy hadrons) arising from the
interactions of fast particles (from accelerators or
cosmic radiation). These energetic particles do not
transfer their energy in the substance during one or a
few interactions in a small volume element, but form
cascades of secondary particles which can further branch
into further sprays affecting large volumes of the
substance. Such a particle calorimeter consists of layers
of materials with high density and proton number Z,
from which high - energy particles emit secondary
radiation, which is detected by embedded detectors, most
often scintillation detectors. With appropriate
calibration, the amplitudes of the suitably adjusted
total pulses from these photomultipliers are proportional
to the energy of the detected particles. Special
types of microcalorimetric detectors ,
based on the thermal effects of radiation, are described
below in §2.5, section "Microcalorimetric
detectors".
- Imaging detectors - cameras that display - visually or
electronically - the spatial distribution
of radiation intensity. The simplest (previously used)
imaging detector is photographic film.
In X-ray diagnostics, luminescent screens
were also used, which were later supplemented with image
intensifiers and possibly electronic processing. Multi-detector
systems of spatially spaced detectors are now
used, which provide information about the points of
impact of the radiation or about the angles from which
the radiation arrives.
An example is scintillation cameras (§4.2), or semiconductor imaging
"flat" panels in X - ray diagnostics (§3.2). The most advanced imaging detectors
are solid state pixel detectors (SPD),
see §2.5 "Semiconductor detectors", section
"Multidetector semiconductor systems". A large number of position - sensitive
imaging detectors (also of various types) can be combined
into complex detection systems, in which positional
and angular reconstruction of paths and
propagation directions of detected quantums can be
performed using coincidence detection - "electronic
collimation" and imaging.
- Path detectors of
particles , which measure
- make visible or evaluate - the paths of motion
of individual particles in space, including their
curvature in a magnetic field. This is achieved either on
the basis of material effects -
photochemical reactions, condensation of droplets from
steam or the formation of bubbles in superheated liquid (see below "Particle Detectors"), or electronically
by complex systems of a large number of spatially
distributed detectors (see below
"Arrangement and configuration of
detectors" ,
Fig.2.1.3 bottom), semiconductor or
ionization chambers - collectively called trackers.
Analysis of particle paths, whether straight or variously
curved in a magnetic field, or branching paths due to
collisions and interactions, provides important
information on the properties of elementary particles,
nuclear and particle interactions (§1.5
"Elementary
particles and accelerators").
In terms of a specific type
of sensor sensitivity, we can label simple detectors
(and all radiation detectors in general) as radiation-sensitive
sensors, spectrometers are also energy-sensitive,
imaging and trajectory detectors are position-sensitive
radiation sensors.
The basic physical properties
of detectors include :
¨ Sensitivity and efficiency
of the detector
¨ Temporal resolution detector
(its dead time)
¨ Energy resolution of
the spectrometer
¨ Spatial (or angular) resolution
of the imaging detectors
Furthermore, it is the background of the
detector, linearity and homogeneity of
response, accuracy and time stability, "resistance"
to radiation overload, calibration parameters. These
properties of detectors, as well as their quantification, are
described in more detail below in the section "General physical and instrumental effects in
detection and spectrometry",
for imaging detectors in Chapter 4 "Radionuclide scintigraphy", §4.2 "Scintillation cameras", section "Imaging camera features"
and §4.5 "Quality control and phantom
scintigraphic measurements".
Spectrometry
- a powerful tool for physical cognition and applications
We consider it useful to recall here the key role of
spectrometric methods of analysis of electromagnetic and
corpuscular radiation for physical knowledge and applications of
physical methods in various fields of science, technology,
industry and medicine. The measurement of energy spectra
is the main source of knowledge about stars and galaxies in outer
universe, the composition of matter, the properties of atoms and
molecules, the structure of atomic nuclei, the nature and
interactions of elementary particles. Most of this knowledge is otherwise
inaccessible to us - whether for long distances (in
space) or submicroscopic dimensions deep inside the microworld.
Without spectrometry, we would know much less about the world. A
number of analytical methods are also directly
based on spectrometry, such as X-ray fluorescence analysis,
activation analysis, nuclear magnetic resonance, Mössbauer
spectroscopy, and indirectly scintigraphy, Doppler and
interferometric methods.
Shielding, collimation and filtration of
detected radiation
In many cases it is not enough to place the "bare"
detector of the required radiation in a certain place and
register the incoming quantum. In addition to the analyzed
radiation itself, there is almost always other unwanted
and interfering radiation at the measuring place. It is,
on the one hand, natural radiation (natural
radiation background - cosmic radiation, radioactivity of the
environment), radiation from possible other
surrounding sources, sometimes even undesirable components in the
measured radiation itself. To eliminate or reduce these
interfering radiation effects, the detector should be equipped
with other suitable mechanical or electronic parts, whereby the
beam or field of the detected radiation is basically modified
in three ways :
× 1. Shielding of the detector
To suppress unwanted radiation coming from the environment, it is
necessary to surround the detector itself with a sufficiently
strong envelope made of a substance that absorbs
radiation well - place the detector in a suitable shielding.
The most common construction material for shielding g radiation is lead,
in special cases tungsten and other materials are also used.
Sometimes we also use partial shielding of the primary
detected radiation - especially in the case of strong
radiation (high fluence), which would overwhelmed the sensitive
detector.
Influence of detector
shielding and radiation collimation on the shape of the spectrum
In the shielding material, the detected radiation interact with
the atoms of the substance, which can lead to the formation of secondary
radiation. In addition to Compton scattering, which
generates radiation with a continuous spectrum, it is also a
photo effect, accompanied by the formation of characteristic
X-rays with a line spectrum. In Fig.2.1.2 we see the influence of
different types of scintillation detector shielding (scintillation detectors are described in detail below
in §2.4 "Scintillation detectors", scintillation spectrum in the section "Gamma radiation scintillation
spectrum") on the shape of measured spectrum of sample of
radionuclide 99mTc emitting gamma radiation with an energy of 140keV.
For a detector without shielding (a), there is a
rather weak monotonic Compton continuum in front of the
photopeak. To measure low activities, it is necessary to place
the detector inside a massive lead shield (b
up). A side effect of this useful measure is the interaction of
gamma-photons with shielding atoms, among other things, by the photoeffect,
which produces secondary characteristic X-rays
(lines Ka,b) of lead with an energy of about 70-80keV, which is
manifested in the spectrum (b below). A special
type of shielding are collimators, used as a
primary imaging element in scintigraphy (§4.2, section "Scintigraphic collimators"). The interaction of
gamma-photons with a photoeffect with lead baffles between the
collimator orifices also produces a characteristic X-ray (lines Ka,b) of
lead with an energy of about 70-80keV. If the collimator has
relatively thicker baffles (approx. 0.5 mm), the characteristic
X-ray of lead is effectively absorbed and we can see a faint
X-peak in the spectrum of transmitted radiation (Fig. C).
In collimators LE UHR with small holes and very thin baffles are
significantly cross-radiation gamma and
characteristic X-rays trough the baffles, so that in the spectrum
can be X-ray photopeak even more pronounced than the primary
photopeak 140keV (d) (at
scintigraphy, however, the window of the analyzer set to
photopeak 140keV, so that X-rays are not registered, see the
spectrum image in the section "Amplitude analyzer
" §4.2 "Scintillation
cameras").
Fig.2.1.2 Influence of different detector shielding geometry on
scintillation spectrum.
a) Basic scintillation spectrum of the 99mTc sample measured
by a detector without shielding. b) Spectrum
measured by a detector inside a lead shield (7cm
Pb) .
c) Spectrum of the 99mTc sample measured through a lead scintigraphic
collimator type HR. d) Spectrum through a UHR
collimator with small holes and very thin septa.
× 2. Collimation of detected
radiation
In case we need to detect only radiation coming from a certain
direction, we provide the detector with a collimator
- such a mechanical and geometric arrangement of materials
absorbing a given type of radiation, which transmits only
radiation coming from certain desired directions (angles), while
it absorbs and does not transmit radiation from other directions.
The simplest collimators have the shape of various cylinders
- tubes and orifices. Special intricately configured imaging
collimators with a large number of holes play a key role
in scintigraphy - §4.2 "Scintillation
cameras", section "Collimators". Different types of specially shaped collimators
are used in radiotherapy; the most important is
the multi-leaf collimator MLC (§3.6
"Radiotherapy", part "Modulation of irradiation beams IMRT, IGRT").
Electronic collimation of radiation
In addition to the above-mentioned straightforward
"physical" radiation collimation, some special
detection systems use another method of directional radiation
selection, so-called electronic collimation,
without the use of a mechanical collimator. It is based on the
specific behavior of quantum ionizing radiation in the detection
system - the propagation of pairs (or more) of quantums in
certain precisely given directions, their coincidence
detection by a system of a large number of detectors and
subsequent positional and angular reconstruction
of the direction of quantum propagation. This analysis makes it
possible to select for further processing only those quants of
radiation, that have the desired direction - to
perform electronic collimation and display the
distribution of radiation in a given field. The
electronic collimation method is used in positron
emission tomography PET (see §4.3 "Tomographic
cameras", part "PET cameras")
and in some complex detection systems such as ring imaging
Cherenkov RICH detectors (see ....), trackers and
muon detection systems for accelerators (see ....).
× 3. Filtration of detected radiation
is used in special cases, where the measured radiation itself
contains quantum or particles of different types and energies,
while we need to measure only one of the components of the
primary radiation and we want to get rid of the others.
An example is the measurement of radionuclide
purity of preparations in case a given basic
radionuclide emitting low energy radiation g (eg 99mTc, g 140keV) is contaminated with a small admixture of a
radionuclide emitting higher energy g (eg 99Mo, g740keV). In direct measurement, the detector would be
oweeloaded with basic energy of lower energy, in the
"flood" of which the sparsely coming high-energy
photons would be "lost". In this case, it is possible
to use the method of filtration with a shielding
absorbent insert: place the vial with the investigated
preparation in a lead shield of suitable thickness (approx. 2-5
mm), which almost completely absorbs intense low-energy radiation
g of
the basic
radionuclide, but transmits a significant portion of the
weak but high energy g-radiation of
the contaminant. This method is described in more
detail in §4.8 "Radionuclides and radiopharmaceuticals
for scintigraphy", section
"Quality and purity of radiopharmaceuticals".
When using collimation and filtration, we must be aware
that a certain part of the incoming radiation will not be
detected, the detection efficiency is reduced.
For quantitative measurements, it is therefore necessary to make
an appropriate correction for this circumstance,
or to include it in the calibration of the detection
system.
Arrangement and configuration of radiation
detectors
Individual types of ionizing radiation detectors are used in
various configurations for their own measurements :
¨ One separate detector
In most radiation applications, one detector is
sufficient, which we choose according to the type of radiation,
its energy, intensity, geometric distribution. We pay particular
attention to the optimization of detection
efficiency, energy response, linearity and other parameters;
sometimes also prices... One detector is used, for example, in
personal dosimetry, in some industrial applications, when
measuring radioactive samples (Fig.2.1.3 top left).
The geometric design of the detector can be of
two types :
l Planar
detectors
cylindrical or square in shape, measuring radiation coming from 2p - half-plane; some may also be sensitive to
radiation coming from other angles (4p ).
l Well
detectors
designed in the shape of a vessel - a "well"
into which the measured sample is inserted. The sensitive volume
of the detector forms the bottom and walls of the well
surrounding the sample (test-tube). Most of the radiation thus
passes through the sensitive area, which leads to a higher
detection efficiency (it can be close
to 100%). These
detectors are listed below in §2.7 "Measurement of
radioactivity of samples (in vitro)".
¨ Multidetector
systems
To measure more complex radiation processes, we usually need to
measure radiation in different places of the monitored system Þ the need
for the simultaneous use of multiple detectors
(Fig.2.1.3 top right). Most of them are detectors of one type,
event. two species (eg for g and b ). Several detectors are used, for example, in
monitoring systems or in multi-detector sample meters. In §4.2
"Scintillation cameras" and §3.2 "X-ray diagnostics", part
"Electronic X-ray imaging"
we will see that for electronic radiation imaging
a systems of large number of elementary detectors and
opto-electronic members (sometimes several thousand) are used. In
addition to the requirements applicable to stand-alone detectors,
the muttual concurrence and harmonization
of the parameters of the individual detectors is
important here.
 |
Fig.2.1.3. Arrangement and
configuration of ionizing radiation detectors.
Above: Use of one detector and
multiple detectors of the same type.
Bottom: A complex system of a
large number of detectors of various types for the
analysis of high-energy particle interactions. |
¨ Detection systems for high-energy particle
interactions
The most complex detection systems are used to study the
interactions of high-energy particles in large accelerators.
Here, during the interactions of accelerated primary particles, a
large number of secondary particles and radiation of various
kinds arise, which need not only to detect but also to measure
their energies, momentum, charge, trajectories (§1.5, section "Analysis of dynamics of particle interactions"). This requires very complexly
configured multidetector systems, consisting of a large
number (tens and hundreds of thousands) of individual detectors
of various kinds, in a complex electronic circuit, often with the
participation of strong magnetic fields. These systems of a large
number of electronic detectors gradually replace the previously
used bubble chambers (described below).
A typical arrangement of such
an electronic detection system is simplified schematically drawn
in the lower part of Fig.2.1.3. Its task is to capture, if
possible, all particles and quantum arising during the studied
high-energy interaction .During these interactions, a large
number of secondary particles fly out in all directions.
The whole detection system is mostly cylindrical in shape
and surrounds the place where the accelerated
particles interact with the target or in the opposing collided
beams. It consists of several axially symmetrical parts -
cylindrical layers or "shells" of detectors, whose
functions complement each other :
l Internal trajectory detector - tracker
The inner part of the detector starts very close (usually a few
cm) from the interaction and consists of a large number of
elementary detectors ( detection "pixels" and channels)
- semiconductor and ionization chambers, which serve as so-called
trackers - electronic path
detectors charged particles. They are deposited in
several layers so that it is possible to electronically
reconstruct the paths of the particles flying out of the
interaction site. The best positional resolution is pixel
semiconductor detectors, which are placed in the innermost layer,
closest to the site of primary interaction. Semiconductor strip
and drift detectors are also used (see §2.5 "Semiconductor
detectors"). The
trajectory, charge and momentum of the particles can be further
determined in the next layer of position - sensitive multi - wire
drift ionization chambers; the curvature of the trajectory in the
magnetic field determines the charge and momentum of the
particle.
l Spectrometer - calorimeter
This is followed by a spectrometric layer, called a calorimeter,
where the energy of the flying particles is
measured. In task is absorb all the energy of the particle and
provide an output signal proportional to this energy. This layer
is formed absorbent material interspersed with
detectors. In the so-called hadron calorimeter,
high-energy hadrons (protons, neutrons, pions), when passing
through absorbent material through "photonuclear" fragmentation
reactions with nuclei, produce a larger number of other
secondary hadrons, which further interact with material nuclei in
a similar way - creating a gradually expanding spray
of ionizing particles, which are registered by interleaved
detectors. The so-called electromagnetic
calorimeter is optimized for the detection of particles
interacting by electromagnetic interaction (photons, electrons,
positrons and other leptons). When high-energy electrons and
positrons pass through the material, braking radiation is
produced in the form of high-energy photons. And high-energy
photons as they pass through a substance produce the
electron-positron pairs. The result of the interaction of
high-energy photons, electrons and positrons with the material of
the calorimeter is an electron-photon spray,
formed by a larger number of electrons, positrons and photons.
Scintillation detectors are suitable for the detection of
energetic particles (see §2.4 "Scintillation detectors"), especially high-density materials such as BGO,
LSO or PbWO4 crystals, which have good conversion efficiency even
for higher energy photons.
l Muon spectrometer
The last, outer cylindrical layer detects penetrating particles, muons
m, which fly out. It consists of a large number of large
ionization chambers, located in a magnetic field, which evaluate
the curved paths of muons to determine their charge (+, -) and
momentum. The detection system further comprises coils (often
superconducting) generating a strong magnetic field,
curving the paths of the charged particles; it is used to measure
the momentum and charges of these particles. As already
mentioned, the task of these complex detection systems is to
capture as many particles as possible that fly
in all directions from the point of interaction. The detection
system therefore has the shape of a cylinder, a kind of
"pot", surrounding the site of interaction. In order
not to escape even particles flying at small angles along the
axis, the detectors are also distributed in a circle at both ends
of the cylinder - they form a kind of "lids" (they are
not drawn in Fig.2.1.3 below). Since the particles formed during
interactions at large accelerators generally have high energies,
this implies the large size and weight of the detection system so
that no particles escape without detection, if possible. In each
case, however, neutral, weakly interacting particles such as
neutrinos escape freely...
The most complex detection systems of this
kind (called ATLAS, ALICE, CMS ) are built at the
largest LHC accelerator at CERN (§1.5, part "Large
Accelerators").
The complex detection systems a large
number of detectors are also used in experiments for detecting
neutrinos (§1.2, section "Neutrinos
- "ghosts" between particles"), and cosmic radiation, e.g.
observatory AUGER (§1.6, section "Cosmic ray"
passage "Detection and Spectrometry of cosmic
radiation").
Electronic
connection and processing signals from the detectors
Electronic detectors of radiation are connected to respective electric
circuits, which provide two important functions :
¨ Power supply of detector
For the proper function of the detector, an appropriate supply
voltage must be introduced, so that the detected
ionizing radiation can cause corresponding electrical changes in
the detector, causing an output electrical signal - the
detector's response to radiation. We recognize two types of power
supplies :
- Low voltage sources of about 5-24 V,
used to power electronic circuits equipped with semiconductor
components: amplifiers, discriminators, coincidence circuits,
counters, indicators, etc.
- High voltage sources of approx. 100-2000 V,
which is needed for the function of photomultipliers, some
semiconductor detectors, ionization chambers.
For more complex detection devices, an
additional supply voltage is required for electromagnets or motor
movement of the detector components.
¨ Electronic signal processing and
evaluation of results
The primary electrical signal from the detector output is usually
very weak (it has a small amplitude, milivolts),
so in the first phase it is necessary to amplify
it (Fig.2.1.1). Amplification may also be in two stages: at the
very output of the detector is sensitive preamplifier,
partially amplified signal is then in the evaluation apparatus
amplified in the amplifier to a desired level.
This is followed by further processing - signal analysis
and its recording or registration in a counter
or computer memory. Signal processing may include appropriate
pulse shaping and amplitude sorting.
For systems of two or more detectors, the signals from the
individual detectors are processed either independently
(for monitoring systems or multi-detector sample meters) or
together. The simplest joint processing is simple signal summation
- the system then behaves like one "larger" detector.
When detecting more complex structured radiation, especially
correlated pairs of quanta, the connection of detectors in coincidence
or anticoincidence. In the case of coincidence
connection, a signal appears at the output only if the detection
occurred simultaneously in both detectors *) - it is used, for example, in PET positron emission tomography.
Conversely, in an anticoicidal circuit, the signal only passes
if, at a given moment, detection occurs only on one the detector
and not on the other (simultaneous detection is excluded). An
advantageous feature of the coincidence circuit is the
substantial reduction of noise and other
disturbing impulses.
*) In special cases, the so-called delayed
coincidence is also used - cases are detected when a
preset short time (usually less than ms) elapses between the
detection on one and the other detector.
In complex systems of many
detectors, so-called trigger circuits are
included, which trigger the detection process in the system of a
large number of detectors only for particles of selected
properties (eg trip angle, energy). This helps reduce the large
number of "ballast" pulses that would overwhelm the
system and make it difficult to find "useful" signals.
There is often a very complicated analysis - processing
- including arithmetic operations between the magnitudes of
individual signals, weighing processes and other manipulations,
according to the physical-mathematical model of the investigated
radiation process.
General physical and
instrumental effects in detection and spectrometry
The task of radiation detection and spectrometry is the objective
measurement of the number of quanta, energies, intensities and
other characteristics of ionizing radiation. However, a
completely accurate measurement with 100% efficiency is only an
ideal assumption; in fact, the measuring process manifests itself
in a number of unfavorable physical and
technical influences, limiting the possibilities
of measurement or distorting the results. For
individual types of detectors, these effects will be specifically
discussed below. Here we will mention some common physical and
instrumental influences, which we will discuss mainly for the
general case of spectrometry, where the situation is the most
complicated; some of these effects are then applied in simpler
cases of simple radiation detection.
Detection
efficiency and sensitivity
The task of radiometric detection devices is to objectively
measure the intensity of radiation or the number of its quants at
a given location, or emitted from a radioactive sample. The
optimal situation of "100% efficiency", where the
device will register every quants of analyzed radiation, is
seldom met - a certain part of the radiation for physical or
design reasons is usually not detected. An important parameter of
the radiometer is its detection efficiency,
sometimes called the sensitivity *) of the instrument.
*) However, it is not entirely correct to
confuse the sensitivity and efficiency of detection. The word
"sensitivity" can also express other
properties of the detector. In general, sensitivity
means the ability of a sensor to respond on certain
stimuli. The sensitivity of the detector
expresses the ability of the detector to react to radiation - to
generate a processable signal when a given type of radiation
enters. The quantitative measure of this sensitivity is then
expressed as the detection efficiency.
Sometimes the sensitivity of the detector also means the
smallest detectable radiation intensity, or the smallest
detectable activity of the sample, etc., which the detector
is still able to measure (distinguish it from the radiation
background in the context of statistical fluctuations and other
measurement errors).
We distinguish two types of
detection efficiency :
¨ Absolute (total) detection
efficiency of measurements
is the ratio of the number of pulses recorded by the detector to
the number of quanta emitted by the source in a given time, or
the ratio of the frequency of pulses from the detector to the
total flux in the field or beam of radiation. The absolute
detection efficiency depends on the geometric arrangement of the
source and the detector (see below §2.7
"Measurement of radioactivity of samples", geometry 2p, 4p), on event. absorption of
radiation in the environment between the source and the detector
and, of course, also on the intrinsic internal efficiency
of the detector used.
¨ Internal detection efficiency h of detector
is given by the probability of registration of quantum radiation
entering the sensitive area of the detector. It is expressed as
the ratio of the number of pulses recorded by the detector to the
number of quanta of a given type of radiation that entered the
detector (its input window); is given as a percentage (0% < h <100%).
The number of pulses registered
at the detector output is always slightly smaller
(often significantly smaller) than the number of quanta of
radiation flying into the detector. On the one hand, some
particles arriving at the detector may not reach a sensitive
volume at all because they have been absorbed by the material of
the package or input window. Other quanta, such as high-energy
gamma photons, can in turn fly through the sensitive volume of
the detector without interaction (and thus without response and
registration). Even if there is an ionization interaction in the
detector material, the generated electrons and ions may
recombine, or the energy of the electrons may be transferred to
other atoms and molecules outside the luminescent centers, -
leads to only a slight increase in the temperature of the
detector material. These "parasitic" phenomena reduce
the number of pulses at the output - they reduce the detection
efficiency.
The internal
detection efficiency, which is a characteristic of a given
detector (its type and even a specific piece), is given by a
number of physical and technical circumstances. Above all, it is
an effective cross section of the interaction of
a given type of quantum with the detector material. Furthermore,
it is the size of the sensitive volume, the absorption properties
of construction materials - mainly the input window,
"competitive" interaction processes without the
production of a useful signal, dead time, electronic processing
and signal analysis. We will deal with these phenomena
specifically for individual types of detectors.
For most
applications of ionizing radiation, we naturally require the best
possible detection efficiency. However, in the case of high
intensity of the measured radiation, high detection
efficiency could lead to detector overload, high
dead time loss, cumulative effects and other phenomena leading to
violation of the linearity of the response, deterioration
of the measurement accuracy, in extreme cases even damage
of the detector. In such cases, we prefer a detector
with less detection efficiency, or we artificially reduce the
overall detection efficiency by suitable collimation or
filtration of radiation in front of the detector, or by
increasing the distance between the source and the detector. We
then measure a lower signal flow (response), but correctly.
With suitable calibration, we measure a certain representative sample
of the analyzed radiation.
Time
resolution and dead time
There is a certain time delay between the moment
of interaction of the quantum of radiation in the sensitive
volume of the detector and the electrical impulse at the output
of the detector. It is caused mainly by two factors :
1. Physical processes in the detector itself -
energy transfer, formation of ionization, propagation of
electrons and ions in the detector material, charge collection by
electrodes, deexcitation time, duration of scintillation, etc.
The response time of the detector itself depends on the type of
detector, the size of the sensitive area (smaller detectors are
faster), the material and the design. It ranges from tens of
microseconds to G.-M. detectors, per unit of nanoseconds for
scintillation detectors.
2. Electrical processes in electronic circuits -
steepness of rise and fall of electrical impulses, charging and
discharging of capacitors, response speed of semiconductor
components. The decisive factors here are mainly the circuits of
the input preamplifier. Current electronic circuits are
quite fast, their response time is in the nanosecond range.
Individual
quants of radiation come to the detector with irregular
"time spacings", at higher radiation intensities the
particles come in very rapid succession, with only very small
time intervals. No electronic detector works "infinitely
fast", it has a finite time resolution.
¨ Time resolution
is the time that the detector needs to process and register the
response signal from one quantum of radiation.
¨ Dead time
of detector is the time interval from the detection of
one quantum, during which the detector is not able to correctly
detect another quantum. During this time, the detector is either
insensitive to radiation, or the second response signal would be
composed of the first (eg pile-up
effect, see §2.4, section "Scintillation spectrum"
below).
The dead time of the detector causes some
quantums, that come "too fast in succession" not
to be detected. This leads to a reduction in the
detection efficiency, and (worst of all) this detection
efficiency is not constant, but depends
on the intensity of the analyzed radiation - a non-linearity
of the response arises. This can lead to significant errors
in measurement procedures.
The issue of dead time, its
measurement and correction, will be discussed in more detail
below in §2.3, section "Dead time").
Background
of the detector
For each of the real measurement device, and therefore the
radiometer, over the measured signal is translates and
superimposed a "zero" signal - the so-called background.
The background of a radiometric detection device generally has
three origins :
1.
External radiation
from the surrounding space - a small amount of ionizing
radiation is always present in our environment and in the
laboratory. This radiation comes from many sources, such as
cosmic radiation and its interaction with the atmosphere,
terrestrial radiation from radioactive minerals in soil and
rocks, from building materials of buildings (there
is mainly potassium 40K), from radon gas, from fallout
during tests of nuclear weapons and nuclear accidents.
Furthermore, it can be radiation from surrounding insufficiently
shielded sources, radioactivity of spectrometer components and
the like. The background from the outside can be significantly
reduced by thoroughly shielding the detector.
The background of the unshielded and shielded detector is
compared in detail below in Fig.2.1.5.
2.
Internal
radioactivity of the detector material , which may be of
dual origin :
¨ Sensitive
detector material may contain long- lived natural
radionuclides. These natural radionuclides are
ubiquitous and difficult to clean the detector material
completely from them. In organic scintillators, a small amount of
radiocarbon 14C is present. Of the commonly used detectors, the LSO
scintillator has the highest internal radioactivity (approx. 250Bq/cm3 of the natural radioisotope 176Lu - see the section "Scintillators ...",
passage "Internal radioactivity LSO ").
¨ Nuclear
reactions and activation of the detector material
may occur inside the detector due to external radiation. Both
short-term and long-term radionuclides can be formed, which
internally contaminate the detector (these phenomena are discussed in more detail below in
the section "Aging and radiation wear of detectors",
section "Nuclear reactions and induced radioactivity
inside detectors").
Radionuclides (natural and induced)
contained in the detector material during their radioactive
transformations emit quantum radiation, mainly beta and gamma,
which are detected with high efficiency. This internal
radiation background contributes to the overall
background of the detector.
3.
Electrical noise of
the device arising due to quantum fluctuations in the
movement of electric charges in the detector itself, in the
photomultiplier (in the case of
scintillation detectors) and amplifying
electronic circuits. Radiometer noise can be significantly
reduced by cooling detector and preamplifier to
the temperature of liquid nitrogen or even helium.
Electronically, the resulting noise can be reduced by
appropriately setting the lower discriminant level, or by using a
coincident connection of two or more detectors.
For correct measurement, the background
must be subtracted from the resulting measured
values. Problems occur when the measured radiation is so weak
that it is comparable to the background intensity. The background
adversely increases minimally detectable
radiation intensity or minimally detectable
radionuclide activity - it reduces the sensitivity
of detection.
Combinatorial
background
In more complex multi-detector systems (as above in Fig.2.1.3),
where the resulting measurement response is created by a certain combination
signals from individual detectors, when simultaneously detecting
a large number of particles, coincidence or anticoincidence
signals originating from different, unrelated processes may be incorrectly
paired. False data generated in this way is sometimes
referred to as combinatorial background. It
plays a negative role, especially in complex detection systems
for accelerators, where a large number of quanta are created
almost simultaneously during interactions and the investigated
rare phenomena can then be lost in the combinatorial
background...
Spectrum
General physical and instrumental influences have their specifics
in radiometers operating in spectrometric mode. Ideally, the
measured (instrumental) spectrum n = n(E) should be identical
with the actual (physical) spectrum N = N(E) of the emitted
radiation. In reality, however, the measured spectrum differs
from the actual one due to some distorting physical and
instrumental effects :
- Energy resolution
Above all, it is the imperfect resolution
of the spectrometer, which cannot distinguish near
energies of radiation. The measured spectrum n(E) is then
the result of the convolution of the
real spectrum N(E) and the response function
LSF(E, E´) of the spectrometer :
n
(E) = -¥ ò + ¥ LSF (E, E´). N (E) dE´ .
The response or resolution function LSF(E, E´)
- Line Spread Function - represents the response
of the spectrometer to monoenergetic radiation of energy E
and unit intensity d(E -E´), where d is Dirac's d- function.
The LSF(E, E´) response function in the
variable E´ usually has a bell shape close to the
Gaussian curve, its width often depends on the energy E.
The half-width of the LSF response function is
called the (energy) resolution of the
spectrometer. It is expressed either absolutely in [keV],
or relatively as the ratio of the half-width of the
photopeak and the energy in [%].
This convolutional
distortion manifests itself as a spectrum
blur which smoothes event. fine details in the
spectrum. It is therefore a natural effort to achieve the
best possible energy resolution of spectrometers.
However, this is not always possible, it encounters
limitations of a physical and technical nature (see below). In addition,
the resolution and detection efficiency (sensitivity) of
the spectrometer often compete with each other, so trying
to achieve the best possible resolution can unbearably
degrade the detection efficiency...
Note: In
some cases, an "additional improvement" of the
energy resolution can be made - partial deconvolution
of the spectrum - in mathematical analysis and
computer evaluation of the spectra, see below "Gamma-ray spectrometry".
The spectrometric
resolution depends mainly on nuclear, material,
geometrical, electrical, or optical, effects inside the
detector. There are three main causes of imperfect energy
resolution spectrometric detectors :
1. Statistical fluctuations
of basic carriers of information about energy of detected
quanta. When detection of quanta (particle, photon) of
energy E, the number of n scintillation
photons or electron-hole pairs is released : n = h .E ( h is the
conversion efficiency of the detector material). However,
this is only on average, in fact, even with the same
energy, a slightly higher or lower number of information
carriers is released each time, n ± Ön, so that the
statistical variance is 1/Ön. This statistical
variance "scatters" the amplitudes of the
output pulses for individual cases of detection - thus blurring
the photopeak. This is also related to the ionization
energy of detector material: the lower the
ionization energy, the more ions (and scintillation
photons or electron-hole pairs) are released and the
smaller the statistical fluctuations in pulse detection.
The lowest ionization energy is in semiconductor
detectors (approx. 3eV/ion), therefore the best energy
resolution can be achieved here. For gas proportional
ionization energy detectors, it is about 30 eV, but due
to the low interaction efficiency, these detectors are
not very suitable for spectrometry. In scintillation
detectors, the ionization energy is of the order of 100
eV, so they do not excel in resolution, but have a high
detection efficiency.
2. Nonlinearity - disproportionality
- detector signal responses to quantum
energy inside the detector. There is a complex cascade of
interactions in the detector material, and contributions
from photons and electrons of various energies contribute
to the resulting response. If the output signal (number
of scintillation photons or amplitude of the electric
pulse) is not proportional to the energy of the
particles, even with the same energy of the primarily
detected quantum, the resulting response will be somewhat
different each time, depending on the total energy
distribution between secondary particles with different
energies.
3. Inhomogeneity conversion
efficiency of detection in different places of the
detector and inhomogeneity of signal collection
(scintillation photons or electron-hole pairs) from
different places of the sensitive volume of the detector.
At the same energy of the detected quantum, we usually
get a slightly lower signal from the peripheral parts
than from the central part of detector. These different
responses add up to an extended (blurred)
photopeak .
For scintillation detectors, the
analysis of the individual causes of deterioration of
energy resolution is discussed in more detail below in
§2.4, section "Scintillation spectrum".
Scintillation
detectors have an energy resolution of several tens of
keV, typically 60keV (10%) on a 662keV photopeak of 137Cs.
High-quality spectrometric semiconductor detectors (Ge
(Li), HPGe) have more than 30 times better resolution, of
the order of 1 keV.
- Nonlinearity
(of energy and efficiency)
Another influence that distorts the
shape of the measured spectrum may be the possible nonlinearity
of the energy response of the spectrometer and
the energy dependence of the detection efficiency. These
effects can be eliminated by careful energy and
efficiency calibration of the
spectrometer (an example of such
calibration is given below in §2.4 "Scintillation Detectors", section "Gamma Spectrometry").
Note:
This is the overall resulting non-linearity
of the spectrometer, not the internal disproportionate
nature of the partial response mentioned in point 2 of
the previous passage "Energy resolution".
- Scattered and
secondary radiation
Along with the primary radiation emitted by the studied
nuclear process, there is always secondary
radiation caused by Compton scattering,
excitations and deexcitation of atoms both in the
radiation source itself and in the detector material, as
well as in the construction material of the cover,
screens and collimators defining the radiation beam ("albedo" of these materials, see
§1.6).
- Background spectrum
For each real radiometer, and thus also the spectrometer,
over a measurement signal (MS) translates and
superimposed a "zero" background signal.
The background also has its own spectrum, the shape of
which depends on the origin of the background (individual background sources of radiometers
were analyzed above in the section "Background
of the detector").
Electronic noise produces significantly high values at
the beginning of the spectrum, in low energy regions (usually cut off by the lower discriminant
level). The photon background from external
natural radiation contains mainly a continuous
part corresponding to Compton scattered and
braking radiation photons derived from the muon and
electron components of secondary cosmic radiation and
from terrestrial radiation. However, it may also contain discrete
photopeaks; the 1460 keV gamma photopeak from
the widespread natural potassium 40K (it is contained in
soil, building materials, concrete, glass, in our bodies) is almost always present. Furthermore, there
are weaker gamma peaks in the spectrum coming from the
decay series of thorium and uranium, especially from the
radionuclides 214Bi, 214Pb, 208Tl, 228Ac, which enter the air with radon gas 220,222Rn. The
last g-peak that can be identified after several hours
of acquisition in the natural background spectrum is 2614
keV from 208Tl, which is one of the daughter products of the
thorium decay series (it enters the
air with 220-Rn gaseous radon, of which it is one of the
decay products); trace amount then
3185 keV from 214Bi. Natural radionuclides
are discussed in more detail in §1.4. "Radionuclides". The continuous
spectrum extends to the highest energies of many GeVs
(derived from cosmic ray interactions), albeit with a
very slight intensity.
Such a natural background spectrum is measured in
Fig.2.1.5 by a scintillation spectrometer with a NaI(T1)
scintillator of medium volume of about 100 cm3. When
measured with an unshielded detector (upper part of the
figure), in addition to a significant continuous
component, the 1460 keV peak of potassium 40K and other
weaker peaks from natural decay series are clearly
visible.
 |
Fig.2.1.5.
The spectrum of the natural radiation background
measured by a scintillation detector NaI (Tl)
with a diameter of 5 cm and a height of 5 cm.
Above: Free-standing
detector without shielding. Bottom:
Detector surrounded by a robust 7 cm thick lead
shield.
The basic spectrum (middle
part of the figure) in the energy range 0-3 MeV
was measured with an acquisition time of 12
hours. The figures on the right show a reduced
section of 3-6 MeV from the adjoining high-energy
part of the spectrum acquired by 48-hour
acquisition. |
When the detector was
equipped with a massive shield (7cm lead, lower part of Fig.2.1.5) , the background decreased more than 10 times
and the 1460keV photopeak of 40K potassium almost disappeared (the rest is potassium contained in the glass,
from which the photomultiplier flask is and a
scintillator window). The 2614keV
peak almost disappeared (because 208Tl in the
air inside the shield disintegrates quickly and the new 208Tl does not
get into the enclosed space), the
3185keV peak of 214Bi is at the resolution limit. The continuous
spectrum is formed by the interactions of high-energy
quanta from cosmic rays and the internal radioactivity of
the scintillator. At the beginning of the spectrum, a
clear peak of the characteristic X-ray of lead can be
seen, which arises during the photoeffect of high-energy
radiation in the lead atoms of the shield. The continuous
spectrum continues up to the highest energies (for high-energy and muon radiation, lead
shielding acts as a "target" in which
interactions cascade occur).
The continuous part, corresponding
to beta radiation, with event. gamma peaks, we also
observe in the background spectrum from the internal
radioactivity of the detector material (see, e.g., the spectra
of the internally activated NaI(Tl) scintillator in Fig.
..., or the spectrum of the LSO crystal containing the
natural radionuclide 176 Lu in Fig. ...).
Careful measurement of the
background spectrum should precede the
spectrometric work itself, as increased background and
background peaks could be misinterpreted in the
measurements. The background spectrum can reveal event.
contamination of the detector or its surroundings. For
correct spectrometric measurements, the background
spectrum must be subtracted from
the measured spectrum. Problems occur when the measured
radiation is so weak that it is comparable to the
background intensity. Then the "useful" peaks
in the spectrum of the measured radiation are lost in the
noise and are difficult to detect.
- Time instabilities
The time variability of the electronic parameters of the
spectrometer can negatively affect the accuracy of
measuring energies and intensities of individual
components of the analyzed radiation. Therefore, in the
case of top research spectrometers, great attention is
paid to the electrical stabilization of
voltages and currents, as well as to the stabilization of
the temperature of individual parts of the spectrometer.
Electronic methods of feedback stabilization are also
used. In addition to electronic influences, there may
also be physico-chemical changes in the detector
materials - see below "Aging
and radiation wear of detectors" .
Other influences that may affect the accuracy
of radiometric (and especially spectroscopic) measurements are
possible mechanical and thermal instability,
influence of external fields (especially photomultipliers in scintillation detectors
are highly sensitive to magnetic field ) and detector selectivity (ratio of detector sensitivity for registration of
required type of radiation with respect to sensitivity for
registration of other types of radiation).
Specific properties and
use of different types of detectors
The specific properties of different types and designs of
detectors must be carefully considered when using them in
different applications of ionizing radiation. Strong radiation
fluxes (eg in radiation beams in radiotherapy) are best measured
with an ionization chamber, which has a low detection efficiency,
but shows a linear response even for high radiation intensities.
Operational monitoring of weaker and medium-strong radiation for
the purposes of radiation protection, where in principle high
accuracy cannot be achieved, is most often performed by GM or
proportional detectors. Measurement of radioactive samples,
natural materials and environmental radiation is performed using
highly sensitive scintillation and semiconductor detectors, with
a low background (for example, is not
suitable LSO scintillator with relatively high intrinsic natural
radioactivity). Semiconductor spectrometers
with high energetic resolution are used in neutron activation
analysis, X-ray fluorescence analysis, and nuclear physics
research. Accurate spectrometry of charged particles - electrons
(beta radiation), protons, alpha-particles - can be performed
only on magnetic (or electrostatic) spectrometers (in which, however,
a non-spectrometric detector can serve as a sensor). Detection of high-energy cosmic rays and neutrinos is
performed experimentally mainly using Cherenkov detectors. In
nuclear medicine, where we need high detection efficiency without
the need for high energy resolution, scintillation detectors and
their imaging systems - gamma cameras - are used. For hybrid
PET/MRI combinations (positron emission
tomography + nuclear magnetic resonance),
special semiconductor photodiodes are used in PET camera
scintillation detectors, instead of photomultipliers that would
adversely affect the magnetic field.
All these aspects of
the suitability of using different types of detectors will be
discussed in more detail below in this chapter (§2.3 - 2.8), in
the relevant parts of Chapter 3 "Applications
of ionizing radiation",
Chapter 4 "Radionuclide scintigraphy", for neutrinos in §1.2, part "Neutrinos - "ghosts" between particles", for cosmic radiation in §1.6, passage "Detection and
spectrometry of cosmic radiation".
Radiation
detection by type, energy and intensity
The choice of detection methods and devices naturally depends
primarily on the properties of the radiation we want to analyze -
the type of radiation, the energy of its quanta and their
abundance (radiation intensity). We will mention here some of the
problems we generally encounter in detecting
radiation of different types, energies and intensities. We first
notice the type of radiation :
¨ Photon g and
X radiation are relatively easiest to detect
with the help of ionization chambers (including GM detectors),
scintillation and semiconductor detectors. This applies in
particular to radiation of medium energies of tens to hundreds of
keV and intensities of approx. 10 ¸ 104 photons /second. Details below §2.4 "Scintillation
detection and gamma-ray spectrometry",
§2.5 "Semiconductor detectors".
¨ Corpuscular radiation a, b , p+ is more difficult to detect - due to
its low penetration in the substance it is
difficult to get into the sensitive volume of the detector, it is
often absorbed in the material of the sample itself - see below Detection
of alpha, beta radiation".
Effective detection can be achieved using special methods, such
as the use of liquid scintillators.
¨ Neutrinos radiation is
the most difficult to detect of all known types
of radiation, due to the extremely weak interaction of neutrinos
with matter. It is possible to detect only in very limited
extent, using very voluminous detection systems - see §1.2,
section "Neutrinos - "ghosts" between particles".
It also depends on the intensity of the
detected radiation :
l Radiation of medium intensity ,
approx. 10 ¸ 105 particles per second, is again relatively easily
detected if we have a detector sufficiently sensitive to the
given type of radiation (with sufficient detection efficiency).
l Low intensity radiation
,
significantly weaker than 1 particle/second, is difficult to
measure accurately. It is often overhelmed by the natural background
and noise in the detector, the measured values are significantly
affected by statistical fluctuations. It is
desirable to use detectors with a high detection efficiency and a
low level of self-background, well shielded from external
radiation, including natural radiation background. To reduce the
effect of statistical fluctuations, the measurement times are
quite long - to accumulate a sufficient (statistically
significant) number of useful pulses.
l High intensity radiation ,
such as tens of millions of particles/second, can overload
the detector (dead time, cumulative processes)
and prevent accurate measurements. When exposed to strong
radiation, radiation-induced chemical reactions can occur in the
detector material, deteriorating the detector's properties -
reducing detection efficiency and deteriorating resolution.
Immediately after such overexposure, the detector may exhibit an
increased intrinsic background, caused by deexcitation of
metastable levels and chemiluminescence of molecules released by
radiation in the detector during intense exposure. Extreme
radiation intensity can damage the detector
irreversibly ! Suitable detectors with low detection efficiency
and linear response, such as ionization chambers, are used to
measure strong radiation. Furthermore, with the help of shielding
or collimation, we can select a certain defined
"sample" of the analyzed radiation and measure it
correctly even with the help of a sensitive detector.
The
radiation detection methodology is significantly dependent on the
energy of radiation quanta :
×
Medium energy radiation
,
keV units up to tens of MeV, can be detected in the case of usual
types of radiation (g, b, a, p+,
...) without major problems using ionization chambers,
scintillation and semiconductor detectors.
× Low energy radiation
,
less than about 1keV, is very difficult to detect.
Due to the high absorption in the substance (low
permeability), it is difficult to penetrate into the sensitive
volume of the detector and causes a low response
in it, often overlaid by quantum noise. Low-energy corpuscular
radiation is often undetectable (this is absolutely true
for neutrinos due to their very small cross-section of the
substance interaction).
×
Radiation of high energies
,
higher than hundreds of MeV, of the order GeV and TeV, often
shows a low effective cross section of the
interaction with the detector substance, which reduces
the detection efficiency - most quanta can pass through
the detector without response. In particular, the spectrometry
of such radiation is difficult because high-energy quanta lose
only a small part of their energy in conventional detectors.
Special robust detection systems, called calorimers,
are used here, composed of massive absorption layers interspersed
with detectors (these detect emerging sprays of secondary
particles). High energies can be encountered in large
accelerators or in cosmic rays. In addition to the technical
difficulties of measuring high-energy radiation, it is necessary
to draw attention to the risk of radiation-induced
internal radioactive contamination of the detector
material, discussed in more detail in the following paragraph,
section "Nuclear reactions and induced radioactivity
inside detectors".
Aging and radiation wear of detectors
Like any device (and object and material in
general ...) , the ionizing radiation
detector is not immutable and eternal. Its
properties change over time and during use.
Changes in properties can be short-term or long-term, reversible
and irreversible. Short-term reversible changes - device
instabilities - were mentioned above. Sudden irreversible
changes belong to the category of device failures. Here
we will briefly touch on longer-term irreversible changes
- the "aging" of detectors. In practice, we can
distinguish two types of these irreversible time changes of the
detector properties :
l Spontaneous temporal changes in the
properties of the detector
due to physical and chemical influences inside or by effect of
the external environment. A typical example is yellowing of
scintillation crystals NaI(Tl) (see
Fig.2.4.8 in the section " Inorganic scintillators")
, deterioration of optical contact between
scintillator and photomultiplier, or gradual changes in gas
pressure in ionization chambers (eg gas leakage through chamber
leaks).
l Radiation
damage and depletion of detection material
due to physico-chemical processes during interactions with
detected radiation. When detecting radiation g and b lower and medium
energies, low-density excitations and ionizations occur, with
subsequent deexcitation and recombination usually leading to the restoration
of the original properties of the material.
Scintillation or ionization detectors g and b can work for many years
without significant wear. When heavy charged particles and
neutrons are detected, massive ionizations occur, or even nuclear
reactions, in which considerable energy is transferred locally.
There is damage to the crystal lattice, chemical changes, or even
transmutations of atoms of the detector material (see below "Nuclear reactions and induced
radioactivity inside the detectors"). The active area of the
detector is thereby radiation damages and depletes.
All these phenomena can lead to a gradual reduction
of detection efficiency and in more complex detectors to
deterioration of other parameters such as energy resolution,
spatial resolution, homogeneity and linearity of the image. Aging
and radiation wear of detectors are significantly reflected in
systems where detectors are exposed to high energy fluxes for a
long time. These are, for example, monitoring detectors in
nuclear reactors, detection systems (trackers and calorimeters)
of secondary particles on accelerators, dosimetric devices on
irradiators in radiotherapy. This leads to a limited
lifetime of the detectors.
In normal conditions, detection,
spectrometry and scintigraphy of gamma radiation with energies of
tens and hundreds of keV and pulse flows up to about 3.105 cps, however no
radiation "aging or wear" occurs.
Radiation damage to
the detector by intense flux of radiation
Strong flux of ionizing radiation in the detector causes
radiolysis and dissociation of molecules of the
detector material, eg in the NaI (Tl) detector of the NaI ® Na+ + I-.
Dissociated molecules can recombine immediately or with a certain
time delay. During recombination, light photons are often emitted
- chemiluminescence occurs. If the dissociation of the
scintillator molecules persists for a long time, these photons,
registered by the photomultiplier, can significantly increase
the internal background of the detector in the region of
low-amplitude-energy pulses. This phenomenon lasts a transient
time, after the recombination is completed, the internal
background quickly returns to the original value.
Ionization chambers are highly
"resistant" to strong radiation fluxes, which can
measure over a wide range of intensities with an almost linear
response. Scintillation detectors in the "on" mode
(with high voltage on the dynodes) must not be exposed to high
radiation fluxes (> approx. 107 quant/s) in order to avoid overloading the
photomultiplier dynodes with a high flux of electrons and their irreversible
damaging !
Nuclear reactions and induced
radioactivity inside detectors
If high energy radiation (> 10MeV) or neutron
radiation enters the detector, the (photo)nuclear
reactions may occur in the detector material (as well as
in the construction material of the envelope, shield and
collimator) (see §1.3 "Nuclear reactions and
nuclear energy" and §1.6 "Ionizing radiation", part
"Interaction of
gamma and X - rays" and
"Neutron radiation
and its interactions").
In some of these reactions, radioactive nuclei
may be produced - induced radioactivity is
formed inside the detector, internal radioactive contamination of the
detector occurs. Such an internally activated detector
after exposure to high-energy or neutron radiation may have impaired
detection properties: it has a higher internal
background and spectrometric analysis shows a disturbing
artificial spectrum - continuous beta, or gamma or
characteristic X-ray peaks. Fortunately, this phenomenon lasts
for a transitional period before the induced
radioactivity decays with the corresponding half-life. However,
this circumstance must be taken into account if we want to
measure with a detector that was previously located in the field
of high-energy or neutron radiation (either during the actual
measurement or even switched off). The induced activity can be
many kBq, which can invalidate particularly sensitive
measurements of weak radiation fluxes and low activities.
Internal activation of
the NaI (Tl) scintillation detector
An example of this phenomenon is the NaI(T1)
scintillation detector (discussed in detail below "Scintillation
detection and spectrometry").
Due to neutrons, nuclear reactions can occur inside the crystal
(n, g):
127I + n ® 128I + g , in which
radioactive iodine-128 is formed from the original inactive
iodine-127, which with a half-life of 25 min. by b- decay
(Ebmax = 2.12MeV) it
converts to stable 128Xe and from 6.5% by electron capture to 128Te. In addition to
beta radiation with a continuous spectrum, gamma radiation 441keV
and characteristic X-radiation are also emitted. This internally
induced 128I
activity produces an artificial continuous b- spectrum extending up to
over 2 MeV and a characteristic X-ray peak of tellurium 26 keV.
The phenomenon lasts with a decreasing tendency for several
hours, until iodine-128 decays.
Similarly, when irradiated with high-energy photon
radiation (energy greater than about 15MeV)
the photonuclear reactions ( g , n) 127I + g ® 126I + n can occur inside the NaI(Tl) crystal , which
produces radioactive iodine-126, which with a half-life of 13
days is converted by 44% by b- decay (Eb max = 1.25MeV) to
stable 126Xe
and 55% by electron capture to 126Te. In addition to electron beta radiation with a
continuous spectrum (reaching over 1 MeV), gamma radiation of
386keV and 667keV is emitted, as well as characteristic
X-radiation of Te with an energy of 26keV. In this case, the
detector is internally contaminated for several weeks!
The scintillation spectrum of this internal
contamination, measured by the same detector, differs
significantly from the spectra of the respective radionuclides
from external sources. Some quantum b, g, X are detected coincidentally,
so the resulting pulses are summed. As a result, some gamma peaks
are not present in the spectrum (the apparent "mystery of
lost gamma") - their pulses summed by the signals from the
electrons, fall into the continuous beta spectrum; for this
reason, we do not see in the spectrum, for example, the g- peak 411keV 128I or the peak 386keV
126I.
Other peaks have shifted energies due to superposition with
characteristic X-rays; eg peak g 667keV 126I we see an
widespread and in a higher position around 690keV, caused by a
coincidence sum with a characteristic X-ray of 26keV.
For germanium -based semiconductor
detectors, the radionuclide 71Ge (decays with electron capture, T1/2
= 11.4 days) can be formed either by
neutron capture from a stable 70Ge, or by a photonuclear reaction (g , n) from 72Ge. Some gallium
radioisotopes can also be formed here by neutron capture, eg 72Ga (T1/2 = 14 hours, b- 3.15 MeV, a number of g lines from 0.6 to 2.5 MeV)
and to a lesser extent several other short-term ones.
For silicon semiconductor detectors can
induce only a small number of short-term isotopes - neutron or g activation by
aluminum isotopes, eg 28Al (T1/2 =
2.3min., b-
2.85MeV, g 1.78 MeV).
In ionization chambers filled with xenon (which
is a mixture of a number of stable isotopes from 124-136Xe), neutron or
gamma activation can produce various radioisotopes of iodine
(including the known 131I) and xenon, but due to the low density of gaseous
xenon only in small amounts, usually does not affect the
properties of the chamber.
2.2.
Photographic detection of ionizing radiation. Material detectors.
All photographic and material detectors operate in a
cumulative (integral) mode in the sense of the classification in
§2.1. We will first describe photographic detection, which is
the most common.
In photographic detectors, the detection
medium is photographic material. When ionizing
radiation enters this photographic material *) containing silver
halides (such as silver bromide AgBr), a photochemical
reaction occurs at the ionization sites.
*) The use of photographic materials was
the first and oldest method of indicating nuclear radiation; with
help of her, H.Beckerel also discovered the radioactivity of
uranium ore.
Photochemical
reaction
Below the photochemical reaction
generally we mean any chemical reaction caused by the incidence
of light or other radiation - interaction radiation
quanta (photons, electrons, protons, a particles etc.)
with atoms and molecules of the substance. The most important
photochemical reaction in nature is photosynthesis in plants.
Photochemical reactions are used in photography, leading to such
chemical changes in the light-sensitive material,
which can be used to visualize the spatial distribution of
radiation - for photographic imaging.
Photographic (light-sensitive) materials are formed
by small crystals of silver halide (now it is almost
always silver bromide, crystal size approx. 1 mm, density approx.
109/cm2), which are dispersed
in a gelatin layer. This so-called photographic emulsion
is coated on the surface of a plastic foil - film; glass
photographic plates were also used in the past. In the
silver bromide molecule AgBr, the silver and bromine atoms are
bound by an ionic bond - Ag+ Br-, which is relatively weak; the AgBr crystal lattice
forms a cubic system.
The classical photochemical reaction is
caused by the absorption of a light photon f, whose energy
h.n releases
an electron from the bound bromine atom (bromide ion Br-): Br- + f ® Br + e-. The
released electron can be absorbed by some silver ion Ag+ bound in bromide: Ag+ + e- ® Ag, thus forming
a neutral silver atom. This is the primary
photochemical reaction in which the energy of the photon
must be higher than the binding energy of the molecule that is
cleaved during photolysis. Due to these processes,
the disintegration ( photolysis ) of silver bromide
occurs. A similar photochemical reaction occurs when irradiation
of photographic material with ionizing radiation,
which causes the decomposition - radiolysis
- of silver bromide. The result is the release of silver
atoms from its bond from the AgBr compound and formation
the latent image.
At first we would not see anything with
the naked eye on the exposed layer, the image is
"hidden" (latent), formed only by sparsely distributed
silver atoms. The physicochemical change in the tiny silver
bromide crystals is made visible only during invocation - development.
The development process is an electrochemical reaction in which
electrons are primarily transferred from the developing agent to
AgBr via the silver atoms in the latent image. Developers
(usually methanol and hydroquinone) cleave bromine (which passes
into the developer) from exposed bromosilver particles, reducing
the original silver bromide to metallic silver.
From the hydroxyl group OH bound to the cyclic hydrocarbon
(benzene nucleus) of the developing agent, a hydrogen ion is
cleaved off, which combines with a bromine ion to form HBr
(dissolved in the developer) and a silver atom of Ag. The
developing agent penetrates (in dissociated form) to the germs of
the latent image, transfers AgBr to its electrons, and silver
is reduced . By encountering the transferred electrons
with other silver Ag+ ions in AgBr, the reduction process is further
transferred to the silver bromide crystal and further silver is
released. The effect of the microscopic latent image is initiating
and catalytic - the chemical process of reduction
gradually captures the whole grain of silver bromide, a large
number of silver atoms is formed (multiplication factor of about
108). This
process occurs only on those AgBr crystals, which already
contained several atoms of photolytically excluded silver before
development. The different degree of exposure of the photographic
emulsion is thus made visible by the density of
the colloidal silver grains. The remaining unilluminated and
undeveloped silver bromide is removed from the sensitive layer by
dissolving in a fixer (aqueous sodium sulfate solution).
After exposure to ionizing radiation, the blackening
density of the developed photographic material is proportional
to the ionization density at that location, and thus the
amount of ionizing radiation energy that has been absorbed at
that location. By macroscopic observation or measurement of the total
blackening of photographic material, or its individual
places, we can determine intensity - amount
of radiation in dosimetry and X-ray diagnostics or
defectoscopy, by microscopic observation of
grains of released silver in the photoemulsion can then observe
and evaluate the paths of charged particles in
special nuclear emulsions (see below).
Film dosimeters , X-ray
films
Simplest use of photographic detection of ionizing radiation, are
film dosimeters. The basis of the film dosimeter
is a small rectangle of photographic film, tight against of light
packed in black paper (it differs from
ordinary photographic film in that it has a thicker emulsion with
a higher content of silver bromide). The
ionizing radiation passes through the film coating and creates a
latent image in the photoemulsion, which is visible after
development. The optical density of the graying or blackening of
the film, which can be evaluated photometrically, is then a
measure of the integral amount of radiation that
has passed through the film during exposure; this also indicates
the dose of radiation that would be absorbed in
the substance exposed to this exposure. For small doses of
radiation, there is an approximately linear relationship
between the dose of radiation and the blackening of the
photographic material, at higher doses the blackening grows more
slowly and then reaches a state of saturation.
Note: For the
objective determination of the radiation dose, a standardized
development procedure should be used and the blackening should be
compared with a reference film irradiated with a known radiation
dose.
Fig.2.2.1. Personal film dosimeter used to monitor workers.
(Thermoluminescent TLD and photoluminescent
OSL dosimeters are discussed below ,
Fig.2.2.2)
Film dosimeters are mainly used for
personal dosimetry of workers with ionizing
radiation. The film frame itself is inserted into a plastic
case (Fig.2.2.1), provided with several small thin
rectangles of copper and lead plates of different thicknesses,
which serve as filters absorbing radiation g depending on its
energy. These filters are used to correct the dependence of
blackening on the energy of radiation, and by comparing the
blackening under individual filters, it is possible to estimate
the type and roughly the energy of radiation (of course, the film itself does not have spectrometric
properties). The film dosimeter is worn by
workers at the reference point (left pocket on the shirt) and
regularly (usually once a month) is exchanged, developed and photometrically
evaluated; using a suitable calibration factor, the
resulting measured value is the radiation effective dose
in mSv.
A similar type of film (usually of much larger
dimensions) is used for X-ray imaging in planar
X-ray diagnostics (§3.1 "X-rays - X-ray diagnostics"), as well as in
defectoscopic measurements (§3.2 and 3.3). After development,
the images on these films are evaluated either visually or
photometrically.
Autoradiography
This laboratory radiographic method consists in photographically
imaging the distribution of the radioindicator in the
examined objects in close contact *) of the
photographic emulsion with the sample (the
prefix "auto" indicates that the radioactive
substance is inside the sample). The
radioactive sample is attached - pressed to the photoemulsion,
which is then exposed in the dark (in a
light-tight housing) for some time.
Sensitive photographic film photochemically captures the emitted
beta or alpha radiation (gamma radiation
here contributes only slightly to blackening). After development, differences in the local
concentration of the radioactive substance are manifested by
varying degrees of blackening of emulsion, on
which we can see the distribution of structures with higher or
lower accumulation of radioindicator.
*) Image quality
Tight contact of the photoemulsion with the sample is
necessary to achieve good sharpness and spatial resolution of the
autoradiographic image. Image "collimation" is achieved
by each site of the photographic emulsion receiving the largest
contribution of radiation from the area of the sample that is
closest, while from other - more distant areas - the beta/alpha
flux density decreases rapidly (even faster
than according to the standard law of the inverse square of
distance, because this radiation is strongly absorbed in the
substance and has a short range). It is
obvious that the image of the radioactivity distribution will be
sharper the closer we press the photographic film to the sample.
With increasing distance of the photoemulsion from the sample, or
its thickness, the sharpness and resolution deteriorate rapidly.
The quality of the image also depends on the energy of the
emitted beta radiation. For lower energies with shorter electron
range we can achieve better resolution (eg
with low-energy phosphorus 33-P we can achieve better resolution
on autoradiograms than with high-energy 32-P - see §1.4, passage
"Phosphorus, Sulfur").
Beta-radionuclide-
labeled radioindicators, such as tritium 3 H, radiocarbon 14 C, phosphorus 32.33
P, sulfur 35 S, are most often used for
autoradiography of biological preparations. If selective
pharmacokinetics are appropriate, radioindicators labeled with
radioiodine 131I (or 125I ), yttrium 90Y , in the 1970s also 198Au, and other suitable radionuclides are also used. The
required applied activity depends on the radionuclide used, the
degree of accumulation of the radioindicator in the investigated
structures, the sensitivity of the emulsion, the exposure time.
These parameters are influenced by a number of factors, they are
optimized empirically (according to
experience, to obtain sufficient blackening is per 1cm2 photoemulsions
need exposure of about 5-10 million beta electrons, or about 2
million alpha particles).
In addition to classical autoradiography,
electronic digital autoradiography is now used
in larger specialized laboratories, where instead of a
photographic emulsion, the imaging is performed using a flat
system matrix of semiconductor detectors (similar to so-called flat panels in radiology,
see "Electronic X-ray imaging"), attached to the sample.
They make it possible to perform online quantitative
autoradiographic analysis operatively in a short time.
And if the
distribution of the radio indicator does not need to be
registered in image form, it is enough to use a simple radiometric
detector (possibly
several parallel detectors), which passes
over the sample and measures the profilogram of the
radioactivity distribution. This simple method is routinely used
especially in radiochromatography (§2.7
"Measurement of radioactivity of samples", passage "Radiochromatography").
Autoradiography is often used in laboratory methods of
molecular biology and genetics. According to the size of the
analyzed tissue samples, we have two groups, the third group
concerns the imaging of electrophoretic and chromatographic
samples :
1. Macro-autoradiography
, which shows the distribution of radioactivity in structures the
size of millimeters and centimeters (so we
can assess differences in blackening with the naked eye). Thus, after previous application of the
radioindicator, sections of organs or their parts can be
displayed - Fig.2.2.2 a .
2. Micro-autoradiography
shows histological tissue sections or cytological samples (coatings on a microscope slide) obtained
after previous application of a biologically targeted
radioindicator. The structure of blackening after exposure is
evaluated under a microscope - Fig.2.2.2 b (and
can be confronted with the classical observation of a stained
specimen under a microscope). By using thin
sections and fine-grained photoemulsions, a high resolution of
3-5 micrometers can be achieved, down to the subcellular level.
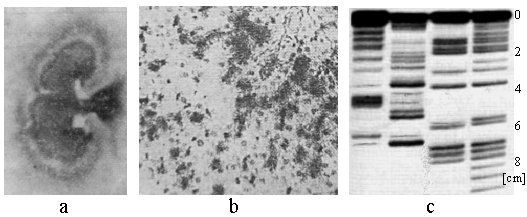
Fig2.2.2. Examples of three types of autoradiography. a)
Macro-autoradiogram of a kidney section of a
laboratory animal after application of the radioindicator 131I-hipuran.
b) Micro-autoradiogram of a histological section
of the liver with a radiolabeled colloid which is taken up in
Kuiper cells.
c) Autoradiography of 4 samples of the sequence
of DNA fragments labeled with 32P radiophosphorus and separated by gel electrophoresis.
3. Molecular
separation analysis of sequenced samples
Very important is the use of autoradiography in the sample
analysis, in which the desired radiolabeled molecules divided - sequenced
- by the length of their chains separated in a chromatography
column, or more usually by electrophoresis in a gel -
see below §2.7, part "Radio-electrophoresis".
Gels form a dense network - a "molecular sieve"
through which larger molecules pass more slowly than smaller
molecules. The analyzed molecules are thus gradually divided
according to their size (fragment length) at a distance of several millimeters to centimeters. If
they are labeled with beta-radionuclide, after applying the
photoemulsion we can display them autoradiographically
in the form of "strips", where the separated molecules
traveled according to their size (in terms
of geometric dimensions it is a macro-autoradiography) - Fig.2.2.2 c. Detected positions of individual
fragments are compared with the standard sample analyzed in
parallel.
Note: Current
routine biochemical DNA sequencing methods use fluorescently
labeled nucleotides, which are analyzed by capillary
electrophoresis in a large number (several dozen) of
parallel capillary sequencers, the fluorescent light being
registered by means of a sensitive optoelectronic detector. These
new sequencing techniques allow very fast and relatively
inexpensive "reading" of entire genomes. A huge amount
of sequence data obtained in this way is processed by computer -
it becomes the subject of bioinformatics.
Material detectors
Material detectors use some permanent small physical and
chemical changes that ionizing radiation causes as they
pass through suitable substances (materials). These can be
excitations, structural changes in the crystal lattice,
polymerization, changes in optical properties (such as color),
electrical conductivity. The extent of these effects is
proportional to the amount of radiation (number of radiation
quanta) transmitted and absorbed by the detection material - it
is therefore proportional to the radiation dose
at the detector site. They are therefore mainly used for dosimetric
purposes.
Thermoluminescence
and photoluminescence (OSL) dosimeters
Material radiation detection here is based on the phenomenon of metastable
excitation of some dielectric materials: electrons
released by ionizing radiation pass from the valence band to the
conduction band, from where they are trapped in the places of
dislocation of the crystal lattice of the material at
energetically excited levels ("capture traps") *) and
they remain there for a long time - the levels are metastable.
Electrons cannot get out of these levels spontaneously, but are
only released by supplying a certain amount of energy (heating or
light irradiation). In this way, part of the energy absorbed
during irradiation collects in the material . By
heating - thermoluminescence (thermally
stimulated luminescence) or by irradiation with visible light - OSL
(Optically Stimulated Luminescence) deexcitation
occur and electrons return to lower energy levels (and to the
electron shells of the atoms of the material). The released
excitation energy of electrons is emitted in the form of visible
light photons - luminescence
(fluorescence) of the material occurs, mostly in blue-green
light. The higher the radiation dose of the material, the more
electrons accumulated in metastable levels and the more photons
emitted when evaluated by thermoluminescence or OSL-luminescence:
this light yield is therefore proportional to the
radiation dose in the irradiated material.
*) The mechanism is to some
extent similar to the origin of scintillation in scintillators -
§2.4 "Scintillation detectors", part "Scintillators and their properties", Fig.2.4.5 left. The main difference is in the
lifetime of excited electron levels: while for scintillators
almost immediate deexcitation with the shortest possible
afterglow time is desired, for thermoluminescent and OSL
materials, on the other hand, the maximum (meta)stability is
required, with as little fading as possible. Similar to
scintillation materials, although there may be a capture centers
made by first base material, a large number of these centers can
additionally create introducing ions of the
activator in the crystal lattice - these ions cause
additional discrete levels in the forbidden band. A common
activator, or dopant impurities for TLD and OSL
materials are manganese, dysprosium, carbon.
¨ Thermoluminescent dosimetry TLD
As thermoluminescent substances are most often used lithium
fluoride LiF (: Mg, Ti, Cu) *), calcium fluoride
CaF2 (:
Dy, Mn), calcium sulphate CaSO4 (: Mn, Dy), alumio-phosphate glass Al(PO3 )3 -Mg (PO 3 ) 3 , Li 2 B 4 O 7 (: Mn) (low
sensitivity, suitable for high doses). A sample of a precisely
defined amount of a given TLD substance is encapsulated in a
thermoluminescent dosimeter, which is exposed to radiation at the
place where the radiation dose is to be determined (TLD material is made differently, on the finger
dosimeter in Fig.2.2.1b on the left it is in the shape of a foil
- a "chip" about 1 mm thick). At the end of the
exposure, the thermoluminescent substance is removed from the
housing and heated in the evaluation device to a
temperature of about 160-300 °C (depending on the type of
material) and the emitted visible light is sensed using a photomultiplier.
The electrical signal from the photomultiplier is recorded
depending on the temperature - a so-called heating curve
is created, the integral of which (area under the curve) is proportional
to the dose in the dosimeter.
*) For neutron dosimetry, lithium enriched with
the 6Li isotope is used instead of natural lithium
(with a predominance of 7Li).
Fig.2.2.3. Left: Thermoluminescent TLD
dosimeter. Middle: Photoluminescent OSL
dosimeter. Right: Principle of
operation of TLD and OSL dosimeters.
¨ Photoluminescent
OSL dosimetry
also called PLD (Photo Luminescence Dosimetry).
Optically stimulated luminescence is shown, for example, in the
richly distributed silica oxide (quartz), but in
dosimetric practice, mainly aluminum oxide Al2 O3 (:C), activated by
carbon, is used. A defined sample of this substance is exposed to
radiation in the dosimeter at the place of radiation monitoring.
Irradiation with LED light (longer wavelength - yellow-green
light) is used for evaluation, while the resulting luminescence
(shorter wavelength - blue light) is detected by a
photomultiplier. The total luminescence thus generated is again proportional
to the irradiation of dosimeter. Compared to TLDs, the
evaluation is simpler and more reproducible (LED irradiation is
easier to standardize than controlled thermal heating).
Thermoluminescence and OSL dosimetry is
schematically shown in the right part of Fig.2.2.3. These
dosimeters can be designed as finger dosimeters
for monitoring during laboratory work, or whole-body
dosimeters monitoring a sample of total irradiation at a
reference site. As with film dosimeters, several separate
detection elements, sometimes covered by different filters,
are sometimes used - for the analysis of the type and energy of
ionizing radiation. Compared to film dosimeters, there is the
advantage of higher radiation sensitivity and accuracy, a larger
range of measured doses, low sensitivity to external influences
(temperature, humidity, chemical fumes), the possibility of
continuous operational evaluation and reuse of material
(exposure and evaluation is not destructive).
Luminescent
archaeological dating
Materials capable of long-term metastable (almost stable!)
excitation of electrons in crystal lattices are commonly found in
nature. The excitation of these materials occurs slowly and
continuously due to natural radioactive radiation (whose
intensity is constant for a long time, but may vary for different
localities). This phenomenon can be used for archaeological
dating. The older the studied material of this kind -
the longer the time has passed since its last heating or light
irradiation - the more it was "excited" by the excited
electrons. It's a kind of "time counter".
Thermoluminescence can be used to
determine the age of fired ceramic objects or bricks
containing quartz- the most common mineral exhibiting
thermoluminescence. All electrons previously trapped in the
metastable levels of the trapping centers of the respective
material were released by high temperature heat treatment during
production. These empty levels are then gradually occupied by
electrons released by natural ionizing radiation (thorium and
uranium decay series, potassium-40, cosmic radiation). We heat
the investigated ceramics (to a temperature of approx. 300 °C)
and measure the luminescence it emits. The intensity of this
thermally stimulated luminescence depends on the time
that has elapsed since its original firing (during manufacture)
and the current - new - firing during analysis.
Similarly, small grains of quartz and
feldspar, which are commonly found in all layers of
archaeological excavations, show optically stimulated
luminescence (OSL): metastable electron levels in
crystal lattices are gradually and long-term occupied by
electrons released by ionizing radiation from natural
radioactivity, especially potassium 40K. The longer the quartz grain is exposed to this
natural ionizing radiation, the more electrons accumulate in
these metastable "traps". When irradiated with visible
light, the captured electrons then deexcite, measuring the
luminescence that is proportional to the time that has elapsed
since their last illumination (when they were covered in the
landfill from daylight; samples must be taken and processed
without access to light! - otherwise premature deexcitation of
metastable levels would occur and the accumulated
"record" would be "reset").
These luminescence methods allow archaeological
dating in the time range of about 100 - 100,000 years.
Other material detectors
This includes, for example, trace detectors,
based on the fact that after the impact of densely ionizing
particles, especially alpha, there are minor local defects in the
crystal lattice of certain materials (eg mica, special glasses,
organic polymers). These microscopic defects can be increased to
macroscopic dimensions by etching (the damaged
material is more chemically sensitive, so it dissolves). The traces
etched in this way are then observed under a microscope and their
density is determined - either manually or automatically using
electro-optical methods. They are mainly used to measure the
long-term average concentration of radon in the field
(in building interiors) using the density of traces created a-particles from the
radioactivity of radon and its daughter products.
The so-called long base silicon
diodes (LBSD - Long Base Silicon Diode ), designed
for measuring the radiation dose (kerma) from heavy particles,
especially fast neutrons, can also be included in
this category . When a fast particle collides with a
silicon atom, this atom is ejected from its position in the
lattice. As a result of this irradiation and ionization, the
crystal lattice of silicon is damaged, which changes the lifetime
of the minor charge carriers and thus the conductivity
of the diode. The voltage drop across the diode is measured in
the forward direction before and after irradiation, the change in
voltage drop after irradiation relative to the initial value
being an approximately linear function of the radiation dose
(kerma).
Material detectors, due to their
relatively small use in nuclear and radiation physics and
technology, we will not deal in the next text of this chapter.
For interest, we will mention here only 3-dimensional gel
detectors (rare used in radiotherapy) :
3-dimensional gel detectors
The most complex, but physically interesting variant of material
detectors are the so-called 3-dimensional gel dosimeters,
which allow to record and store the spatial distribution of the
radiation dose in the form of a certain dose picture.
They are integral (cumulative) chemical detectors in which
information is fixed in a gel environment. The
measured volume (eg phantom), in which we want to determine the
spatial distribution of radiation intensity or dose, is
filled with a gel consisting mostly of a gelatin
carrier (matrix), in which the radiation-sensitive
substance is dispersed. Upon irradiation of this
volume, free radicals are generated by the interaction of
radiation in the gel, mainly due to radiolysis
of water, which by chemical reactions induce permanent
physicochemical changes of the sensitive substance at
the irradiation site, the intensity of which is proportional to
the local absorbed radiation dose. In particular, two types of
sensitive substances dispersed in the gel are used, differing in
the mechanism of the radiation effect :
w Radiochromic
gel dosimeters ,
where the sensitive substance changes its color
by irradiation. The most frequently used iron sulfate
[ferro ammonium sulfate (NH4)2SO4.FeSO4.6H2O
in the so-called Fick's solution with sulfuric acid H2SO4
], where free radicals and hydrogen peroxide, formed by
irradiation of an aqueous solution in a gel, cause oxidation
of Fe+2 ions to Fe+3.
This leads to increased light absorption, especially at a
wavelength of around 300 nm. A certain disadvantage of this
substance is the diffusion of radiation products - iron ions -
from the place of their origin to the surroundings in the gel,
which soon blurs the information about the spatial distribution
of the dose. To reduce the diffusion effect, the chemical
composition was improved by the addition of xylenol, forming a
color complex (xylenol-orange ) with Fe+3
ions. In this so-called FXG dosimeter, in addition to reducing
the diffusion effect, an increase in the optical response is
achieved by absorbing the wavelength of 585 nm.
Note: Plastic 3-D dosimeter: Instead of
a gel, the radiochromic substance is sometimes fixed in a
low-melting plastic; with optical evaluation.
w Polymer
gel detectors
consist of a monomeric substance dispersed in a gelatin carrier.
Free radicals formed in the gel upon irradiation induce local
polymerization of the monomer at the site of
irradiation, in proportion to the absorbed dose. The gel carrier
causes the radiation-formed polymer (with large molecules) to
remain permanently localized at the site of interaction. This
polymerization leads to changes in optical properties - the
originally transparent gel acquires turbidity at
the site of irradiation, the opacity of which is
proportional to the absorbed dose. The density
also increases slightly. The most commonly used sensitive
substance here is methacrylic acid, resp. a
mixture of acrylamide and N,
N-methylenebisacrylamide. Compared to ferro-sulphate gels,
polyacrylamide gels have the advantage that the polymerization
chains remain permanently fixed at the site of their formation,
so that the record of the spatial distribution of the dose is stable
for weeks and months. Therefore, polymer gel dosimeters appear to
be more promising.
A certain disadvantage of polymeric gel dosimeters
is their sensitivity to atmospheric oxygen, which can inhibit
polymerization. Their material must therefore be prepared in a
nitrogen atmosphere and filled into hermetically sealed
containers. Sometimes oxygen absorbers are added to the gel.
The resulting
irradiation effect of both types of 3D gel dosimeters is local
material changes proportional to the local absorbed
dose. These changes manifest themselves in three ways, which
allows the evaluation of the spatial distribution of the dose in
the irradiated gel dosimeter by three methods :
× Transmission
optical CT
The non -irradiated gel
is optically almost transparent. The sites with
the higher absorbed dose where the radiochemical reaction
occurred show variety of optical properties - discoloration, turbidity - have increased light
absorption, higher opacity. By irradiating the
detector gel with light rays at different angles 0-360°, with
the measurement of the transmitted intensity, resp. attenuation
of the beam, using photodiodes (or CCD detectors) and subsequent reconstruction
based on the Radon transformation by the method of filtered back
projection, we obtain transversal images of opacity and thus the
local distribution of the dose in cross sections. The set of
these cross-sections will create a three-dimensional
image of opacity and thus the spatial distribution of
the radiation dose in the sensitive volume of the gel detector.
This optical CT scan and reconstruction is analogous to X-ray CT,
described in §3.2 "X-ray diagnostics", part "Transmission
X-ray tmography (CT)".
The gel dosimeter is mounted in a special holder, rotating by
means of a stepping electric motor. The irradiation is realized
either by a thin laser beam - an accurate but lengthy method, or
by a wide beam of light - a fast but less accurate method (usually sufficient in practice).
For better optical contact, irradiation is suitable with a
dosimeter immersed in an aqueous enviroment.
× Nuclear
magnetic resonance NMRI
At the sites of radiochemical reaction, chemical properties
change, which leads to subtle changes in magnetic
behavior. There are changes in the interaction of
nuclear moments, manifested by changes in relaxation times T1 and T2 of magnetic
moments of hydrogen nuclei when imaging a gel detector by nuclear
magnetic resonance (see §3.4, section "Nuclear
magnetic resonance"). With appropriate
modulation (sequence and "weighing"), the intensity in
the NMRI image will be proportional to the local radiation dose
in the gel.
× X-ray
CT
The radiochemical reaction may lead to slight changes
in the density of the material. In places where
radiation-induced polymerization has taken place, the volume of
the sensitive substance decreases and thus the detector material density
increases. This leads to an increase in the linear
attenuation factor for X-rays, which can be shown by CT
transmission tomography. With use an X-ray CT of gel detector,
using the soft tissue CT settings, we obtain an image whose
density expressed in Housfield CT units will be modulated by the
spatial distribution of the radiation dose in the gel dosimeter
material.
3D gel detectors are
rare used in dosimetric measurements in radiotherapy,
especially in measuring intricately shaped spatial distributions
of radiation doses in advanced radiotherapeutic techniques IMRT,
stereotactic radiotherapy, high-density brachytherapy or hadron
radiotherapy - see §3.6 "Radiotherapy".
With dosimetric gel may be filled vessel modeling anatomic
various organs and body parts for the purpose phantom
dosimetric measurements. A significant advantage of gel
dosimeters is their energy independence, tissue
equivalence (density of the gel is approximately equal
to the density of soft tissues), and almost linear
response of the size the radiation dose even in high
doses. The disadvantage is, as with all material
detectors, low sensitivity, they work only from
relatively high doses of about 4 Gy.
3D gel dosimetry is
relatively complex and demanding method both in
the stage of laboratory preparation (including
high demands on the homogeneous distribution of the sensitive
substance in the gel), as well as the evaluation of the
response in the dosimeter material. It is therefore used only
sporadically.
For comparison and
interest, see §3.6, passage "Make the 'invisible
visible' - display of
radiation beams", where
pictures of the optical response of electron, photon and proton
radiation using Cherenkov radiation in water and scintillation
radiation in a liquid scintillator are shown.
Particle
trace detectors
In addition to "one-time" detection of radiation quanta
and spectrometry of their energy, important information about the
physical properties of particles can carry their behavior and
motion in substances and magnetic and electric fields. To study
the properties of particles, it is therefore useful to capture -
"make visible" - analyze the path of their
movement in matter, with the possible participation of a
magnetic field.
Nuclear
photoemulsions for particle trace detection
The oldest and easiest way is to record photographically
the trajectory - the trace that the particle
left in its movement in matter. To detect traces of particles, a photographic
emulsion with a relatively large thickness
(approx. 0.1-1 mm) and a high content of silver halide in gelatin
is applied to the film or glass plate. When a fast charged
particle enters this emulsion, it leaves an ionization
trace along its path of movement, in which a
photochemical reaction releases silver in the grains of silver
halogens dispersed in the gelatin of the emulsion. The particle
thus leaves traces of released silver on its path in the emulsion
from grain to grain, ie a latent image of its path
is formed; upon development, a visible trace of
a more or less dense sequence of black particles is formed, the
density of the silver grains along the path depending on the
species and energy of the particle.
Viewing and measuring these traces in exposed and
developed nuclear photoemulsions is performed using special
microscopes equipped with micrometric shifts. The range
of the particle (if its path ends in the emulsion) and
the density of the silver grains are measured
along its path. From these measurements, the energy and mass of
the particle that has flowed through the emulsion can be
determined. The greater the particle's energy, the greater the
range of the particle. The density of silver grains, i.e. the
relative number of grains per unit length of the path, is
proportional to the relative loss of energy of the particle in a
given section of the path. According to the so-called Bragg
curve (see §1.6, Fig.1.6.1), each charged particle
causes more and more ionization towards the end of its path with
a maximum just before the end of the path (stopping), so that the
end parts of the particle track appear the highest blackening
density (the largest number of silver grains).
If during the exposure a nuclear emulsion is placed in a
strong magnetic field of a given intensity and
direction, the paths of the charged particles are curved by the
action of the Lorentz force; from the curvature of
particle paths it is then possible to determine the
ratio of charge and momentum of the particle (images are similar to Fig.2.2.4, but negative - the
trace is black on a white background). If a
fast particle interacts with another particle within the
emulsion, important quantitative data on the
dynamics of this interaction can be determined from the angles of
travel, curvature, blackening, and trajectory of the individual
secondary particles formed.
Another option is to stack several
photographic emulsions (films or plates) on top of each
other. The passage of a particle through this system causes a
small island of blackening at the corresponding point (the
intersection of the particle's path with the emulsion) on each of
the plates. By evaluating these traces from the individual
emulsions, the spatial trajectory of the particle
can be reconstructed.
Note:
Now, even electronic position-sensitive detectors (trackers)
are spatially assembled into blocks or other structures.
Nuclear emulsions were also used to study nuclear
reactions, while the emulsions were filled with compounds of
some elements - lithium, boron, uranium, etc., with the nuclei of
which the reactions were examinated.
Nuclear photoemulsions played an important role in the
study of nuclear processes and elementary particles in the first
generations of accelerators and in cosmic rays; a number of
elementary particles were discovered using these emulsions. The
disadvantages of nuclear emulsions are their small dimensions
(especially thickness) and low operability of use - particle
paths are only visible later, after development, and their
evaluation is slow and laborious *). Therefore, they were
gradually pushed out primarily bubble chambers,
which provide significantly faster and more complete information
about the motion and interactions of elementary particles. And
now the bubble chambers are being pushed out by electronic
detection systems, see below.
*) ECC photoemulsion
chambers
However, nuclear photoemulsions are still used in some particle
experiments, where a very high spatial resolution of
registered particle paths, on the order of micrometers,
is required. Often a "sandwich" arrangement of
photoemulsions is used in a series of layers of films
applied close to each other, with possibly interleaving with
layers of target material (eg lead). This arrangement is
referred to as the Emulsion Cloud Chamber (ECC)
- a kind of "photoemulsion cloud chamber"
which, after evaluation, provides similar images of particulate
traces as a conventional cloud chamber (described below). The
evaluation of photoemulsions in modern detection systems is fully
automated, performed by microscopic scanning, electronic
digitization and computer evaluation. The largest detection
system based on nuclear photoemulsions is currently OPERA
in the Gran Sasso underground laboratory for the
detection of neutrinos and the study of their oscillations (see
§1.2, section "Neutrinos -
"ghosts" between
particles", passage "CNGS +
OPERA").
Cloud and bubble
chambers for the detection of trace particle
Wilson cloud chamber
First type of detector, providing continuous visible
traces of flight of charged particles, is the Wilson cloud
chamber. It consists of a closed glass cylinder filled
with a gas (perhaps air) with saturated vapors
of suitable liquids - water vapors are used with an admixture of
vapors of organic substances, most often alcohol. Sometimes the
chamber space is also filled with rare gases, such as argon. The
cylinder is provided on one side with a piston or diaphragm, the
displacement of which allows a rapid change in volume and
pressure inside the cylinder. If we perform a rapid
expansion of the working space of the chamber (to about
1.2-1.4 times the original volume), it will occur due to adiabatic
expansion of the gas in the cylinder to drop the
temperature and the saturated vapors present with the
resulting cooling below the dew point become supersaturated.
Supersaturated vapors tend to precipitate in the form of droplets
(mist) on the walls of the vessel, as well as on dust particles
and ions which are contained in the gas and form condensation
nuclei for formation of droplets. If condensation nuclei
are not present (dust-free environment in the cylinder),
supersaturated vapors will last for a short time without
condensation.
If a charged particle passes through such a working
space either just before expansion or during expansion, it will
form a number of ions along its path, which attract and thus
locally concentrate vapor molecules. Supersaturated vapors
precipitate on these ions as condensation nuclei - the path of
the particle is covered by a series of small droplets. With
suitable side lighting, the ionization paths are clearly visible
as light traces on a dark background and can be
observed or photographed in this way.
The supersaturated mist chamber remains sensitive to
particle path registration for only tenths of a second. After
photographically capturing the traces of particles, the chamber
must be set to the initial state - reseted: the gas in the
working cylinder is back-compressed, the droplets evaporate or
flow down along the walls of the cylinder, the steam becomes
saturated again. Then a new work cycle of
expansion - exposure - compression can occur, which may be
repeated periodically.
The length of the nebula track and its
"fulness" (density) is characteristic for different
types of ionizing particles and their energy. In order to be able
to derive quantitative parameters of particle motion from the
observed trajectory, stereoscopic images of the
trajectory are taken by two cameras oriented at appropriate
angles. Then, the reconstruction of the captured paths, their
accurate measurement and evaluation of the quantities
characterizing the motion and interaction of the detected
particles are performed. To determine the electric charge of the
particles, the fog chamber is placed in a strong magnetic field
and the curvature of the particle paths is evaluated.
Diffuse could chambers
The disadvantage of the classical Wilson could chamber is the
short sensitive registration time of the particles during the
working cycle. Therefore, types of fog chambers operating not
cyclically but continuously - diffuse cloud chambers
have been developed. A vertical temperature gradient
is achieved in the working cylinder of this chamber by heating
the upper plate of the chamber with a heating element, while the
bottom of the chamber is cooled, for example, with solid carbon
dioxide (the opposite temperature gradient
can also be used). The alcohol vapors
generated in the hot part of the chamber diffuse
into the cold part of the chamber. In a certain part of the
chamber space, a zone is formed in which a state
of supersaturated steam occurs, needed to
condense vapors on ions along particle paths. The vapors are
constantly replenished by drops of supplied alcohol (it evaporates in the upper part, the condensed alcohol
is discharged from below), they diffuse
against the direction of the temperature gradient, so that the
diffusion cloud chamber can operate continuously
in a steady state.
Note: The air in the chamber itself
contains many ions and charged dust particles, which would be
disruptive (reduce the contrast or even prevent the visibility of
traces); other ions and charged particles are formed during the
actual measurement. Therefore, a direct voltage
(of the order of one hundred to a thousand volts) is inserted
between the lids of the chamber - the generated electric field cleans
the working space of the chamber from disturbing charged
particles.
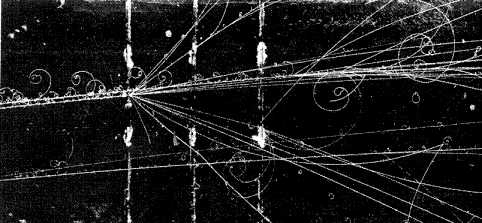
Fig.2.2.4. Example of photographic image from a bubble chamber.
The primary particle (proton) from the accelerator, arriving from
the left, leaves an ionization trace and then collides to produce
other particles, of which the electrically charged ones again
leave ionization traces. The chamber is inserted into a magnetic
field, so that according to the sign of the charge, the particle
paths are curved to the left (here negative particles) or to the
right (positive particles).
The bubble
chamber for detecting trace particles
is based on a similar principle as the nebula chamber, but for
the visualisation of ionization trace of particles uses the
opposite states than the fog chamber: the formation of gas
(or vapor) bubbles in superheated liquid
along the ionization trace of the particle. Compared to cloud
chambers, in which the gas is too sparse, the bubble chambers
have the advantage of a higher liquid
density with which high-energy particles can interact
more effectively. Furthermore, it is a faster work cycle speed.
If we heat a clean liquid to a temperature
slightly higher than the boiling point, it may not start to boil
immediately, but it may remain in a superheated liquid
state for some time (a few seconds); then it starts boiling
violently. If, during the unstable state of the superheated
liquid, before the onset of boiling, a charged particle passes
through the liquid, it forms a number of ions along its path. Microscopic
bubbles of steam begin to form on these ions, which, if
the liquid overheats sufficiently, can grow to macroscopic
dimensions - a sequence of visible small bubbles
is formed along the path. These bubble traces are photographed,
reconstructed and evaluated in a similar way as in fog chambers
under suitable side lighting (discharge flash) (the formation of bubbles along the tracks can also be
monitored in time - the growth of bubbles can be stroboscopically
filmed).
The first types of bubble chambers were
filled with ether heated to a temperature of about 140 °C and by
regulating the pressure (approx. 20 atm) a suitable state of
superheating was achieved. Today's bubble troughs are filled with
liquid hydrogen, or deuterium (for monitoring
interactions with neutrons), propane, freon, liquid xenon, etc.,
according to the specific type of studied particles and their
interactions. They often reach considerable dimensions of several
meters and contain hundreds and thousands of liters of liquid
gas. The superheat state of the liquid gas is very precisely
regulated by pressure changes by mechanical
movement of the piston (electronically controlled). As the
pressure increases, the bubbles disappear, the boiling stops and
the chamber is brought to its initial quiescent state. By
reducing the pressure, a superheated liquid is created again,
particle paths, etc. are registered periodically. The cyclic
phases of the bubble chamber operation are synchronized with the
accelerator duty cycle so that the particles enter the chamber at
a time when the pressure is momentarily reduced and the liquid is
in a superheated state.
Bubble chambers are almost always placed
in a strong magnetic field, so that by measuring
the curvature of the paths due to the Lorentz
force, it is possible to analyze the charge and some other
dynamic parameters of the registered particles - Fig.2.2.4. From
the direction of curvature, we determine whether the particles
have a positive or negative charge, the
magnitude of the curvature (Larmor 's radius) makes it possible
to determine its momentum; if the path of the
particle ends inside the chamber, the energy of
the particle can be determined from the range.
For high-energy particles that
fly through the chamber and continue to move, the velocity
of the particle can be determined using two or more
detectors (preferably fast-response scintillators) located at
defined distances in the path of the particles. The particle
velocity can be determined from the time differences (delayed
coincidences) of the pulses from the individual detectors. From
the relationship between velocity and momentum (relativistic) it
is then possible to determine the mass of the particle,
which together with other parameters allows the particle to be
identified.
Photographic emulsion, could and bubble
chambers are now being pushed out in research practice by electronic
particle trajectory detectors, so-called trackers
(show the track of trajectory,
path). The conceptual diagram of such a
detector is above in the section "Arrangement and configuration of radiation detectors" in Fig.1.1.2 below. They are significantly more
flexible, their advantage is high scanning speed and direct
electronic information processing.
2.3.
Ionization detectors
Ionization chambers with gas filling
The ionization chamber is the simplest electronic detector of
ionizing radiation; it directly uses the basic property of this
radiation contained in the name - ionizing effects on the
substance. The basic scheme of a simple ionization
chamber is on the left in Fig.2.3.1. :

Fig.2.3.1. Left: Schematic
drawing of the ionization chamber principle for detecting the
flow of ionizing radiation. Right:
Ionization chamber in a well design as a meter of activity of
radioactive preparations.
The ionization chamber consists of two metal
plates (or wires) - electrodes - anode and
cathode, located in a gaseous environment *) and connected in an
electrical circuit to a voltage of the order of hundreds of
volts. Usually a cylindrical arrangement is used (resembling differently shaped coaxial
"cylindrical capacitors"; but the electronic function
of the capacitor is not used here...),
where the outer metal shell is one electrode and the inner wire
or cylinder is the other electrode.
*) The gas filling of the ionization
chamber can in principle also be ordinary air, but special gas
fillings formed by inert chemically stable gases
show better properties, whose molecules are not subject to
chemical changes during radiation ionization and the passage of
an electric current. The most commonly used argon, krypton,
xenon.
Under normal circumstances (without the
presence of radiation) no current passes through the system - the
gas between the electrodes is non-conductive, the electric
circuit is not closed. However, when ionizing radiation enters
the space between the electrodes, it ejects electrons from the
originally neutral gas atoms and converts them into positive
ions. Negative electrons travel in the electric field immediately
to the positive anode, positive ions are set in motion to the
negative cathode - a weak electric current begins to flow through
the circuit caused by the ionic conductivity of the ionized gas
between the electrodes. The current measured by the microammeter
is directly proportional to the intensity of the ionizing
radiation; can be calibrated in units of radiation intensity or
dose rate (Gy/s). Thus, the detection of the
flow of invisible ionizing radiation is realized by converting it
into a measurable amount of electric current
trough the circuit of the ionization chamber. The electrical
signal from the ionization chamber is measured in the evaluation
circuit either as an ionization current -
ionization chambers with continuous ionization (these are discussed in this section), or a short current or voltage pulse -
pulse ionization chambers (described
below in the section "Geiger-Müller
detectors" and in the passage
"Proportional detectors").
The electric current flowing through the
ionization chamber is generally very weak (approx. 10-16
÷ 10-9 A) - the ionization chamber has a low
sensitivity (low detection
efficiency), so it is not suitable for
detecting low flux radiation. However, its advantage is the
linear dependence of the current even in the area of high
intensities of ionizing radiation. The ionization chambers
therefore have a very good linearity of response
to the intensity of the detected ionizing radiation in a very
wide range. It is therefore used, for example, to measure the
distribution of intensity (dose rate) in radiation beams in
radiotherapy. The most common use of the ionization chamber is in
dosimetry for measuring the dose of ionizing
radiation.
Activity meters with a well
ionisation chamber
Ionisation chambers in a well design are often used in activity
meters for radioactive preparations (these meters are sometimes incorrectly called
"dose calibrators") - Fig.2.3.1
on the right. It is a hollow cylindrical chamber filled with an
inert gas (mostly argon), in the center of which is formed an inter-cylindrical
depression - a "well" for the
insertion of the measured radioactive sample. Inside the chamber
are electrodes to which a direct voltage (several
hundred volts) is applied. Until
radioactivity is present, the gas is not ionized and virtually no
electric current passes - except for a slight current caused by
the ubiquitous radiation background. There should be lead shielding
around the chamber to reduce unwanted background.
The vial or syringe with the measured
radioactive substance is inserted into the opening of the well
ionization chamber, which then registers the outgoing gamma
radiation in a geometry close to 4p. The activity of the
measured radionuclide determines the intensity of gamma radiation
in the chamber space, and thus the density of gas ionization and
the value of the electric current between the electrodes. The
electrical signal I from this chamber is then proportional
to the activity of preparation A and G- constant of the given
radionuclide: I ~ A. G. The gamma-constant is different for each radionuclide,
it depends mainly on the number of photons emitted per
radioactive conversion and on the energy of these photons. The
electronic circuits of the activity meter are calibrated
(via the G- constant) so that for the selected radionuclide the display shows
its activity directly in [MBq] *).
*) In order for this measured activity
value to be correct and accurate, a careful metrological
calibration is required for the activity meters. The result
of this calibration is the values of the "isotope
factors" for the dividual radionuclides, which
are multiplied by the measured ionisation current for obtaining
the activity [MBq]. These multiplication factors are stored in
the memory of the device and then are used by entering the type
of radionuclide to be measured.
Activity meteres
with a well ionization chamber have very good linearity
to high activity hundreds of TBq (at our workplace we measured the linearity of several
types of activity meters up to about 40GBq, we did not have
higher activity). Common activity meters
(such as Curiementor or Bqmetr) with measuring
times around 5-10 sec. are able to reliably measure activities
only greater than about 100kBq. Only those activity meters that
have the option of extending the measurement time for low
activities (such as Mediac by
Nuclear Chicago ) are able to measure
activities of the order of kBq units - but the measurement can
take several minutes. To measure samples of even lower
activities, the well scintillation detectors must be used (see below §2.7 "Measurement
of sample radioactivity").
The detection efficiency of the well
ionization chamber, and thus the accuracy of measuring the
activity of the preparations, significantly depends on the
position of the sample in the well, the sample volume and the
absorption of gamma radiation inside the sample, in the vial
walls and the inner wall of the ionization chamber. Problems of
positional and volume dependence of measurement
in the well detector is discussed in §2.7, passage "Detection efficiency",
Fig.2.7.2. For these circumstances, it is necessary to apply the
appropriate correction - multiplication of the measured value by
an experimentally determined correction factor.
Well ionization chambers are basically used to measure
the activity of radioisotopes emitting g radiation - either pure
gamma emitters (such as 99m Tc ) or
mixed b + g (such as 131 I ) or a + g. Even pure beta
emitters with higher energies (such as 90Y) can be measured in an emergency despite the resulting
braking radiation, but with significantly worse accuracy,
significantly dependent on geometric influences. Also for
radionuclides with low gamma radiation energy (such as 125 I ), the measurement accuracy
deteriorates due to absorption. The main use of activity meters
with a well ionization chamber is for the measurement of radiopharmaceuticals
applied to patients in nuclear medicine for
scintigraphic diagnostics and radionuclide therapy (§4.8 "Radionuclides and
radiopharmaceuticals for scintigraphy").
Electroscope
The historical predecessor of the ionization chamber was the leaf
electroscope used in electrostatics. This simple device
consists of a vertical insulated metal rod to which a thin metal
sheet is conductively attached. If we apply an electric charge to
this system, due to the repulsive electric force (the rod and the
ticket are uniformly charged) the ticket will deviate from the
rod; the angle of deflection depends on the size of the charge.
If the air were a perfect insulator, the charge of the
electroscope would not change and the angle of deflection of the
leaf would remain the same for an indefinite period of time. In
reality, however, a certain amount of ions is contained in the
air, so that the electroscope slowly discharges and its leaf
gradually returns to its original suspended position. If the air
around the electroscope is exposed to ionizing radiation, the ion
concentration will increase significantly and the electroscope
will discharge significantly faster: the rate of decrease of the
electroscope leaf thus becomes a measure of the intensity of the
ionizing radiation.
With the help of these electroscopes, many important
experiments were done in the early researches of ionizing
radiation and radioactivity. Until recently, the simple principle
of discharging the electroscope was maintained in pencil
personal dosimeters, where the ticket was replaced by a
thin fiber ("fiber electroscope"), which also served as
a hand-arrow for immediate reading of the radiation dose.
Electret detectors
This is a simple variant of gas ionization chambers, in which the
electric field is not excited by an external electronic voltage
source, but by a so-called electret *). The
charge of the electret creates an electrostatic field in the
chamber. Radiation entering the chamber (or generated by
radioactivity directly inside the gas charge - air) ionizes the
gas and the resulting negative electrons are attracted to the
electret, which is gradually discharged. The
rate of discharge of an electret is directly proportional to the
amount of radiation (radiation dose) that has entered the chamber
and been absorbed there. The discharge of the electret (ie the
difference in polarization charge before and after exposure) is
measured via the electrical voltage between the electrodes of the
respective evaluation device ("reader"), where the
electret removed from the exposure chamber is inserted. Electret
detectors work in a cumulative (integral) mode in the
sense of the classification in §2.1 .
*) Electret is
such an electrically non-conductive substance - dielectric,
which maintains a permanent electrical polarization
even after the removal of the external electric field. It is the
electrical equivalent of a permanent magnet .
These simple detectors are mainly used to
measure the average concentration of radon in terrain
(in the interiors of buildings) - in the air that forms the
"gas filling" of the chamber. After several days of
exposure, the discharge of the electret is evaluated, which is
directly proportional to the concentration of radon in the
object.
Electrical properties of
the ionization chamber
For a better understanding of the operation of individual types
of ionization detectors, we will only briefly mention the
electrical properties of the ionization chamber. The dependence
of the ionization current on the voltage between the electrodes
of the ionization chamber is schematically shown in Fig.2.3.2 -
we assume a constant intensity of flux of quants radiation.
 |
Fig.2.3.2.
The dependence of ionization current I
to the chamber on the applied voltage U
. |
This dependence, sometimes called the
"volt-ampere characteristic" of the ionization chamber,
can be divided into three areas :
- Region of Ohm's law -
ions generated by ionization are recombined together
again, whereby the recombination probability decreases
with increasing velocity of ions (electrons and ions are
separated by electrically "driven off" in the
opposite direction), i.e. with increasing voltage at the
electrodes. Therefore, the ionization current increases
approximately in proportion to the voltage, similar to
conventional electrical circuits according to Ohm's law.
This area is not used for radiation detection.
- Region of saturated stream
- the ions move so fast due to the stronger electric
field that it is not enough to recombine and they all
participate in conducting current. The ionization current
is therefore independent of the voltage (secondary ions
are not yet formed), it depends only on the intensity of
the radiation (here, however, we
have set a constant intencity in Fig.2.3.2). The ionization chambers described above
operate in this region.
- Impact ionization region
- primary ions (radiation-induced) are accelerated by a
strong electric field so as to form a further secondary
ions by striking on neutral atoms or
molecules of the gas.
In the initial part of this region (III A ), the number of
secondary ions is directly proportional
to the number of primary ions induced by radiation. Proportional
detectors work in this area .
At an even higher voltage - area III B on the curve - the
secondary ionization by impact is already so intense that
an avalanche electrons and ions occurs
(to the microdischarge) - Geiger-Muller detectors
work in this area.
Geiger-Muller
detectors
The Geiger-Müller (G.-M.)
detector is an ionization chamber, hermetically sealed, filled
with a gas with a pressure usually lower than atmospheric
(however, there are also chambers with a higher pressure); works
in pulse mode. The electrodes of this chamber
are connected in the electrical circuit to such a voltage that
the chamber works in the area III B of the characteristic in Fig.2.3.2 (voltage is about
600-1000V), in the so-called Geiger mode. Schematic
chart of G.-M. detector is in Fig.2.3.3 :

Fig.2.3.3. Left: Schematic diagram of
Geiger-Müller detector. Middle:
Some shapes and designs of G.-M. detectors ;
Right: G.-M. (or
proportional) detectors in a planar arrangement as a meter of
radioactive contamination (in the shape of an
"flatiron" ).
Upon entry of a quantum of ionizing radiation, ionization
occurs in the gas, after which the electrons begin to move toward
the anode and positive ions toward the cathode. Because the gas
is diluted, or the voltage at the electrodes is high enough, the mean
free path of each electron is long enough to gain such kinetic
energy in the electric field, that it is able to eject
additional electrons (and ions) when it strikes
a next gas atom. These secondary electrons then emit other
secondary electrons, etc. This process of secondary ionization is
avalanche (up to 1010 secondary electrons are formed from one primary
electron) - small electric discharge is
generated in the space between the electrodes. A relatively
strong current pulse passes through the circuit and a relatively
high voltage pulse is generated on the working
resistor R , which is processed via a separating capacitor
C in the appropriate electronic unit (amplifier,
counter, integrator) - the quantum of the
respective ionizing radiation is detected by
conversion to electric impulse. The resulting
electrical impulses have the same size and
shape, regardless of the type and energy of the detected quantum
- the GM detector has no spectrometric properties.
The discharge that occurs when a particle
is detected in the space between the electrodes must be
interrupted as soon as possible, because no other particles can
be registered during the discharge (prolonged
discharge could also damage the gas charge of the detector and
the electrode itself!). Two circumstances
are involved in the interruption of the discharge.
The first is the voltage drop across a
relatively high operating resistance R (of the order of MW ), which reduces
the voltage at the electrodes and reduces the production of
secondary electrons. However, in the ionized gas, ions recombine
and deexcite, emitting ultraviolet photons.
Photons of UV radiation are able to ionize and eject additional
electrons from the cathode, which tends to prolong the discharge.
Therefore, a quenching agent (usually methyl
alcohol, bromine vapors, ...) is added to the gas filling, the
molecules of which absorb ultraviolet photons and thus contribute
to the rapid interruption of the discharge.
G.M. gamma detectors are most often
designed as cylindrical tubes filled with a
suitable inert gas. The inner metal wall of the cylinder serves
as a negative electrode, a positive electrode in the form of a
wire is guided in the middle of the tube. G.-M. beta detectors
have a different design, with a thin inlet window
at one end of the tube.
Detection efficiency
G.-M. detectors
it generally depends on the walls (or inlet window) of the
detection tube and on its gas filling. They differ diametrically
for charged particle radiation and for photon radiation.
For heavier charged particles
(eg for alpha radiation) and for beta electrons, the detection
efficiency can be close to 100%, provided that
they reach the gas charge, ie the sensitive volume of the
detector. In order to penetrate there, the entrance window must
be made of the thinnest possible light material; there is talk of
"windowless" detectors.
For photon radiation X
and especially gamma, the detection efficiency of the gas charge
itself is very low, due to its low absorption in
the gas. The vast majority of g-photons pass through a sensitive volume of gas without
interaction. Photons with higher energies can be detected by a
gas-filled detector practically only if they interact
with the wall material of the detection tube. Then some electrons
released by Compton scattering or photoeffect penetrate the gas
charge, where they are already effectively detected. The
detection efficiency of G.M. detectors for photon radiation
therefore depends on the material and wall thickness of the tube (most often a few tenths of a millimeter thick aluminum
is used), of course in relation to the
radiation energy. For medium energy photon radiation, the
detection efficiency is usually about 0.1-10 %.
The use of G.-M. detectors
G.-M. detectors played an important role in the development of
nuclear and radiation physics - it was the first type of
detectors that could register individual quanta
of ionizing radiation, not just the intensity or flux of
radiation, as is the case with ordinary ionization chambers. Even
today, G.-M. detectors used for their simplicity,
but mostly only for less demanding measurements. E.g. in
radiation protection they are contamination meters,
radiation alarms, monitoring systems, etc. For
more accurate and demanding measurements, they were replaced
mainly by scintillation and semiconductor detectors, which are of
course much more expensive, but have significantly better
parameters in all respects (see
below §2.4 "Scintillation detectors", §2.5 "Semiconductor
detectors").
Dead
time of detectors
It is clear that for the duration of the avalanche discharge in
G.-M. tube, the detector is insensitive to other incident quanta.
Similarly, for other types of detectors (scintillation,
semiconductor) there is a certain period of insensitivity,
during which the device is "busy" by processing the
response from the currently registered quantum. The time from the
registration of one pulse, during which the detector is not able
to register further pulses is called detector dead time,
denoted by t or DT (Dead Time) and is measured in
microseconds *). An alternative name is the time
resolution of the detector ("counter" of
radiation quantum). In G.-M. detectors, the dead time is of the
order of 10-4 seconds, ie t @ 100 ms (which is a relatively long dead time!), for
scintillation detectors it is often shorter than 1 ms.
*) For radiometers and spectrometers, the
dead time, resp. total dead time loss - "Dead
Time" is often expressed in % of the
total measuring time.
Dead
time in general
(also applies to other types of detectors - scintillation,
semiconductor)
The
time interval from the detection of one quantum during
which the detector
is unable to detect another quantum is called
the detector dead time
. |
Dead time causes that not all interacting
quantum of radiation to be detected, but there is some loss
of detected pulses, wherein the loss due to dead time increases
with the frequency (flux, intensity) of the measured
radiation quanta. This disrupts the linearity of the
response of radiometric instruments in the higher
frequency range. Instead of the actual average input
(theoretical) frequency N [imp./s] of the incoming
radiation quanta, we measure the registered pulse frequency n
[imp./s], where n <N. Functional dependence of n = n(N)
registered pulse frequency n on actual (theoretical)
frequency N expresses response function
detector in terms of the measured number of pulses. According to
the nature of this dependence, dead time is sometimes divided
into two types: non-paralyzable and paralyzable (cumulative) :
-»
The non-paralyzable dead time is
characterized by the fact that during this dead time the detector
does not register incoming particles, wherein these particles
have no effect on its operation, and after the dead time has
elapsed, the detector is immediately ready to detect another
pulse. The dependence between the registered n and the
actual (theoretical) pulse frequency N is given by the
relation *)
n
= N / (1
+ N. t ) .
With a linear increase in radiation intensity (frequency) N
the registered frequency of pulses n first increases
practically also linearly (in practice with
the coefficient given by the detection efficiency, which we,
however, consider here as 1), then the
growth begins to slow down and at high frequencies N >> 1/t almost no longer
increases and reaches saturation: limN®¥n(N) = 1/t (Fig.2.3.4 left).
Fig.2.3.4. Influence of detector dead time on detector response
function. Left:
Non-paralyzable; Right: Paralyzable.
-»
Paralyzable dead time (also called cumulative)
is such that during it the detector not only does not register
other particles, but each such particle that flies into the
detector during the dead time, prolongs its insensitivity by the
same time - "paralyzes" the detector, dead time
"cumulates". In other words, each pulse entering the
detector generates a "new" dead time t, regardless of
whether or not it is registered. The dependence between the
measured and the actual pulse frequency is here *)
n
= N . e - N. t .
As the input frequency of the particles increases, the response
first increases linearly again, then slows down and reaches a
peak, after which, as the input frequency increases further, the
response of the detector begins to decrease (Fig. 2.3.4 on the
right). For too high frequencies N , the detector even
stops counting pulses completely: limN®¥n(N) = 0 - the
detector is "paralyzed" (overloaded).
-»
Combined paralyzable + non-paralyzable
dead time. In practice, detection systems are affected by a
combination of paralyzable and non-paralyzable dead time
components :
-× Analog circuits of the detection
apparatus - scintillation or semiconductor crystal, preamplifier,
analyzer - provide a paralyzable component tp.
-× Digital circuits of the detection
device - discriminators, analog-to-digital converter, readers,
evaluation processor, ... - provide a non-paralyzable
component tn.
If the dead time tn of the
non-paralyzable component is longer than the dead time of the
paralyzable component tp, the resulting
response is described by the combined function
n
= N/[N.e-N.tp + (tn - tp).N] .
If the non-paralyzable component is smaller than the paralyzable
one, then the non-paralyzable component is not applied and only
the paralyzable functional dependency is manifested (since the impulses from the preceding slower
paralyzable part never follow each other at an earlier time than tn).
*) Functional dependence of the registered and
actual number of impulses
The general mathematical derivation of the
influence of dead time on the functional dependence of n = n(N)
between the input (theoretical) and measured (registered) pulse
frequency is based on a statistical analysis of
the time distribution of incoming pulses according to the Poisson
distribution. If the detected quantum comes with the actual
(theoretical) average frequency N, then the probability of
occurrence of the pulse in the time interval dt is N.dt, while
the probability that the pulse falls outside the time interval t is P(t).dt=N.e-N.t.dt.
More complex manipulations with integrals t ò ¥ P(t) dt and time intervals can then be used to derive the
corresponding functional dependences n = n(N).
In the case of a non-paralyzable
detection system, this derivation can be substantially simplified
by a simple consideration from the "opposite side":
Each registered pulse is accompanied by a detector insensitivity
time equal to the dead time value t . Therefore, if we register
with the non-paralyzable detection system n pulses per
second, then for input (theoretical) pulses of frequency N
there is an effective shortening of the measuring time
from 1 second to (1-n. t) -seconds. This means that instead of theoretical N
pulses we measure n = N.(1-n.t) pulses per running second. From this, a simple
modification gives the resulting functional dependence n
= N/(1+N.t) .
For a paralyzable detection system, the dependence is
nonlinear, so a differential analysis must be used. As the
incoming frequency of quanta increases by DN, the registered frequency
changes by Dn = DN- DN. t. ........ ...... ......by further modification we get
the resulting functional dependence n= N.e-N.t.......
Dead time
sources
In general, all parts of the
detection system contribute to the dead time effect: own detector
- GM tube, scintillator, photomultiplier, semiconductor detector;
preamplifier or amplifier; amplitude analyzer; pulse counter;
analog-to-digital converter. For scintillation detectors, one of
the causes of pulse loss by "dead time" is so-called pile-up
effect (discussed below in §2.4 "Scintillation
detectors", section "Scintillation spectrum").
With a GM detector, the relatively long
dead time is given by the detection principle and cannot be
shortened too much. However, for scintillation and semiconductor
detectors, technical developments in the field of
electronics and materials have led to a significant
reduction in dead time. While in the past (60s) the dead
time of scintillation detectors was about 5-10 ms, in the 80s and
90s this value was reduced to about 1 ms due to the use of fast
electronic components. The slowest link in the detection chain
gradually becomes the scintillator itself. For
this reason, in some devices, NaI(Tl) or BGO scintillation
crystals are replaced by faster scintillators
based on rare earth doped silicon oxides, especially LSO (see
"Scintillators and their properties"
below). Gradually, the photomultiplier
becomes the limiting factor of dead time- however, it will be
replaced in some applications by special photodiodes (see below
"Photomultipliers", fig.2.4.2G ).
Measuring of dead time
There are basically three ways to
measure the dead time of a detector (if we have a shielded
detector, we can neglect the background) :
- 1. Two-source method - relatively simple but inaccurate method
To measure, we need two approximately identical
radionuclide emitters A and B with suitable
activity (such that on the tested detector they give
about 104 imp./sec. for GM-detector and about 105 imp./sec. for
scintillation or semiconductor detector). We gradually
measure the frequency of pulses nA
of source A , then the
frequency of pulses nB of source B and finally we attach both
sources A + B and measure the frequency of nA+B, all in
[imp./s]. The theoretical frequency with sources A + B
should be equal to the sum of frequencies with sources A
and B: NA+B = NA + NB , but for measured frequencies it will be
smaller due to dead time: nA+B < nA + nB . For individual measurements are relationships
between theoretical N and measured N
frequencies: nA = NA/(1+NA.t), nB = NB/(1+NB.t), nA+B = (NA+NB)/[1+(NA+NB].t). The combination of these relations leads to a
relatively complicated quadratic equation, the
approximate solution of which is the following formula
for determining the dead time by the two-source method :
t
= (nA+nB-nA+B)/(2.nA.nB) + nA+B.(nA+nB-nA+B)/(4.nA.nB) . 106 [ms] .
- 2. Method of continuous
change of the input pulse frequency - this is the most accurate method
We can perform a targeted change in the input
frequency of impulses in several ways :
¨ Gradual addition precisely
defined doses activity :
We gradually add exactly the same doses of activity to
the appropriate container attached to the detector with a
micropipette (e.g. after 1000imp./s) from zero to a
sufficiently high value (approx. 105
imp./s) and we measure the
detector response. We use small volumes to avoid changes
in absorption and geometric configuration. We obtain a
curve of the dependence of the measured frequency n
on the theoretical frequency N .
¨ Using the radionuclide decay of
a suitable short-lived radionuclide :
We attach a sample of the radionuclide to the detector
(eg 99mTc with T1/2 = 6 hours) and measure the response of the
detector at regular time intervals (eg after 10 minutes).
Dividing by the exponential function e -t. (ln 2 / T1/2 )
we again obtain curve of thedependence of the measured
frequency n on the theoretical frequency N
.
¨ Using several sources with
defined radioactivities :
We will prepare a set of several samples (approx. 10)
with precisely measured activity, in a suitable range
(approx. 1÷500 MBq), which we will gradually measure
with the same geometry in relation to the detector.
Placement such that the first sample gives around n=1000
imp./s.
¨ Measuring the source with different
distances :
The number of pulses falling on the detector basically
decreases with the square of the distance from the
source, if suitable geometric conditions are met -
sufficiently small ("point") source,
measurement without a collimator, absence of an absorbing
material environment.
¨ Use of different source shielding
:
A sufficiently intense source is gradually covered by
shielding materials of various thicknesses made of
suitable materials, thereby reducing the input rate of N
detected radiation quanta (photons). Aluminum, copper or
lead sheets are mostly used (according
to the energy of the measured gamma radiation). It is necessary to know exactly the absorption
coefficients of the used shielding materials for the
given type of radiation - it is advisable to calibrate
them by previous measurement with a weaker source
(without noticeable influence of dead time), using longer
measurement times. It should be noted here that shielding
affects not only the intensity of radiation, but also the
spectrum of radiation - it significantly increases the
representation of Compton scattered radiation relative to
the photopeak.
With the thus obtained set of measured points
[N, n(N)], we then interpolate with use the least
squares method the function of a non-paralyzable or
paralyzable model (or combined). Assuming non-paralyzable
behavior, this would be a function n = N/(1+N.t) with the
free fitted parameter t, which gives us the value of dead time; to
obtain the data in [ms] we use the multiplication by a factor of 106. In this
interpolation we can use the transformations x ® N, y ® N/n - 1,
and by the resulting points [x, y] we interpolate the line
y = t . x. For the paralyzable model we would use the
function n= N.e-N.t,
for the combined model it would be a more complex
function with two fitted parameters tn , tp.
- 3. Saturation frequency
method - a very simple but
least accurate method
By gradually increasing the activity of the radiation
source, or bringing it closer to the detector, we find
the maximum frequency nmax [imp./s]
that the detector is able to measure - further increase
in radiation intensity no longer leads to increasing the
frequency of detector response pulses. Assuming
non-paralyzable behavior, we can then determine the dead
time from the simple relation t = (1/nmax) .106 [ms].
Note :
For all these dead time measurements, there is a risk of large
systematic errors due to other physico-electronic
influences that can simulate dead time ! Before
measuring the dead time and interpreting the results, it is
recommended to examine the following two circumstances :
a) Dependence of the position of the photopeak
on the frequency of pulses - determine the position of the
photopeak for the range of input frequencies about 102 -106 imp./s.
b) Temporal stability of photopeak position at
high frequencies. Some scintillation detectors show a kind of
"fatigue effect" of the photomultiplier: at high
electron fluxes, the photomultiplier gradually decreases its gain
(mostly reversible), which is manifested by a gradual decrease in
the position of the photopeak. We recommend loading the detector
with a pulse flow of approx. 106 imp./s. and for about 60min. monitor the position of
the photopeak.
Partial leakage of the photopeak position from the
analyzer window leads to a reduction in the detected pulse
frequency, which simulates the effect of dead time.
Dead time
correction
If we measure such high frequencies of radiation quantums that
the dead time of the detector is significantly applied, it is
necessary to make a correction for this dead
time in order to obtain objective and accurate results. To
perform this correction, it is of course necessary to know the
specific value of the dead time for the given detector, ie the
measurement must be performed according to the previous
paragraph. If it is a non-paralyzable detector, we perform a
correction for the dead time, ie determining the actual frequency
N based on the measured frequency of n pulses,
according to a simple relation N = n/(1 - n.t). In general, dead time
correction can be performed by applying an inverse
relationship between theoretical and actually registered
pulse frequency; we can also use the measured dependence between
the theoretical and registered frequency, obtained by the
above-mentioned method of continuous change of pulse frequency.
In the case of a paralyzable dependence, the correction can in
principle only be performed for lower frequencies in the
ascending area of the graph, for the descending area it is
usually not possible to make the correction (the correction
becomes ambiguous).
Proportional
detectors
Proportional detectors also use secondary ionization,
but due to the lower voltage there is no avalanche
microdischarge, but they work in the IIIA region on the
volt-ampere characteristic according to Fig.2.3.2 - in the
proportional region. The gain coefficient is about 104-104,
the dead time is usually of the order of 10-6s.
The connection and design is similar to G-M detectors, they work
in pulse mode. The output voltage pulses are proportional
to the energy of the detected radiation (more precisely,
the energy absorbed by the interaction of the quantum of
radiation with the gas charge), so that these detectors can in
principle be used for spectrometry, although their resolution
does not reach the quality of scintillation and not semiconductor
detectors at all.
...............
Spark
detectors
For some applications, detectors operating in the last (highest)
area of the volt-ampere characteristic of the ionization chamber
according to Fig.2.3.2 - in the area of the spark
discharge - are also seldom used. If a voltage is
applied to the electrodes of the ionization chamber only slightly
lower than the breakdown voltage leading to spontaneous discharge
and spark jump, nothing will happen at rest. However, if a
quantum of ionizing radiation enters the space between the
electrodes, it will immediately initiate a jump of the
spark, which is manifested both by the passage of a
strong electrical impulse through the circuit and by the
appropriate light and sound of the spark discharge.
Spark detectors in an arrangement with many
electrodes distributed over a larger area form so-called spark
chambers for the registration of traces of
charged particles (ie for a similar purpose as, for
example, bubble chambers - cf. §2.2). The spark chamber consists
of a large number of electrodes in the form of plates or wires,
to which a voltage of approx. 10 kV *) is applied. The charged
particle, which passes through the spark chamber, by its
ionization gradually causes spark discharges in
the individual sections of the chamber between the electrodes,
which follow the trace of the particle in the
chamber. On the one hand, these discharges are visible
and can be captured photographically (eg stereoscopically by two
cameras); however, they are also audible and can
be registered electroacoustically, for example, via piezoelectric
sensors. After registration, an electric field is applied to
remove the generated electrons and ions, and the measurement
cycle can be repeated. The spark chambers are able to operate in very
fast cycles, while high voltage can be applied to the
electrodes for a correspondingly short time via gate circuits
triggered by synchronization detectors monitoring the primary
particle beam before entering the spark chamber (so-called triggering).
*) High voltage is applied either between
adjacent electrodes (with opposite polarity of even and odd
electrodes) or between electrodes forming eg a cathode and a base
plate forming opposite polarity, eg anode.
Drift
ionization chambers (TPC)
When an ionizing particle passes through a gas-filled chamber,
the released electrons and ions do not reach the collecting anode
and cathode immediately, but "penetrate" gradually
through the gas - they drift at a certain speed
(depending on voltage, distance from anode and gas density) to
anode or cathode. The time of electron drift to the anode carries
information about the position of the place
where the particle passed in the tube and where it caused
ionization. The drift chambers have several electrodes in the
shape of wires or strips, and according to the place - the
specific electrodes - where the electrons travel and the time of
drifting, the course of the path of the ionizing particle in
space can be determined. The most advanced detectors of this type
are multi-wire drift time-projection chambers
(TPC), composed of a large number (even several thousand) wires -electrodes,
stretched in a gas filling in several layers (in each layer the
wires are stretched in a different direction - they form a
spatial grid). Drift ionization chambers used to have a mostly
cylindrical shape, but for larger systems the flat quadrangular
shape is also used more recently (Fig.2.3.5).
As the charged particle passes, ionization
occurs along its path. Electron clouds drift at each location to
the nearest electrodes, where an electrical signal is generated.
The intersections of the electrodes from the different layers,
which thus received the signal, indicate the (x, y)-coordinates
of the passage point of the detected particle, its 2D projection.
The ionization cloud of electrons can reach several nearby
electrodes; the evaluation electronics then determine the
coordinates using the weighted averages of the signals from the
various electrodes. The place of passage of the charged particle
can thus be determined with an accuracy of about 0.1 mm. The
third spatial (z)-coordinate of the ionization site is determined
by measuring the electron drift time from the ionization
site to the wire electrodes. 2D projection of the ionization path
from the electrodes, supplemented by the time data of the
electron drift, thus enables the implementation of a 3-dimensional
reconstruction of the trajectory when the particles
interact with the sensitive volume of the chamber..
Fig.2.3.5. Basic principle of multi-wire drift time-projection
ionization chamber TPC.
The simplified diagram shows only 6 places
of ionization electron drift and the formation of coordinates (x1,y1),
... , (x6,y6).
Multi-wire drift ionization chambers are now
used in complex detection systems (such as above in Figure 2.1.3
below) in accelerators. As a rule, several layers of chambers
placed in a strong magnetic field are used. The magnetic field
changes (curves) the paths of charged particles, depending on the
charge and momentum of the particle. From the changes in the path
of the particles registered in the individual layers of the
chambers, it is then possible to determine the momentum
of the respective particle (if we know its charge). The more
accurately we can measure the momentum of secondary particles
flying out of the point of interaction, the more accurately we
can determine the rest masses and other characteristics of the
resulting investigated particles.
Drift time projection ionization chambers,
together with semiconductor trackers (see
below "Multidetector semiconductor systems" in §2.5) have become
significantly more advanced replacement of fog and bubble
chambers for particle path detection (§2.2,
"Particle
Detectors").
Drift time-projection
ionization chamber with liquid argon (LArTCP)
Instead of gas, liquid argon (at -185.8 °C,
i.e. 87.3 °K) is used as the sensitive ionization medium. The
main advantage here is the high density of
liquefied argon 1.4 g/cm3, which is about 1000 times higher than the gas charge
of standard ionization chambers. This increases the
detection efficiency for particle interactions about a
thousand times. This is especially important when measuring
processes where the effective cross-sections of
particle-mass interactions are very low - detection of
neutrinos, WIMP particles, or the search for very rare processes
such as proton decay. Argon, as an inert element with zero
electronegativity, does not absorb ionizing electrons when
drifting towards the electrodes. Argon exhibits scintillations
as it passes through charged particles, which can be registered
by photomultipliers to obtain additional information about the
process, as well as to trigger electron drift time detection.
Liquefied argon is well obtained by fractional separation from
air and is cheaper than other rare gases, so even large-volume
detectors are economically realizable.
A large cryogenic underground detector
LArTCP, which will contain 70,000 tons of liquid argon, is being
built as part of the international neutrino detection project DUNE
(§1.2, passage "DUNE
(Deep Underground Neutrino Experiment)").
2.4.
Scintillation detectors
Scintillation detectors of ionizing radiation are based
on radioluminescence - the properties of some
substances react with light flashes or scintillations
(lat. scintilla =
spark, flash ) to absorb quantums of
ionizing radiation; these flashes are then electronically
registered using photomultipliers. Substances
exhibiting this property are called scintillators.
The oldest used radioluminophore is zinc sulfide
activated with silver ZnS (Ag), from which the screens of
sciascopic X-ray devices were used, in the past platinum-barium
cyanide was also used. However, for the purpose of detecting
g radiation,
thallium - activated sodium iodide - NaI(Tl),
in the form of a single crystal, is most often used. Other
scintillators (including liquid scintillators) will be listed
below, where the mechanism of scintillation formation will also
be discussed (see section "Scintallators and their properties"). Fig.2.4.1 schematically
shows the basic principle of operation of a scintillation
detector/spectrometer :

Fig.2.4.1. Schematic diagram of a scintillation detector with a
fixed scintillator.
On the left, the formation of
scintillations in the crystal, the emission of electrons from the
photocathode and their multiplication by the dynode system are
shown.
In the middle part is the electronic
processing of the generated signals. The upper branch of the
scheme represents simple detection using a
"single-channel" amplitude analyzer and pulse counter.
The lower branch of the diagram shows spectrometric measurements
using an analog-to-digital converter and computer acquisition of
the energy spectrum ("multichannel" analyzer). The
typical shape of the scintillation spectrum of gamma radiation is
plotted on the screen - compared to the actual line spectrum
above.
Right is assembled a scintillation
detector (probe) with a crystal, light-tightly encapsulated with
a photomultiplier and at the bottom with a resistive divider.
The quantum of the measured invisible radiation
penetrates into the scintillation crystal material, where it
interacts with the substance (eg the most
frequently detected gamma radiation is a photoeffect, Compton
scattering or electron-positron pair formation, as explained in
more detail in §1.6., section "Interactions
gamma radiation and X"). Due to these interactions, the ionizing quantum is
partially or completely absorbed and part of its
energy is converted in the scintillator into a flash
(scintillation) of visible light (Fig.2.4.1 top left). The
resulting scintillation consists usually of several hundred of
these secondary photons, depending on the absorbed energy of the
primary detected quantum and the conversion efficiency of the
scintillator. The total number of scintillation photons is directly
proportional to the energy of the detected quantum
absorbed in the scintillator.
A photomultiplier is
optically attached to the scintillation crystal - a special
optoelectronic component that converts scintillation light into
an electrical signal with high sensitivity. The construction and
properties of photomultipliers are discussed below in the section
"Photomultipliers". In the classic design, the photomultiplier is a
vacuum tube, on the entrance window of which a thin metal layer
is applied from the inside - a photocathode (thickness approx. 10-7cm, the material is cesium and antimony with low
electron output work), which converts light
photons into electrons. Furthermore, the photomultiplier contains
a system of electrodes - the so-called dynodes
(their number is about 8-12), which acts as an electron
amplifier. There is, of course, a high vacuum inside the
entire tube. Positive voltage is applied to the individual
dynodes - they gradually increase and increase for each dynode.
The photons from a light flash in a
scintillator impinge on the photocathode, from which by the photoelectric
phenomenon eject out the electrons e-. Each such electron in an electric field begins to move
rapidly to the first (nearest) dynode, to which a positive
voltage of, say, about 100V is applied. It hits this dynode with
a kinetic energy of about 100eV, which causes at least 2 or more secondary
electrons to be ejected from the metal surface of the
dynode. These electrons set out on the path to the next dynode,
on which there is a higher positive voltage - about 200V. The
energy to which it accelerates (given by
the voltage difference, here again about 100eV), again ejects 2 or more secondary electrons for each electron - so we
already have at least 4 electrons, which move to the next dynode,
where twice more electrons eject, etc. Thanks to this repeated
multiplication was originally a small number of
electrons released from the photocathode multiplies
greatly and about 105 -108 electrons fall on the last dynode (already anode),
which is already a sufficient number to induce a well-measurable electrical
pulse of amplitude A on the working resistance R (has a value of the order of magaohms) in the electrical circuit. This pulse trough the
decoupling capacitor C leads to the amplifier and other
electronic circuits for processing.
Special photodiodes or
arrays of matrix photodiodes ("semiconductor
photomultipliers") can also be
used to register and convert light scintillations into electrical
pulses, event. hybrid combination of a tube photomultiplier with
a photocathode and subsequent semiconductor registration of
photoelectrons - see the section "Special
types of photomultipliers" below.
Thus, a scintillation detector works in
this way, which can be used either separately
(one detector) or can be part of multidetector systems
(cf. the section "Arrangement and configuration of radiation
detectors" above,
Fig.2.1.3). Systems of a large number of
elementary detectors and opto-electronic elements (sometimes
several thousand) are used for electronic radiation imaging
- §4.2 "Scintillation cameras" and §3.2 "X-ray diagnostics", part
"Electronic display of X-rays
", specifically it is a so-called flat-panel with
indirect conversion of X-rays.
The design of the scintillation
crystals and photomultipliers
Scintillators
can be inorganic crystals, organic plastic materials, liquid
solutions of organic substances, respectively also rare gases.
Here in the basic text we will consider inorganic
scintillators, plastic and liquid scintillators will be
described below (§2.6 "Detection and
spectrometry of radiation a and b. Liquid scintillators").
The mechanisms of scintillation formation and the properties of
scintillation materials will be discussed in the section "Scintillators and their properties". The
most commonly used inorganic scintillators are thallium-activated
sodium iodide crystals - NaI(Tl).
For general
detection and spectrometry of g-
radiation, planar scintillation crystals of
cylindrical shape with a diameter of about 2-7 cm and a height of
about 2-8 cm are used . For the detection of soft g and X radiation, thin crystals
1-5 mm thick with a thin aluminum or beryllium entrance window.
On the other hand, large-volume scintillation
crystals (approx. 20 ´ 15 cm and larger)
are suitable for the detection of high-energy radiation g. In addition to the generally used planar
cylindrical scintillators, the well or
transversely drilled scintillation crystals with a hole
for measuring samples in test tubes are also produced (see below
§2.7 "Measurement of sample radioactivity").
For the measurement of larger volumes of sample
are used large-volume well scintillation
detectors with a diameter of 18 cm and a height of about 12 cm
with a measuring well space volume of approx. 250 ml. Special
purpose scintillators (such as positron emission tomography PET,
or spectrometers-calorimeters detection systems for accelerators)
will be given at the appropriate places in the description of its
methods.
Scintillator
NaI (Tl) is placed in a light tight aluminum
housing which protects the crystals particularly against the
penetration of external light into the photomultiplier and also
from moisture from the air (NaI is hygroscopic and
may cause its hydrolysis by air humidity, see below "Inorganic scintillators",
fig.2.4.8). At the bottom of the housing is a transparent
glass exit window through which scintillation
photons penetrate the photomultiplier. Photons
from scintillation flashes are emitted isotropically in all
directions, often outside the output window and photocathode of
the photomultiplier. The inner sides of the scintillator housing
are therefore provided with a white reflective layer
which reflects light photons on the photocathode of the
photomultiplier.
By simply placement a scintillation
crystal above the photomultiplier window, part of scintillation
photons would be lost by total reflection in the air layer
between the two glasses, the crystal and the photomultiplier. The
space between the scintillator outlet window and the photocathode
is therefore filled with light guide material,
silicone grease (with a refractive index approximately the same
as that of glass) is most often applied, ensuring good optical
contact of the photocathode with the crystal. If the photomultiplier and the scintillator are further
apart, they are connected by a light guide, in special
cases optical fibers are also used.
Photomultipliers
are special opto-electronic components for sensitive
detection of low light fluxes and their conversion into
electrical signals. Conventional photomultipliers are vacuum
glass tubes containing a photocathode inside and several dynodes,
to which a voltage of several hundred volts is applied. High
sensitivity is achieved by the fact, that even a small number of
electrons emitted by the impact of photons on the photocathode
(due to the photoelectric effect) being multiplied
by the repeated ejection and acceleration of the secondary
electrons. The signal is thus amplified, so that even the impact
of a single photon of light can cause a well-detectable
electrical impulse. Photomultipliers are used not only in
scintillation detectors, but also in spectrophotometry,
luminescence detection (of physical,
chemical or biological origin), detection
of Cherenkov radiation, electron and mass spectrometry and in
other technical applications.
Note
1: The name "photomultiplier"
is somewhat misleading, it does not multiply photons. Rather, it
is an "electron multiplier" in which
the secondary electrons released by the photoeffect from the
photocathode are multiplied.
Note 2:
First we will deal with "classic" types of
photomultipliers with photocathode and dynodes. Special
photomultipliers, including semiconductors, will be mentioned
below. Classic photomultipliers are special vacuum
tubes in which electrons are generated by photoemission
from a photocathode. Such a photomultiplier - PMT
( PhotoMultiplier),
consists of a glass flask equipped at one (front) end with an
optical input window with a photocathode, inside
it contains a series of electrodes - dynodes -
connected to the terminals on the socket at the other end of the
photomultiplier. Photomultipliers with a side input
window are rarely used.
The photocathode
consists of a very thin layer (approx. 10-7 cm thick, optically semi-transparent) vapor-deposited
on the inside of a transparent input window, working in transmission
mode (unlike the photocathode of a
photon tube, which works in emission mode; the emission,
or reflexion mode of the photocathode is only seldom used in
photomultipliers). The photocathode must be
sufficient thin so that the electrons released
by the photoeffect can easily fly out and not be absorbed in the
material. The material of the photocathode is substances with low
electron output work for the photo effect. The most common are
antimonides of alkaline elements, eg cesium and antimony Sb-Cs (SbCs3 ), bialkaline materials Cs-K-Sb, Cs-Rb-Cs, Na-K-Sb,
then Ag-O-Cs, or multialkaline Na -K-Sb-Cs. Photocathodes
of p- type semiconductor materials with a
suitable band structure have also been developed, the surface of
which has a negative electron affinity, so that light-excited
electrons penetrate the conductivity band very easily out into
the vacuum. For example, a gallium-arsenide
photocathode GaAs or InGaAs is used. An important parameter is
the so-called quantum efficiency of the photocathode,
which indicates the percentage ratio of the number of emitted
electrons to the number of incident photons of light. This
efficiency depends on the material of the photocathode, and also
significantly on the wavelength l of light (photon energy h.n = h.c/l) - the spectral
sensitivity *) of the photocathode. For optimal
detection, it is desirable that the luminescent spectrum of the
scintillator sufficiently overlap with the maximum spectral
sensitivity of the photocathode. If part of the spectrum extends
into the ultraviolet region (as is the case, for example, with
Cherenkov radiation, see below), it is desirable to make the
input window of the photomultiplier from quartz glass.
*) The spectral
sensitivity of the photocathode is
limited from below (for larger wavelengths l of light) by the condition that
the energy h.n = h.c/l of the photon is higher than the output energy of the electrons
from the photocathode material. From above (for shorter
wavelengths - UV radiation) it can be limited by the optical
transmittance of the input window; therefore, this window is
sometimes made of quartz glass with better UV
transmittance. For high photon energies (X and g ), the probability
of a photoeffect in the thin film layer of the photocathode is
very small - the photomultiplier is unusable for
direct detection of this radiation. Using the conversion
of hard radiation into flashes of light in scintillators,
on the other hand, detection is very effective.
Dynodes
The weak electron flux from the
photocathode is further amplified by the secondary
emission of electrons on the dynodes. A thin layer of
metal with a low electron output work (most often SbCs or BeO)
and thus a high secondary emission factor S, like
a photocathode material, is deposited on the surface of the
dynodes. The mean number of ejected secondary electrons from a
dynode is proportional to the energy of the incident electron.
The current gain DI of one multiplication
stage (one dynode) is thus DI = S. DU, where DU is the inter-dynode potential. At the usual
value of the coefficient S » 0.04-0.06 and the
voltage difference used between dynodes DU » 80-100 V, the gain of one
stage is approx. DI » 3-6. By repeating the electron multiplication process
between the dynodes, a large total gain G
(up to 108
) of the initially very weak current from the photocathode can be
achieved (for the number N of dynodes, the total gain G = DI N). The multiplication
system, consisting of approx. 8-12 dynodes, is terminated by a
collecting electrode - anode - with the highest
positive potential, from where the output signal is taken via the
working resistor R.
The electrical leads of the photocathode and dynode are
not led "sideways" (with a few exceptions), as shown in Figures 2.4.1 and 2.4.2 for clarity, but
are all led "down" (at the
opposite end to the photocathode) in many
pin socket. A high-voltage source
(with a voltage of approx. 1000-2000V) and a resistive
divider (exceptionally a diode
cascade multiplier) are used to supply
the dynodes and anodes of the photomultiplier. In the
last three dynodes, the resistors in the divider are usually
bridged by capacitors to ensure voltage stability in pulse
operation. See also "Electronic power supply for
photomultipliers ..." below for
some electronic aspects .
The photomultiplier is drawn on the left in Fig.2.4.1
only schematically and simplified. The dynodes in a given
arrangement actually have a concave curved shape
(suitable shaping of the spatial distribution of the electric
field potential), ensuring the focusing of
electrons on the next dynode. Between the photocathode and the
first dynode, a grid (diaphragm) is sometimes
placed, the positive voltage of which accelerates the emitted
electrons and directs them to the dynode. In addition to the linear
arrangement of the dynodes (Fig.2.4.2.A), a compact circular
arrangement of the dynodes (again in a focused shape)
into a cylindrical surface (Fig.2.4.2.B) is sometimes used. Lamellar
dynodes are often used in photomultipliers (in the shape of
"blinds" - unfocused), are placed in layers on top of
each other; through the gaps between the lamellae
("blinds") the ejected electrons pass to the next
dynode with oppositely oriented lamellae and a higher positive
voltage (Fig.2.4.2.C). Furthermore, dynodes in the shape of a
wire mesh, coarser or finer. Rarely is used a linear arrangement
of quarter-circle dynodes (somewhat similar to Fig.2.4.2.A),
between which there are grids - sometimes referred to as a box-grid
arrangement. The last dynode - the anode - is common to most
photomultipliers. However, there are special multianode
photomultipliers (Fig.2.4.2.D and partly also Fig.2.4.2.H),
listed below in the section "Special types of
photomultipliers".
Continuous channel
dynodes
The above "classical" electron multiplier systems in
photomultipliers consist of individual separate dynodes
with secondary electron emission, supplied with voltage from a resistive
divider. It can be said that it is an electron multiplier
with discrete dynodes.
However, there is also a completely
different design solution of the electron multiplier - a continuous
dynode (Fig.2.4.2.H). It consists of a glass tube
(channel), which is coated on the inside with a thin layer of
semiconductor material, which has a high resistivity and good
secondary electron emission properties. Between the input and
output ends of the tube is connected high voltage, about
1000-3000 V, which along the inner wall it splits
and creates a large voltage gradient. The
functions of the secondary emission and the voltage divider are
thus combined.
The photoelectrons emitted by the light
from the photocathode enter the channel, where they cause the emission
of secondary electrons when they hit the inner wall.
These electrons are accelerated by a voltage gradient
and, on further impact, more secondary electrons emerge from the
wall. This process is repeated many times along the channel - the
secondary electrons bombard the walls of the tube and produce
more and more next electrons. The channel thus behaves as a
"continuous-dynode" electron
multiplier, the gain of which G is determined by
the voltage on the tube (at a voltage of 3
kV the gain of approx. 106 -108 is
achieved, comparable to classical dynod systems). Finally, a large number of electrons fly out of the
output end of the channel, which impinges on the anode and create
the resulting current signal.
This system of continuous channel
electron muttiplier (CEM ) is sometimes called a channeltron. The
channeltron tube is often initially wider and then narrowed and
bent into the shape of a "ram's horn". Its advantage is
small dimensions, when using a suitably shaped twisted channel,
it can be just centimeters - Fig.2.4.2.H top right. Due to the
high intensity of the electric field and the smaller transit
distance of electrons, these photomultipliers have better
resistance to magnetic fields. Channeltrons are used in
optoelectronics, in electron and mass spectrometers. The complex
combination of channel multipliers - multi-channel plate
photomultipliers MCP, are listed below in the section "Special
types of photomultipliers".

Fig.2.4.2. Design of various types of
photomultipliers. In the upper part there is a photograph, in the
middle and lower part of the picture there is a diagram of the
construction and operation of the respective photomultiplier.
Special types of photomultipliers
imaging position-sensitive multianode photomultipliers PSPMT
For special purpposes of displaying the position
of light sources, especially the position of scintillation in
radiometric detectors, more complex photomultiplier systems,
called PSPMT ( Position Sensitive
photomultiplier ) - position sensitive
photomultipliers are constructed. Such a photomultiplier
consists of a photocathode with a larger area
(approx. 5 x 5cm), an
intricately configured system of dynodes (lamellar or channel
design) and a larger number of anodes arranged
on the other side of the evacuated flask (rectangular shape) into
a matrix 4 x 4, 8 x 8, or 16 x 16 independent metal elements (Fig.2.4.2.D). At the
location of the photocathode, where the detected light photon
hits, a photoelectron is released, which is attracted and
accelerated between the lamellar dynodes. Secondary electrons are
released, which ultimately fall preferentially on the one of the
anodes which lies opposite the point of emission
of the original photoelectron - i.e. opposite the point of impact
of the detected photon. By electronic evaluation of the
amplitudes of signals from individual anodes, it is possible to
determine the place of impact of the detected photon (or
photon flash) on the photocathode - the photomultiplier has imaging
properties. One such larger, position-sensitive
photomultiplier can replace several separate smaller
photomultipliers in some applications (such as special
scintillation cameras or Cherenkov imaging detectors).
Microchannel plate
photomultiplier
MCP (Multichannel
Plate Photomultiplier) differs fundamentally from other
types of photomultipliers in its shape and design. A plate (disk)
is placed under the surface photocathode, in which a large number
of glass capillaries (channels) with an inner
diameter of about 5 - 100 mm are guided across. A semiconductor layer with a
secondary emission property of a suitable considerably high
electrical resistance is applied on their inner wall. High
voltage is applied between both ends approx. 1000-3000V,
which creates a large voltage gradient along the inner wall. The
electrons emitted by the light from the photocathode enter the
channels, where they cause the emission of secondary electrons
when they hit the inner walls. These electrons are accelerated by
a voltage gradient and further secondary electrons emerge on
further impact. This process is repeated many times along the
channels - secondary electrons bombard the walls of the channels
and produce more and more next electrons. Thus, each channel
behaves as a separate electron multiplier
("continuous-dynode"). Finally, a large number of
electrons fly out of the output end of each channel, which
impinges on the anode and creates the resulting current signal -
Fig.2.4.2.H. In addition to photoelectronics, MCP detectors are
used in electron and mass spectrometers. In multianode
design can also have imaging properties, similar to the
above PSPMT - Fig.2.4.2.H top center.
Hybrid
Photon Detector HPD
An interesting type of sensitive "photomultiplier" is
the so-called hybrid photon detector HPD (Hybrid
Photon Detector). It combines the principle of a vacuum tube
and a photocathode, with semiconductor detection of
photoelectrons. It is again a vacuum tube with an optical input
window, on the inner wall of which a thin layer of photocathode
is applied. However, photoelectrons, released by the impact of
detected light, do not fall on the dynodes, but are accelerated
by a voltage of approx. +10 kV (a negative
voltage of approx. -10 kV is connected to the photocathode, the
anode is at zero ground potential).
Accelerated electrons impinge on the semiconductor
detector CCD (forming the anode), where they release
electron-hole pairs, the sensing of which generates electrical
impulses - in Fig.2.4.2.E. Each electron accelerated by a voltage
of U produces about U/3.5 electrons and holes (at a
voltage of 8 kV the "multiplication effect" is about
2500), which can be further multiplied 10-100 times by an avalanche
effect when using an avalanche semiconductor diode APD (see
below). Even the detection of one photon creates a relatively
high output pulse, the level of several mV/1 photoelectron. The
device has a high signal-to-noise ratio and is suitable for detecting
weak light signals (single-photon measurement), such as
Cherenkov radiation.
The latest type of this technology is an imaging
(position sensitive) pixel hybrid photon detector.
The optical input window has larger dimensions and is provided on
the inside with a highly homogeneous photocathode layer. The
photoelectrons released by the impact of the detected light are accelerated
by a voltage of 10-20kV applied to the ring
electrodes. There are several of these electrodes (2-5),
with a voltage gradually increasing from 0 at the anode to about
-20kV at the photocathode. In addition to acceleration, these
electrodes also serve as focusing "electron optics",
projecting the surface of the photocathode to the anode equipped
with a pixel detector (inverted reduced projection). Accelerated
and directed electrons then impinge on the (silicon) pixel
detector, formed by a matrix of a number of elementary
detectors ( pixels) - about 32 x 32 = 1024 pixels. There are generate electron-hole
pairs, the sensing of which generates electrical impulses from
individual pixels, corresponding in position to
the respective point of impact of light on the photocathode
(Fig.2.4.2.F). The device therefore functions as a sensitive imaging
light detector. Suitable especially for
position-sensitive registration and display light signals such as
Cherenkov radiation (RICH imaging detectors, see below).
SPM
semiconductor photomultipliers
In addition to vacuum tube light detectors - photon tube,
conventional photomultipliers and hybrid HPDs, pure
semiconductor light detectors have also been developed.
For higher luminous fluxes, where extremely high sensitivity is
not required, photoresistors, photodiodes or phototransistors
are commonly used, operating in (approximately) linear mode. At
very low intensities, light already consists of individual
separate photons. The detection of such light then consists in
"counting" the individual photons. For
"single-photon" detecting light (which is a standard
task of photomultipliers) have been developed semiconductor
so-called avalanche photodiodes APD (Avalanche
PhotoDiode). They are silicon semiconductor diodes connected in
the inverse direction to a suitable voltage (slightly
higher than the breakdown voltage ) so that they work in
the so-called Geiger mode . The photoelectron,
released by the impact of light on a thin surface layer "P"
(thickness <1 mm - serves as a "photocathode"), is
accelerated in a strong electric field to cause further
ionization, as well as the released secondary electrons, etc. -
is initiated an avalanche of electron-hole pairs
in the depleted layer " i " (thickness approx. 200-500 mm), impinging on the
opposite layer "N" - temporary electrical breakdown of
diode (fig.2.4.2.G below). This achieves a total electron gain of
approx. 105
-106. A
so-called quenching resistor RQ (values of tens of kW) is connected in series with the diode, on which the
resulting voltage drop causes a rapid interruption of the
discharge in the diode. During an avalanche breakdown of a diode,
a well-detectable electrical pulse is generated
in the circuit, the height of which is constant, independent of
the number of input photons that caused the avalanche detection;
this property is analogous to a conventional gas-filled
Geiger-Müller detector (see "G.-M.
detectors" above).
For spectrometry, a certain disadvantage
of photon detection by a single APD photodiode is the uniform
magnitude of the output signal (which is given by the
capacitances and resistances in the diode circuit), which does
not allow to distinguish between the detection of one or more
photons. This disadvantage has been overcome by using an entire array
of multiple small APD elements, densely spaced on one
small semiconductor wafer, including quench resistors for each
element. The individual elements [APD +
quenching resistor] are connected in parallel,
so the output signal is the sum of the signals from the
individual elements - the upper part of Fig.2.4.2.G. At low
luminous flux, there is a low probability of simultaneous impact
of multiple photons on a single cell, but the impact of multiple
photons will result in the activation of multiple independent
cells - so the output signal will be proportional to the
number of photons incident on the detection field. The
output signal is taken as standard from the working resistor R
(approx. 100 W) via the isolating capacitor C (approx. 0.1 mF).
Optoelectric components of this type are
sometimes called "silicon photomultipliers"
and are abbreviated SiPM (Silicon
Photomultiplier),
or SPM (Semiconductor
Photomultiplier),
also SSPM ( Solid-state
Photomultiplier),
or MPPC ( Multi-pixel
Photon Counter).
Due to its small size and weight, mechanical and magnetic field
resistance, ease of installation and wiring, it can be expected
to replace conventional photomultipliers in a
number of applications in the future, such as Cherenkov imaging
detectors or hybrid PET + MRI imaging combinations.
Physical properties of
photomultipliers
Basic parameter of photomultiplier is its overall
sensitivity S, which is the product of
sensitivity photocathodes SF and multiplying dynod gain G :
S = S F . G .
In general optoelectronics, the total sensitivity of a
photomultiplier is given in current units [Amperes /lumen], it is
about 10 to 100 A/lm (however, the maximum
permissible output currents of photomultipliers are only tens of
mA - see below "Adverse effects with
photomultipliers"). In
radiometry, the sensitivity of a photocathode is
expressed as [electrons / photon] - the number of electrons
emitted per incident photon, or as the quantum efficiency,
expressing this circumstance in [%]. The sensitivity of a
photocathode significantly depends on the wavelength
(energy of photons) of the incident radiation - we are talking
about the spectral sensitivity of the photocathode,
which is expressed graphically. Relative spectral sensitivity
in [%] is often used, which is normalized to the maximum spectral
sensitivity value.
Response linearity of photomultipliers
are characterized the direct proportionality between the
intensity of the incident light and the output current.
Photomultipliers are usually linear over a wide range of radiant
flux per photocathode, about 102 -1010 photons /sec. In the region of larger radiant fluxes,
the linearity begins to decrease (the output signal is lower) due
to the fatigue of the dynodes and due to the large spatial charge
of the electron cluster at the last dynodes.
The time constant of the
photomultiplier characterizes the duration (width) of the current
pulse at the output of the photomultiplier at the impact of an
instantaneous (almost infinitely short) light flash on the photocathode. The duration of the
output current pulse from the anode is influenced mainly by the
velocities (velocity distribution) of the secondary electrons and
the different lengths of the electron paths from the photocathode
between the dynodes. Due to the time scattering of the transit
time, not all secondary electrons come from the instantaneous
photoeffect to the anode at the same time, but their time
distribution forms a pulse (approximately Gaussian) with a
half-width of about 10-8 sec. The time constant of the photomultiplier, the
duration of scintillation in the crystal and the time constant of
the electronics determine the speed of the
scintillation radiometer - its dead time, or
time resolution (analyzed above) "Dead
time detectors").
The signal-to-noise ratio is manifested
mainly when measuring very low luminous fluxes on the
photocathode. Noise photomultiplier is caused by a "dark
current"- output current that flows through the
photomultipliers with unlit photocathode (see
"Adverse effects with photomultipliers"). The dark current is formed mainly by thermal emission
of electrons from the photocathode and dynod, leakage currents
between electrodes and between the terminals in the socket
photomultiplier. At room temperature, the dark current is of
about 10-15
A, by cooling the photomultiplier it
can be greatly reduced. The signal-to-noise ratio sometimes
expressed by the so-called light equivalent of dark noise (ENI - Equivalent
Noise Input ), which is the value of
the luminous flux incident on the photocathode, that causes a
signal equal to the dark current to be output at the
photomultiplier.
Adverse effects of
photomultipliers
Although photomultipliers are very sensitive and perfect light
detectors, as with any more complex instrument, there may be
several adverse effects that impair the detection properties.
One of the unfavorable phenomena in photomultipliers
is the so-called dark current: it is an electric
current flowing through a photomultiplier, even when the
photocathode is not irradiated. The dark current is caused by the
thermoemission of electrons from the photocathode (which occurs
to a small extent even at normal temperatures), or thermoemission
from the first dynodes participates in it; the multiplier effect
on the other dynodes is then amplified. Statistical fluctuations
of the dark current cause the detected noise pulses. The dark
current of the photomultiplier is temperature dependent, by
cooling the photocathode or the whole photomultiplier we will
significantly reduce it.
Another problem affecting the energy
resolution of the entire detection system is the inhomogeneity
of photoelectron collection; especially from the
peripheral parts of the photocathode, the efficiency of
photoelectron collection on the first dynode of the
multiplication system is reduced. Statistical fluctuations in
quantum efficiency and dark current also contribute to the
deterioration of energy resolution, which are superimposed on the
useful signal and blur the amplitude of the output pulses.
The use of photomultipliers in the
presence of a magnetic field , which deflects
electrons in their path between dynodes by Lorentz
force, is also problematic. In a stronger
magnetic field, the photomultipliers stop working!
At stronger luminous fluxes, there may be
a current overload of the photomultiplier - an
enormous flux of electrons falls on the last dynodes, which
causes "fatigue" of the dynodes,
leading to a reduction in their emissivity. In the case of a
short-term overload with a total current of several tens or
hundreds of milliamperes, this is a reversible
phenomenon, when after a certain period of "rest" the
photomultiplier returns to its original state. However, in case
of large or permanent overload, there is great fatigue or permanent
damage to the last dynodes (in the case of large
currents, also thermal damage - "burning" of the dynode
surface) !
Note: These
properties apply to "classic" photomultipliers with
photocathode and dynodes. With appropriate modifications, these
parameters and effects can also be applied to semiconductor
photodetectors.
Scintillation probe
Scintillation crystal and photomultiplier with socket and
resistive divider for powering dynodes, or with preamplifier, are
housed in a light-tight housing *); this unit
forms a so-called scintillation probe or
scintillation detection unit, generally called a scintillation
detector - Fig.2.4.1 on the right and Fig.2.4.3a.
In the next we will deal with scintillation detectors with
"classical" vacuum photomultipliers with discrete
dynodes powered by a resistive divider - these are so far most
often used for radiation detection and spectrometry.
*) Warning: Light tightness of scintillation detector is an essential condition for
its function. The scintillation probe must not be disassembled in
the light when the high voltage on the photomultiplier is
connected, as a high luminous flux would cause such a strong
current of electrons on the dynodes that it could be irreversibly
damaged and destroy the photomultiplier ! - was
discussed above in the section " Adverse effects of
photomultipliers ".
In general purpose detectors, this housing
is usually easy to disassemble, so that the crystal and
photomultiplier can be replaced and assemble a
scintillation probe with the desired properties for each
application. Single-purpose scintillation probes are usually
firmly assembled into a so-called scintiblock ( Fig.2.4.1 on the right). One of
the tasks of the metal housing of the scintillation probe is the magnetic
shielding of the photomultiplier (or
the external magnetic field could affect the movement of
electrons in the photomultiplier and thus change its
amplification).
The basic scintillation probe consists of
a "planar" cylindrical scintillation crystal
in optical contact with a photomultiplier (Fig.2.4.3 a).
The thickness of the crystal is chosen according to the gamma
radiation energy used: for soft gamma and X it can be only 5 mm,
for medium energy radiation of tens to hundreds of keV the
thickness of the crystal is about 5-10 cm. By installing such a
probe in a shielding case, equipped with a tube - collimator
at the front, a collimated scintillation probe
is created (Fig.2.4.3 b), which is used to
selectively detect gamma radiation from a desired direction,
defined by a collimator. Collimators are usually replaceable, the
entire probe is mounted on a robust tripod with
the possibility of vertical and horizontal displacement and
angular rotation of the probe. Collimated detection probes are
used in many applications of nuclear and radiation physics. In
nuclear medicine, they have been used for the targeted detection
of gamma radiation from examined organs to assess the
accumulation of radiopharmaceuticals. In the 60.-80., pairs of
collimated probes were widely used for radisotope
nephrography (later it was displaced
by far more perfect dynamic scintigraphy of the kidneys
on a gamma camera - see §4.9.2 "Nephrological
radionuclide diagnostics"). However, the collimated detection probe is still used
to measure the accumulation of radioiodine in the thyroid
gland (§4.9.1 "Thyrological
radioisotope diagnostics")
.
To measure radioactive samples in test
tubes, a well scintillation crystal
(Fig.2.4.3 c ) is used in the scintillation
probe, into the opening of which is inserted a test tube for
measurement in 4p -geometry (see below §2.7,
Fig.2.7.1). This probe is built into a
robust lead shield (Fig.2.4.3 d), it is mainly
used for measuring low-activity samples in laboratory
radiochemical analyzes, in nuclear medicine in in vitro
methods (see below §2.7 "Measurement of radioactivity of
samples (in
vitro)"), mainly by radioimmunoassay. For the measurement of
radioactive samples with larger volumes (approx. 250 ml.), the large-volume
well crystals are used in the scintillation probe
(Fig.2.4.3 e).

Fig.2.4.3 Some constructions of scintillation probes for
measuring gamma radiation.
a) Basic scintillation probe with planar
(cylindrical) scintillation crystal. b)
Collimated scintillation probe for measuring radioiodine
accumulation in the thyroid gland. c)
Scintillation probe with well (cavity) scintillation crystal. d)
NKG314 well scintillation detector for measuring radioactive
samples in test tubes. e) High-volume well
detector NKG315 (for illustration, the
large sensitizing probe placed above, is actually located inside
a robust lead shield - it is indicated by a white arrow).
A very special complex scintillation detector is a scintillation
camera containing a thin large-area scintillation
crystal equipped with many photomultipliers - see chapter 4
"Radionuclide scintigraphy", §4.2 "Scintillation
cameras". For various
detection and spectrometric purposes, very complex systems
of many scintillation detectors are often constructed in
various geometric arrangements, or in combination with other
types of radiation or particle detectors. Extensive
detection systems are being built for large
accelerators, containing among many other detectors, several
thousand individual scintillation detectors, connected in a
coincidence or anticoincidence mode to complex electronic
evaluation apparatus.(as mentioned above in
the section "Arrangement and configuration of
radiation detectors") .
Electrical supply
of the photomultiplier and processing of output pulses from the
scintillation detector
For the correct "multiplication" operation of the
photomultiplier, it is necessary to apply a correspondingly high
voltage to its individual electrodes - photocathode,
dynodes, anode. The basic supply voltage of approx. 500¸1500 V, supplied
from a high voltage (HV) source, is divided into gradually
increasing voltages by a set of resistors (resistor divider)
and led to individual dynodes (the last
dynodes before the anode are sometimes blocked by capacitors
to increase the pulse current did not cause voltage fluctuations
on the divider, which would lead to changes in gain in the dynod
system). As a rule, it is introduced
between the photocathode and the first dynode a higher
voltage than between other neighboring dynodes (the distance
of the first dynode from the photocathode is also greater than
between the other dynodes). A full voltage is connected between
the photocathode and the anode via a working resistor
(values of the order of MW), on which a current pulse generated by the passage of
electrons through a photomultiplier causes a voltage
pulse (by the effect of
"voltage drop" according to Ohm's law). This output voltage pulse is fed via an separating
capacitor to the amplifier for further
electronic processing.
The simplest
connection of a photomultiplier is a single-core power
supply with positive polarity, where only one
coaxial cable leads to the photomultiplier. Its
"live" conductor supplies a positive voltage of 500¸1500 V both for
the anode and through the resistive divider for the individual
dynode. The cable is connected to the HV source via a working
resistor (which is a part of the HV source), from which
voltage pulses generated on this resistor during the passage of
electrons through the photomultiplier are taken via a separating
capacitor. This connection is simple and elegant, but it cannot
take full advantage of the photomultiplier gain. It is suitable
for the detection of higher energy radiation (from tens of keV),
where the scintillations are sufficiently intense and the
photomultiplier signal is relatively high.
For low energies, a more complex multicore
connection with negative polarity is more
suitable. A full negative voltage is applied to the photocathode
( -500 ¸ -1500 V), the resistive divider then gradually decreases
the negative voltage to the individual dynodes; the anode is
connected to zero ground potential via a working resistor. The
output pulses from the working resistor are routed through a independent
"signal" coaxial cable to the amplifier. A pulse preamplifier
can then also be installed in the photomultiplier socket.
Negative polarity with the anode at "zero" ground
potential (in idle mode) is particularly advantageous when more
complex low-current electronic processing of the output signals
is performed and an excessive overall potential difference could
be disruptive; this is the case, for example, with the
above-mentioned hybrid photon detectors HPD.
When radiation is detected, a large amount of electrical
impulses of various sizes appears at the output of the
photomultiplier, which must be further processed and
evaluated. The relevant electronic circuits are used for
this, which amplify the pulses, sort them
according to their size - they analyze,
calculate, register, display. The processing of these pulses can
be performed in two basic ways, according to the purpose of
scintillation measurement - the upper and lower branch in the
diagram in Fig.2.4.1 :
- Measurement of the
number of pulses caused by
the detection of gamma radiation of a certain energy.
In this simpler case, the pulses from the amplifier are
fed to an amplitude analyzer, which is
an electronic circuit transmitting only pulses whose
amplitude lies in an adjustable range between the lower
and upper discriminant level (pulses
outside this range are not transmitted *). The region
between these two levels is sometimes called the "channel".
The setting of the lower and upper level is done either
independently (formerly using
potentiometers, now digitally), or
more often the basic level is set, and around it "window".
Window of the analyzer is adjusted usually to include photopeak
of gamma radiation of measured radionuclide. The channels
and the window of the analyzer are given either as a
simple numbers, or converted into energy [keV]. Standard
pulses from the analyzer has already lead to counter
- measured number (count) of pulses (for the selected
time interval) is then proportional to the number of
pulses of gamma radiation of the selected energy, and
thus the activity of the measured sample.
*) From an electronic point of
view, the amplitude analyzer consists of
two discriminators connected in anticoincidence.
A discriminator is a circuit that transmits only those
pulses, that are higher than the set
amplitude - discriminant level. The first
discriminator is set to the desired lower discrimination
level, the second is set to the upper level. An impulse
that is lower than the lower level, does not pass through
any of the discriminators. An impulse higher than the
lower level but lower than the upper level, passes
through the first discriminator, but not the upper
discriminator - the anticoincidence circuit releases
it. An impulse higher than the upper level passes through
both discriminators, but the anticoincidence circuit does
not release it. Thus, only pulses whose amplitude lies in
the range - the window - between the two
levels pass through the amplitude analyzer.
- Spectrometric
analysis of radiation
quantum energies.
The pulses from the amplifier are fed to an analog-to-digital
converter (ADC), where the analog magnitude of
the pulse amplitude [V] is converted to a numerical
value, a digital bit combination, which is fed to
the memory of "multichannel analyzer".
The acquisition procedure assigns to each pulse
amplitude, and thus the energy of the detected quantum, a
corresponding address in the memory, the
content of which increases by "1" when such a
pulse is detected, thus gradually creating a digital
energy spectrum in the computer or analyzer
memory, where the address of each memory cell is
proportional to the energy of the quantum
of radiation and its accumulated content represents the
detected number of quanta of this
energy. When displayed on a computer screen, we get a
typical curve for gamma radiation (Fig.2.4.1 on the
right) - scintillation spectrum, where
the number of photons of the respective energy is
recorded in individual "channels" (memory cells). On the
horizontal axis is the magnitude of the amplitude of the
pulses, which corresponds to the energy [keV], on the
vertical axis is the number of pulses with this amplitude
- photons with a given energy (see below).
Note: The
scintillation spectrum can be measured in principle even
using an ordinary ("single - channel")
amplitude analyzer: With a sufficiently narrow window we
gradually "go through" (gradually increase the
value of the basic discrimination level) the whole
amplitude range, for each value of amplitude (~energy) we
measure the number of registered pulses in a fixed preset
time and plot it in a graph - a spectrum.
The spectra before the era of multichannel analyzers were
measured in this laborious manual way, and the somewhat
misleading name "multichannel analyzer"
comes from these early periods. Indeed, the first such
analyzers consisted of a number of parallel "single
- channel" window discriminators. Now in
spectrometry exclusively uses an ADC, with direct storage
in the computer's memory..
In special
cases of multi-detector systems, further
electronic analysis of signals is performed - coincidence,
anticoincidence and comparison of signals from
individual photomultipliers - in order to display, evaluate the
position of sources, particle trajectories or angular
correlations.
The technical development
of radiometers and spectrometers
is closely connected with the development of low-current
electronics and its component base. From an electronic point of
view, radiometers and spectrometers can be divided into 3
generations :
1. Generation
Until the 1960s, radiometric instruments were equipped
with electron tubes - they had larger dimensions
and very limited possibilities of processing electrical signals
from detectors, mostly single-channel
measurements with one (lower) discriminant level - Fig.2.4.4 a.
The display of the measured number of pulses was by means of
analog hand gauges, or digitally by means of light bulbs
or incandescent lamps placed vertically in
columnar decatrons.
This display
consisted of 10 light bulbs or incandescent lamps placed in a row
(column) above each other, which illuminated the enclosed narrow
glass rectangle with the numbers 0,1,2, ...., 9. These columns
were placed side by side in several sets (4-6) according to the
required number of decimal places. During the measurement, the
numbers in the individual decatrons "ran" from bottom
to top, and after the end of the preset measuring time, the
respective digits remained lit in the individual decimal places
(Fig.2.4.4a, left).
In the short transitional period of the
late 1960s, circular glow decatrons were used to
display the registered number of pulses. They were glow plugs
with 10 wire circular electrodes, marked with the numbers 0,1,2,
..., 9. In addition to the display of the registered number of
pulses used also as an electronic timer to tick
pulses: When appropriate electronic participation of each
incoming pulse switch lighting up the side of the electrode (1 or
higher). And when the value "9" was exceeded, when the
electrode "0" lit up, a pulse was sent to the
neighboring decatron to increase the number there. During the
measurement, the lighting electrodes "orbits" in a
circle on decatrons at circularly arranged digits.. However, the
reading of the measured number of pulses was difficult to see,
the decatrons were soon replaced by digital digitrons.
2. Generation
of radiometric instruments (60s-70s) was already
equipped with transistors (Fig.2.4.4 b).
Multi-channel analysis could be performed, the display was using
digital glow digitrons. The measured numbers of pulses could be
printed on an electro-mechanical printer.
Digitrons
are small circular or elliptical glow-neons,
whose electrodes are thin wires shaped into the numbers
0,1,2, ...., 9. The electronic circuits of the pulse counter at
each digit - a decimal place - light up and display the
corresponding digit (Fig.2.4.4 b above). They
were later replaced by semiconductor 7- segment LEDs.
By lighting combinations of different segments, the necessary
digits of the measured number of pulses are modeled (or other
alphanumeric characters) - Fig.2.4.4 b down.
3. Generation
Great progress has been made since the 1980s with the development
of digital electronics with a high density of
integration and computer recording and control
of measured pulses (Fig.2.4.4 c, d).
They enable accurate complex processing of measured data and
their mathematical analysis using special software. Including
multichannel spectrometric analysis using an
analog-to-digital converter (ADC).
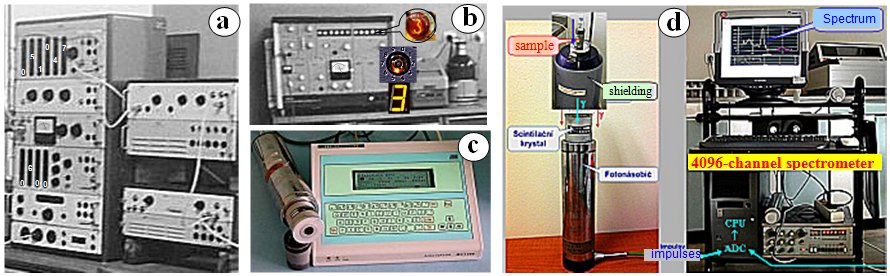
Fig.2.4.4 Technical development of electronics of radiometers and
spectrometers (examples of some instruments at our
Nucl. department in Ostrava) .
a) Electron-tube radiometer NZG 319 (TESLA VÚPJT Pøemyšlení) with a
columnar bulb display. b) Transistor
spectrometer NZQ 717T (TESLA Pøemyšlení)
with glow digitron display. c) Digital
spectrometer MC1256 (TEMA) with 256-channel analyzer. d) Computer
4096-channel spectrometer Genie 2000 (Canberra
Packard) for scintillation and
semiconductor spectrometry.
All these generations of
radiometric and spectrometric instruments have been gradually
used at our Depertment of nuclear medicine in Ostrava since 1973.
It is interesting that the electronic evaluation apparatus
underwent significant technical changes, while the detectors
themselves - ionization chambers, scintillators,
photomultipliers, remained essentially the same for many decades.
Only conventional vacuum photomultipliers have
recently been seldom replaced by semiconductor
photodetectors (they are described
above in the section "SPM
semiconductor photomultipliers").
Advantages
of a scintillation detectors
If we compare the situation with G.-M. detector, we see that we
achieved a similar result with the scintillation detector -
again, the quantum of invisible ionizing radiation was detected
by converting it into electrical pulses at the output of the
photomultiplier. The question may arise: Why so complicated? The
answer is: Scintillation detectors, compared to G.-M. detectors,
have three important advantages (we will list them here for the most common case of
gamma radiation detection) :
- High detection
efficiency (sensitivity)
In a massive scintillation crystal with a relatively high
density and proton number, a substantially larger part of
the gamma radiation is efficiently absorbed (and thus
detected) than in the diluted gas in G.-M. tube (where
most of the quantum g
passes without interaction). Thus,
scintillation detectors have a high detection efficiency
(sensitivity), which is often close to 100%.
- Short dead time
The duration of scintillation in the crystal is extremely
short - only about 10-9 sec. The time for which electrons pass and
multiply in the photomultiplier is also very short -
about 10-8 sec. The time of forming and processing an
electrical impulse (time constant) in the amplifier and
analyzer is about 10-6 seconds for current electronics; it is this
(slowest) time that is decisive in the whole
spectrometric chain *). The dead time of the
scintillation detector is thus about 1 ms, which is almost 100 times shorter than that
of G.-M. detectors.
*) However, technical advances in
electronics (the use of fast electronic components
capable of operating in the gigahertz frequency domain)
have reduced the dead time of
electronics more than 10 times. The scintillator
itself gradually becomes the slowest link in the
detection chain - the duration of scintillation, the scintillation
afterglow. For this reason, in some devices
(such as PET cameras or fast multidetector CT), the
scintillation crystals based on NaI(Tl) or BGO are
replaced by faster scintillators based
on rare earth doped silicon oxides,
especially LSO (see below "Scintillators and their properties"). Gradually, the limiting factor becomes the
dead time of the photomultiplier tube
(for CT scanners which require only rapid detection and
not spectrometry, are used instead of photomultipliers
miniature photodiodes, which are faster and also
considerably cheaper).
- Spectrometric
properties
The intensity of the light flash in the scintillator is
directly proportional to the energy of the measured
quantum that has been absorbed there. And the number of
the photoelectrons emitted from the photocathode of the
photomultiplier is directly proportional to this flash
intensity. The multiplication process of electrons on
dynodes is also exactly linear. Thus, the amplitude
A (height) of the output pulse from the
photomultiplier is directly proportional to the
energy Eg of the detected radiation: A ~ Eg (more
precisely, the amplitude is proportional to the quantum
energy absorbed in the scintillator; deviations from this
proportionality will be discussed below "Scintillation
spectrum"). By amplitude
analysis of output pulses from a scintillation
detector, we can perform an energy analysis
of the detected radiation - its spectrometry.
These three
properties make the scintillation detector an almost ideal
device for the detection and spectrometry of ionizing
radiation, especially gamma radiation. High detection sensitivity
allows its use for the detection of even very weak radiation or
low activities. The short dead time, in turn, allows lossless
measurement of even relatively higher radiation intensities or
higher activities. *) The scintillation detector therefore has a
very wide range of detectable intensities of ionizing radiation,
with the possibility of spectrometric selection and analysis.
*) The same dependence applies to the dead time of the
scintillation detector as shown in Fig.2.3.4 on the left in the
paragraph about G.-M. detector, but the value of the dead time
here being mostly t @ 1 ms. The same principles apply to the measurement of dead
time and event. dead time correction.
Gamma radiation scintillation spectrum
Let's stop in more detail at point 3 - spectrometry.
Scintillation detectors are by far the most commonly used for
gamma radiation. Let us imagine initially that we irradiate a
scintillation detector with mono-energy gamma radiation
*) of energy Eg. The real ("physical") spectrum of this
radiation will have a simple shape according to Fig.2.4.1 at the
top right - the only narrow peak g1 in the spectrum (we do not consider the other two lines
yet). Photons of gamma radiation will interact with the
scintillator either by a photo effect - then in
a single interaction the photons are absorbed and give all their
energy to the ionizing electron, or by Compton scattering,
when they give up only a part of their energy to the electron
(and then either escape or cause another interaction); at high
energies also by the formation of electron-positron pairs
(with a number of subsequent interactions
including annihilation of the positron with the electron to
produce additional radiation g). The generated secondary
electrons then transfer their energy in the detector
material in a series of collisions until they
are completely braked (to thermal energy). The height of the pulse at the output of the
photomultiplier will always be proportional to the energy
that the gamma photon actually lost in the
crystal.
*) Gamma-photons come from
nuclear transitions between discrete levels with
precisely given energies, so they are basically monoenergetic,
their ideal physical spectrum represents a sharp line
on the energy Eg. Very small fluctuations in energy values are caused by
quantum uncertainty relations and backscatter of
nuclei during gamma-photon emission. Furthermore, since
these photons practically never come from free nuclei, but are
emitted from radioactive atoms contained in a substance (in a
certain material), some photons interact with the substance
before leaving the sample. It can also blur their energy a bit.
For e+ e- annihilation
radiation, the 511keV peak is somewhat blurred (by about 1.2keV) due to the Doppler
broadering at different residual velocities of positron
braking in the substance. However, the magnitude of these
extensions is generally very small compared to the effects at
self radiation detection. The real, physical, spectrum of gamma
radiation can therefore be considered practically line
(monoenergetic) - it is discussed in §1.2., passage "Spectrum
of gamma radiation".
If we plot the
magnitude of the amplitude A of the output pulses from the
photomultiplier on the horizontal axis and the number of pulses n
with this amplitude A on the vertical axis, we get the
curve of the characteristic shape in Fig.2.4.1 at the bottom
right - scintillation spectrum of gamma
radiation. The horizontal axis of the amplitude can be calibrated
so that the individual points correspond directly to the energy
of the detected radiation in keV (see below). The energy
scintillation spectrum of gamma radiation consists of two main
parts - a relatively sharp photopeak and Compton's
continuous spectrum. The structure of the scintillation
spectrum is shown in more detail in Fig.2.4.5 on the left :

Fig.2.4.5. Scintillation gamma spectrum.
Left: Scintillation spectrum structure.
Right: Dependence of the shape of the
scintillation spectrum on the scattering medium.
Terminological note :
In the older literature we can find the terms "differential
spectrum" and "integral spectrum".
This comes from a time when amplitude analyzers were not yet as
perfect, it was either just the lower discrimination level or two
independent levels. The "integral spectrum" was created
by measuring the integral pulse frequency as the lower
discrimination level gradually shifted upwards; it was a
descending curve with the largest gradient of decrease at the
location of the photopeak. By derivation of this
"integral spectrum" originated a actual spectrum,
formerly called "differential". The term "integral
spectrum" is no longer used for a long
time, each spectrum is "differential" with a certain
width of the window of the analyzer. The name spectrum
or energy spectrum is used, possibly with the adjective
"scintillation" or "semiconductor"...
Photopeak - energy resolution of
scintillation detector
On the curve of scintillation spectrum is seeing a significant
peak - the so-called photopeak or peak
of total absorption, corresponding to photons g, which were
completely absorbed in the crystal (especially
by the photoeffect, or by multiple scattering or a combination of
several interactions) and handed over all
their energy.
The question arises,
why the photopeak is relatively wide, when the actual spectrum of
monoenergetic gamma radiation is very narrow - discrete, line?
There are several reasons for this "blurring" of the
photopeak :
1. The primary limitation on energy resolution
is caused by statistical fluctuations in the
number of scintillation photons released N . This gives a
basic theoretical limit of what the best
resolution can be obtained with a given crystal of known light
yield - for the resolution R, defined below as the
half-width of the photopeak in percent, it is R = (2.35/ÖN) .100%. In the
NaI(T1) scintillator, an average of about 40 scintillation
photons are released per 1keV; according to the laws of quantum
statistics it will be 40 ± 6 photons, ie the relative statistical fluctuations in
the number of photons emitted during scintillation will be about
16% for this energy 1keV and R @ 37%. Incomplete
scintillation transfer to the photomultiplier and the imperfect
efficiency of opto-electrical photon detection further reduce the
number of detected photons and worsen the statistical
fluctuations of the actually detected photons. These statistical
fluctuations in the number of detected light photons blur
the amplitude of the output pulses - and thus the photopeak.
2. Nonlinearity light yield of
the scintillator (disproportionate light output) - the number of
photons of light emitted per unit of energy absorbed is not
constant, but depends on the energy of the particles exciting the
crystal *). Scintillation in the crystal occurs by cascades of
secondary electrons of different energies, so if the light yield
is disproportionate, the number of emitted photons will vary
(according to different energy distributions of the primary
detected quantum to a cascade of photons and electrons of
different energies), although the total absorbed energy is the
same. This also causes degradation of the energy resolution.
*) Violation of the
proportionality of the scintillation yield is manifested
mainly in the area of low energies (keV units).
The main cause is the high concentration of charge carriers
created by the interaction of ionizing radiation with
scintillation material. As the kinetic energy of an electron
moving in a matter of matter decreases (according to Bethe's
relation), the linear energy transfer dE/dx increases
and the ionization density increases along the
path. This leads to higher non-radiation recombination of
electrons with ions - there is a "quenching"
of potentially scintillating electron contributions and thus a reduced
scintillation yield in the field of low energy. However,
some of the charge carriers may diffuse into the environment with
a lower ionization density, where they may cause scintillation.
This depends on the mobility of the charge carriers in the
material. Significant changes in the effective cross section of
the interaction in the areas of binding energies on the K
and L shells of the scintillation material also contribute
to the anomalies in proportionality (K- and L-edge effects).
The nonlinearity of the scintillation yield can be characterized
as a function of the energy of photons or electrons. We recognize
the photon disproportionality of the response,
which affects the linearity of the energy calibration function of
the detector. In terms of the effect on energy resolution,
however, the nonlinearity of the response is more important as a
function of electron energy - the electron
disproportionate of response.
3. Imperfect (inhomogeneous) efficiency of
scintillation photon collection on a photomultiplier
photocathode. If scintillation occurs in the peripheral parts of
the crystal remote from the photocathode, a slightly smaller
number of photons strike the photocathode than when scintillation
occurs in the middle and near the photocathode; the amplitude of
the output pulses will differ even with the same delivered
primary radiation energy. This effect is exacerbated if the
scintillation crystal is not sufficiently optically transparent
and homogeneous. The resolution therefore also depends on the
perfect optical transparency of the
scintillation material - so that, if possible, the same
percentage of scintillation photons, regardless of the
scintillation site, can fall on the photocathode of the
photomultiplier.
4. Inhomogeneous photoelectric sensitivity of
the photocathode - the impact of the same number of photons in
different places of the photocathode can lead to the emission of
a slightly different number of photoelectrons. There is also an
inhomogeneity in the collection of photoelectrons; especially
from the peripheral parts of the photocathode, the efficiency of
photoelectron collection on the first dynode is reduced.
5. Statistical fluctuations of quantum
efficiency and dark current of the photomultiplier, which are
superimposed with the useful signal and blur the amplitude of the
output pulses.
These effects cause "blurring"
of the photopeak and deterioration of energy resolution
of scintillation detector. From points 1.-3. it follows, that the best
energy resolution can be expected for scintillators with high and
energy proportional scintillation yield, high optical
transparency and good optical contact with the photomultiplier.
By the energy
resolution R of the detector we mean the smallest
difference in the energies of the detected radiation, which still
yet distinguish in the spectrum as two peaks, or equivalently
so-called half-width of the photopeak D1/2 - its width at half height (FWHM). The resolution is
expressed either absolutely in keV or relatively (percentage) as
the ratio of the half-width D1/2 to the energy value Eg of the center of
the photopeak: R = (D1/2 / Eg) .100 [%]. The measured
value of energy resolution depends on the energy Eg; it is customary
to state it for Eg = 662 keV of radionuclide 137Cs (Fig.2.4.5 left).
For NaI(T1)
scintillation detectors the energy resolution is around 6-10%.
The best energy resolution of about 3% is provided by the lanthanum
bromide scintillation crystal doped with cerium LaBr3
(:Ce); this is due to its high light yield of 63,000
photons/MeV and good energy proportionality.
In Fig.2.4.1 on the right we see how the imperfect
energy resolution of the scintillation detector causes the
photopeaks of the two spectral lines of radiation g2 and g3 with close energies
to partially merge into one peak; if the two energies were even
closer, a single photopeak would be formed from which these
energies could not be distinguished. In this case, a
semiconductor detector must be used (see
below §2.5 "Semiconductor detectors" , Fig.2.5.1) .
In our spectrometric
measurement of the 137 Cs radionuclide on a scintillation NaI(Tl) detector, the
half-width FWHM of the gamma peak at 662keV was 55keV (8.3%),
while with the semiconductor HPGe detector FWHM it was only
1.4keV (0.2%) - significantly better energy resolution !
Energy resolution and
detection efficiency of different sizes of scintillation crystals
For the NaI(Tl) scintillator, the
theoretical resolution limit, resulting purely from the
statistics of the number of scintillation photons emitted, for an
energy of 662keV would be about 1.4%. In reality, however, the
resolution is much worse (this is due to
the significant disproportionate light output in the low energy
region, irregularities in photon collection and other influences
discussed above at the beginning of this paragraph). For NaI(T1) scintillation detectors
of conventional designs, the energy resolution is around 6-10 %;
it is better for small thin scintillation crystals, while for
large-volume and well detectors it deteriorates to about 15-17 %.
For NaI(Tl) scintillation detectors of several different
sizes and designs used in our workplace, we measured the
energy resolution FWHM in [%] and detection efficiency [%] for
gamma radiation 137Cs energy 662keV (measured spectra
are normalized to the same height of the 662keV 137Cs
photopeak) according to the following table
:
diameter 40 mm
thickness 5 mm |
diameter 40 mm
thickness 25 mm |
diameter 40 mm
thickness 50 mm |
diameter 127 mm
thickness 60 mm |
diameter 170 mm
thickness 130 mm |
| FWHM : 5.7 % |
7.2 % |
8.3 % |
11.8 % |
17.1 % |
 |
Detection 4 %
efficiency:
|
13 % |
22 % |
35 % |
82 % (4p mode) |
In the first 3 columns in the table,
cylindrical NaI(T1) scintillation crystals of standard diameter 4
cm and thickness 5-50 mm were used. A very thin 5mm detector has
good energy resolution, but it has a reasonable detection
efficiency only for low-energy radiation of tens of keV (we used
it to measure X-fluorescence), but for higher gamma energy it has
a very low detection efficiency. Scintillation crystals 4 cm in
diameter with thicknesses of 25 mm and 50 mm we use as standard
in our radioisotope laboratory. The detector with a diameter of
127mm and a thickness of 60mm was used in a motion scintigraph,
the large crystal with a diameter of 170mm and a thickness of
130mm of the well design is used for measuring large volume
samples.
Specific values may vary slightly between different
manufacturers of scintillation crystals and photomultipliers, but
the overall trend is a deterioration in energy resolution
with crystal thickness. The best energy resolution is for
thin scintillators, the worst is for large-volume well detectors (last column in the table on the right), where there is a complex geometric situation for
detection in different places of the crystal
- see below §2.7 "Measurement of sample radioactivity", passage "Position dependence of the
photopeak at the well scintillation detector",
Fig.2.7.2 on the right.
Another trend is also seen from the measured spectra,
that the relative proportion of the photopeak relative to the
continuous Compton scattered component in the spectrum is higher
for thicker crystals (this compton
continuum is discussed below in the section "Continuous Compton scattered
spectrum"). The main and obvious pattern is increasing the
detection efficiency with the size (thickness, volume)
of the scintillation detector, especially for high-energy
radiation - bottom row of the table.
Continuous
Compton scattered spectrum
Before of the photopeak, to the
left to the beginning of the graph, stretches a continuous
spectrum corresponding to photons, which have lost only
part of their energy in the crystal by Compton scattering
(Fig.2.4.5). The continuous Compton scattering spectrum has a
characteristic shape resulting from the laws of Compton
scattering (see §1.6 "Ionizing
radiation", section "Interaction
of gamma and X-rays", passage
"Compton scattering").
Just before the photopeak, the Compton continuum ends with a
relatively rapid decrease called the Compton edge
- it corresponds to the maximum possible energy transferred to
the electrons in one Compton scattering of a given gamma
radiation (at a total reflection of 180°). With multiple Compton scattering of the photon g, the transmitted
energy is higher - a part of the Compton scattering also extends
into the photopeak region, which is disturbing in spectrometry.
The shape and relative representation of the Compton spectrum
with respect to the photopeak somewhat depends on the geometric
conditions at detection.
The shape and relative proportions of the Compton
spectrum with respect to the photopeak depend somewhat on the
size of the scintillator and the geometric proportions of the
detection. With a larger scintillation crystal volume, it is more
likely that Compton-scattered photons will not escape from the
scintillator, but will eventually be completely absorbed by the
photoeffect or repeated Compton scattering, thus contributing to
the photopeak. Thus, for larger scintillation crystals, there
will be a lower representation of the Compton continuum
and a larger representation of the photopeak (but the photopeak will be wider, with worse energy
resolution...).
In the continuous Compton continuum is sometimes
observed a low and wide backscattering peak,
corresponding to photons that were scattered in the surrounding
material and only then be detected. Since Compton scattering also
occurs in the measured sample itself and in the material around
the detector, it can be in the presence of a larger amount of
scattering medium a substantially increased representation
(height) of the continuous part of the spectrum, as can be seen
in Fig.2.4.5 at the bottom right.
X-escape spectrum
Upon absorption of the primary photon g in the scintillator
material by the photoeffect, a characteristic X-ray (K-series) is
produced, which is usually absorbed and then contributes to the
photopeak, but some of it can escape from the
detector. If this occurs, then a response is generated reduced by
the energy of this photon X. In the case of the NaI(T1)
scintillator, it is a characteristic iodine X-ray with an energy
of about 28keV. At energies g
higher than about 200keV, when the
photopeak is wide, the corresponding impulses fall into the
photopeak and cause only some expansion of its leading part.
However, at low energies (around 60-80keV, when the photopeak is
narrower), a so-called escape peak may appear in
the spectrum, lying about 28keV lower than the main photopeak.
Annihilation
spectrum
When g
radiation with an Eg energy higher than 1,022 MeV is detected,
electron-positron pairs are produced when interacting with the
detector material, while the positrons immediately annihilating
with the electrons to form two gamma quanta of 511 keV.
Therefore, an annihilation photopeak
corresponding to this 511keV energy appears in the spectrum. If
both annihilation photons are detected by complete absorption,
they contribute to the primary photopeak. Furthermore, some of
the 511 keV annihilation photons may escape from the detector,
which will reduce the response by this energy - an escape
peak corresponding to the energy Eg-511 keV appears
in the spectrum. If both annihilation photons escape, this will
result in a peak in the energy range 1022keV lower than the
primary photopeak.
Summation
(coincidence) peaks
are discussed in the following section "Gamma-ray
spectrometry".
Pile-up effect
If two quanta of radiation fly into the scintillator almost
simultaneously, the respective scintillations are not detected
separately, but the light and electrical response from the two
quanta is added (pile-up) and gives
rise to a single the resulting pulse at the
output of the photomultiplier, the amplitude of which corresponds
to the sum of the amplitudes from booth scintillations. If one or
both scintillations correspond to a photopeak, then the resulting
summation pulse will be above the photopeak; when measuring in
the analyzer window set to the photopeak, this pulse will fall
outside the window and the corresponding pair of quanta will not
be detected. This situation occurs mainly at high frequencies of
radiation quanta - the pile-up effect contributes to the loss
by dead time, it can simulate the so-called paralyzable
component of dead time. However, if there is a pile-up effect on
two simultaneous Compton scattered photons, the resulting pulse
may fall into the photopeak with its amplitude. This situation
can be adversely applied to scintigraphy at high pulse
frequencies - see §4.2 "Scintillation
cameras" section "Adverse
effects in scintigraphy - Compton scattering g ".
Noise
At very beginning of spectrum appearing pulses of low amplitude
(but unfortunately high frequency) corresponding to the noise
- spontaneous thermal emission of the photocathode, noise in
electronic circuits. Noise is a fundamental limiting factor and
an obstacle in the detection and spectrometry of low-energy
radiation. These noise pulses can, if necessary, be substantially
reduced by cooling photomultiplier and the
preamplifier, e.g. to the temperature of liquid nitrogen.
Gamma
and X-ray spectrometry
Here we briefly analyze some methodological principles of spectrometric
analysis, which are common to all types of spectrometric
detectors, not only for scintillation but also semiconductor
(described in the following §2.5 "Semiconductor
detectors") and
magnetic ("Magnetic spectrometers").
The basic task of gamma
radiation spectrometry *) is to determine the energy
and intensity of individual discrete groups of gamma
radiation photons emitted by the investigated
radionuclide or mixture of radionuclides, or photons of
characteristic or braking X-rays arising in the
electron shell of atoms as a result of nuclear or electrical
processes.
*) Gamma radiation is by far the
most common subject of spectrometric analysis. Beta spectrometry
will be briefly discussed in the following paragraph.
Spectrometry of other types of ionizing radiation is performed
only sporadically; appropriate references to the methodology of
such measurements are given in various parts of the text as
appropriate.
In most
spectrometers, the energy and flux of gamma photons are not
determined directly, but by measuring the energy and current
intensity of secondary charged particles,
especially electrons, which are produced by the interaction of
primary radiation with the substance - sensitive material of the
detector. The only exception is crystal diffraction
spectrometry, where the energy (wavelength) of X-ray or
soft gamma radiation is determined directly - goniometrically
according to the scattering angle (§3.3,
section "X -ray diffraction analysis").
The individual energy groups of gamma
photons (or characteristic X-rays) are displayed in the spectrum
as respective peaks called photopeaks; the
radiation energy determining the position of the
photopeak on the horizontal axis of the spectrum and the
intensity determining the height of the peak,
resp. area (integral) under the photopeak.
Braking X-rays and Compton-scattered gamma rays have a continuous
spectrum. The energy and efficiency calibration of the
detector must be performed to accurately determine the
energies and intensities of the radiation g.
Calibration of the spectrometer
In order for the measured spectrum to objectively express the
distribution of energies and intensities of photon radiation,
must be performed an accurate calibration of
energy responses and the dependence of the detection efficiency
of the spectrometer on energy .
The energy calibration of a
spectrometric detector consists in determining the correct scale
on the horizontal axis, based on the fact that the amplitude of
the output pulses is proportional to the energy of the radiation
absorbed in the detector. For energy calibration, it would in
principle be sufficient to measure the position of the photopeak
for one known radiation energy g and to guide a straight
line passing through the origin (direct proportionality) through
this calibration point. However, the exact linearity of the
entire electronic chain may not be ensured a priori; the
calibration dependence also sometimes does not go through a
"zero" origin (different voltage
levels in electronic circuits play a role here). For reliable energy calibration, it is therefore
advisable to use several radiation lines g of different known
energies. The most common standard radionuclides
for energy calibration of gamma spectrometers are: americium 241 Am (g 26.3+ 59.6 keV + X
11.9 + 13.9 + 17.8 +20.8 keV), cobalt
57 Co (g 122 +136 keV), cesium
137 Cs (g 662 keV - the most important standard ever) , cobalt 60 Co ( g 1173 +1322 keV) , europium 152 EU (g122, 245,
344, 779, 867, 964, 1086, 1112 and 1408 keV). The
scintillation and semiconductor spectra of these radionuclides
are given in §1.4, section "Properties of some of the most important
radionuclides".
For energy calibration,
we should therefore measure the spectrum of at least three
radionuclides in the region of energies Eg of interest (or one
radionuclide with a larger number of gamma radiation energies)
and determine the positions of photopeaks Ag. Using the
calibration points [Eg, Ag] obtained in this way, we interpolate the
calibration line (or the curve with larger
deviations from linearity) - least squares method, by projection
of their values Eg we get the energy calibration of the horizontal axis -
Fig.2.4.6 on the left :

Fig.2.4.6. Energy calibration dependence (left)
and efficiency calibration dependence (right)
of a gamma radiation scintillation spectrometer (a 10 mm thick
NaI (Tl) scintillation crystal was used, an Al cover of 1 g /cm2 ).
Calibration of the
detection efficiency of a spectrometric detector is much
more complicated. This is because the detection efficiency is
significantly dependent on the gamma radiation energy
according to the curve shown in Fig.2.4.6 on the right: for low
gamma radiation energies, the detection efficiency is low because
these photons are absorbed through the input window and have
difficulty penetrating in the sensitive detector volume.
Therefore, first the detection efficiency increases with energy
and reaches a maximum for energies of about 60-100 keV. Then,
again, the detection efficiency slowly decreases with increasing
energy, because at higher energies more an more part of the
photons g flies through the sensitive volume of the detector
without being absorbed by the photoeffect. The dependence of the
detection efficiency on the energy can be roughly expressed by
the biexponential function :
h (Eg) = P. (1- e -R1 .Eg) . e -R2 .Eg ,
where the coefficients R1 and R2 (> 0), indicating
the rate of rise and decline, depend on the size and material of
the detector and on the absorption properties of the input
window.
For absolute calibration of the detection
efficiency h is necessary to measure the spectra of several
spectrometric standards of precisely known
activity and thus the intensity Ig of gamma radiation of
different energies Eg , by integration determine the area under the photopeaks
Sg and
vith thus created calibration points [Eg, Sg] then interpolate the
efficiency calibration curve h(Eg), as shown in
Fig.2.4.6 on the right. If only a relative calibration of the
detection efficiency is sufficient, a suitable radionuclide with
several g radiation lines (such as europium
152
Eu) can
be used and the calibration curve can be interpolated
based on the known intensity ratios of the individual peaks.
If we have already calibrated the
spectrometer, the actual spectrometric analysis
begins by preparing the sample and measuring its spectrum with a
sufficiently high "statistic" - a sufficiently large
number of n registered pulses to allow statistical
fluctuations 1/Ön were low enough. The following is an analysis in which
we find individual photopeaks in the spectrum, determine their energy
and use the integral (area)
under the peak to determine the intensity of the
respective gamma radiation line. For this purpose, it is usually
necessary to mathematically separate the actual photopeak curve
from the continuous spectrum and event. decompose the
composite photopeak into individual components -
photopeaks of energetically close lines g. Photopeaks are usually
approximated by Gaussian curves. This mathematical
analysis of the spectra is now performed using special
computer software, and on the basis of the measured energies and
intensities of the gamma radiation lines, this spectrum is they
assign the corresponding radionuclides - interpretation
of the spectrum.
Scintillation and
semiconductor gamma radiation spectra of a number of important
radionuclides, together with decay schemes, description of their
properties and applications, are shown in detail
in §1.4 "Radionuclides", section "Properties of some of the most important
radioactive isotopes".
Summation (coincidence) peaks
In gamma radiation spectrometry we can encounter an interesting
phenomenon of false so-called summation
peaks, which do not correspond to any of the actual
energies of the emitted radiation g or X. This phenomenon
occurs at the detection level, when the measured radionuclide
emits two or more groups of radiation photons g or X at
the same time (none of the respective levels is
metastable). If both such photons g1 and g2 are detected
simultaneously, the light or electrical responses from both
quantums are summed in the detector to give a
single resultant pulse whose amplitude corresponds to the sum of
the energies Eg1 + Eg2 . This resulting summation peak mimics
gamma radiation of the sum energy, which does not actually exist.
The relative intensity of the summation
peak crucially depends on the detection efficiency.
With low detection efficiency, simultaneous detection of both
quanta is unlikely, so when planar measurements in geometry 2p and lower, have a
summation peak of negligible intensity and we usually do not even
observe it. The higher the detection efficiency, the more
pronounced the summation peak; with a detection efficiency of
100%, we would no longer observe the primary peaks of both real
quanta, only a false summation peak would appear in the spectrum!
- (provided, of course, 100% of radiation emission, without
internal conversion, etc.). This dependence can even be used to
determine the absolute detection efficiency of measuring a given
radiation or activity of a sample. Under these simple
circumstances, the detection efficiency h can be determined from the
simple relation h = 4. I2Sg1+
g2 / (Ig + Ig2 + 2.ISg1+ g2 )2 , where Ig1 and g2 are the intensities
of the primary peaks and ISg1+g2 is the intensity of
the summation peak.
The summation peak often manifests itself in
radionuclides decaying by electron K-capture
(accompanied by the emission of characteristic X-rays when
electrons jump from the L shell to the K shell) immediately
followed by the emission of g
from the excited level of the daughter
nucleus. This is where coincidence g is detected and the
characteristic X-rays (line Ka
, Kb ), and form a summation peak corresponding to energy Eg + EX. A typical example is
the 125I
radionuclide, which is converted to 125Te by K-capture, emitting g with an energy of 35 keV
and X with an energy of 27 keV. With sufficient detection
efficiency (125I samples are often measured in tubes in a well
scintillation detector), a significant
summation peak corresponding to an energy of 62 keV is observed -
see §1.4. "Radionuclides", passage "I-125". Summation peaks can also be observed in the
gamma spectra of lutetium 176 Lu or indium 111In .
The summation peak can occur even at a high flux of
photons of radiation g, when two photons can fall into the detector at the
same time and cause the resulting scintillation with the sum
intensity - random coincidence.
Analysis,
evaluation and interpretation of spectra
The analysis of the measured spectrum is used primarily to
determine the energies and intensities of
individual components of the detected radiation. The radiation
energy is determined by finding the position of
the peaks of the photopeaks in the measured spectrum, of
course, assuming the correct energy calibration
of the spectrometer (Fig.2.4.2 on the left). The intensity
of the respective line g is determined from the integral of the photopeak
(area under the photopeak curve), in the first approximation can
also be easily determined using the height of the photopeak.
This value then needs to be recalculated
(corrected) according to the energy efficiency
curve (Fig.2.4.2 on the right).
A significant problem in the analysis of
spectra is the imperfect energy resolution of
the spectrometer. Photopeaks of nearby energies then partially
(or in the worst case even completely) merge, it is difficult to
separate them from each other. Special "filtration
or deconvolution" is sometimes used to
additionally "improve" the energy resolution when
evaluating spectra (eg application of Laplace filters, Metz or
Wiener filters). However, these procedures are only applicable
with a sufficient number of accumulated pulses (good
"statistics"), as they are very sensitive to data
fluctuations - their application significantly amplifies
statistical fluctuations. The issue is largely similar to the spatial
resolution of photographic or gammagraphic imaging (cf. the
work "Filters
and filtration" in
scintigraphy).
In the mathematical analysis of
spectra, the positions of the vertices
are determined, the photo peaks are interspersed with suitable
functions (mostly Gaussian curves), the background curves are
also fitted, the photo peaks are separated from the background
and from each other. The integrals of the resulting photopeaks
are then determined and corrected for the energy dependence of
the detection efficiency. This creates values of energies and
intensities of individual components of the measured radiation,
which is the final result from the point of view of
spectrometry. Depending on the application used, these results
are then further interpreted - for example, they
are assigned the appropriate radionuclides
(their type and quantity) contained in the analyzed sample.
Spectrum analysis used to be done manually, which was a very
laborious matter. Powerful spectrometry computer software is now
available that allows instant online analysis of spectra,
including evaluation and interpretation of results - such as
assignment using a radionuclide spectrum database.
Adverse
events with scintillation detectors
were discussed in more general terms in more detail in the
conclusion of §2.1, passage "Aging and
radiation wear of detectors" and "Nuclear
reactions and induced radioactivity inside detectors".
In addition, we will mention the risks of very intense radiation.
Exposure to strong radiation can cause radiation-induced chemical
reactions in the detector material, deteriorating the detector's
properties - reducing detection efficiency and deteriorating
resolution. Immediately after such overexposure, the detector may
exhibit an increased intrinsic background, caused by deexcitation
of metastable levels and chemiluminescence of molecules released
in the detector during intense exposure. Extreme radiation
intensity can irreversibly damage the detector !
- strong electron flux in the photomultiplier can damage the
surface of the dynodes.
Scintillators and their properties
Mechanism of scintillation formation
Inorganic
scintillators
Solid state physics describes the electrical and optical
properties of these substances using the so-called band
theory, according to which electrons in matter are
combined into energy bands separated from each other by
unoccupied bands of "forbidden" energies. Discrete
energy states of electrons orbiting individual atoms in solids in
orbits propagate into energy bands due to
interaction with other atoms in the solid, but there are certain
gaps between these bands - the so-called bands of
forbidden energies, which electrons cannot acquire. The
highest energetically occupied belt is the valence
belt, followed by a forbidden strip and above it lies the conductivity
strip, which is completely unoccupied
in the equilibrium (basic) state of the insulators. However,
this is only the case with an ideally formed crystal lattice. In
reality, however, various changes and defects
occur in the regularity of the crystal lattice (they occur both spontaneously and can be created by
activation of ions of suitable elements), which lead to local discrete energy levels
in the forbidden area between the energy bands. Electrons from
other bands can jump into these new energy levels. This creates excitation
centers, which are of three types according to the
nature of the process in which the transition of electrons
between energy levels occurs: luminescent centers,
centers of metastable states and quenching
centers - Fig.2.4.7 on the left (there is
only one luminescent center marked).
If ionization occurs in the crystal by a
charged particle or photon and the released electron has a
sufficiently high energy, it jumps to an empty conduction band.
During movement in this band, the electron can be captured by the
luminescent center at a higher energy level
(excited state). When switching from this higher level to a lower
level, the emission of luminescent (fluorescent)
radiation occurs. However, electrons from the
conduction band can first be trapped in free metastable
levels and only after returning to the conductive band
will they cause light radiation to pass through the luminescent
centers - delayed luminescence radiation, or phosphorescence,
is emitted. The activated alkali metal halides,
metastable energy levels also exist directly in the luminescent
centers, so there occurs immediate fluorescence and delayed
phosphorescence in the same spectrum as in direct luminescence (from the metastable state, the electrons first pass to
the excited luminescent energy level after gaining energy, from
which the transition to the ground state occurs as in direct
luminescence). Finally, electrons can be
trapped in the levels extinguishing center,
where there is no emission of light, but non- radiative
energy transfer by electromagnetic interaction with surrounding
atoms.
In inorganic
scintillators, the luminescent centers
can be formed by the base material, and a large number of
luminescent centers can be additionally formed by introducing activator
ions - dopants *) into the crystal lattice -
these ions cause said additional discrete levels in the band gap
(Fig.2.4.7 left ). Silver ions in zinc sulfide
crystals ZnS(Ag) or thallium ions (in an amount
of 1-2%) in crystals of alkaline element iodides such as NaI(Tl)
can serve as activators.
*) Activator labeling convention :
In the literature on ionizing radiation detection, it is
customary to indicate the activator or doping element in parentheses
after the chemical label of the main carrier - eg NaI (Tl), Lu2 SiO5 (Ce), etc. However,
chemists prefer the convention of colon ":"
labeling - eg NaI: Tl, Lu2SiO5: Ce, Al2O3:
C and the like. The designation with parentheses in chemistry
could be confused with indexed groups in chemical samples of
compounds, eg SO4(NH4)2.
Here in our physical treatise, we mostly use designations with
parentheses, sometimes compromise designations combined
- Al2O3 (: C), CaF2 (: Dy) etc.
Fig.2.4.7. Symbolic representation of the mechanism of
scintillation formation in inorganic and organic substances.
Left: In inorganic
scintillators, scintillation photons are formed by jumps of
electron captured at higher levels of luminescent centers formed
by perturbations in the scintillator crystal lattice (activator
Tl in the NaI crystal lattice).
Right: In organic
scintillators, the scintillation occurs by deexcitation of the
excited molecules of the scintillator itself.
For both cases, the resulting scintillation consists of several
hundred of these secondary photons, depending on the absorbed
energy of the primary quantum detected (and thus the number of
ionization electrons) and the conversion efficiency of the
scintillator.
Organic
scintillators
In organic scintillators, the
mechanism of scintillation formation is different from that of
inorganic substances - it is the excitation and deexcitation of
the energy states of the scintillator molecules
themselves. Organic molecules exhibiting scintillation properties
are mainly benzene nuclei of cyclic "aromatic"
compounds.
The energy
states of a molecule, which are quantized, arise in
three ways: by rotating the molecule as a whole, by oscillating
motion (vibrations) of atoms in the molecule, and as a result of
changes in its electronic configuration. Rotational
states are separated only by very small energy intervals
(approx. 10-3 eV) and the radiation that arises during transitions
between these states has a spectrum in the microwave region with
wavelengths of 0.1-10 mm. The vibrational states
are separated by slightly larger energy intervals (approx. 0.1
eV) and the vibrational spectra lie in the infrared region with
wavelengths of approx. 1 mm-0.1 mm. The electronic states of the
molecule have higher energies, the distances between adjacent
energy levels of valence electrons are several electron volts,
and the respective spectra are in the visible and ultraviolet
regions. It is the excited electronic states that are important
for the formation of scintillations; these are mostly excitations
and deexcitation of electrons forming interatomic bonds in the
aromatic molecule (p -electrons).
A molecule in
an excited electronic state can lose energy and return to its
ground state in various ways (if this energy is too high, the
molecule may even dissociate and disappear). One possibility is
simply a direct transition to the ground state with the emission
of one photon (if the excitation occurred by irradiation with
light, the emitted photon has the same energy as the absorbed
photon). Another possibility is fluorescence: a
molecule can give off part of its vibrational energy in
collisions with other molecules, so that the radiant transition
occurs from a lower sub-level of the electronic state
(fluorescent radiation has a lower frequency than the radiation
originally absorbed). Radiant transitions between some levels are
"forbidden" by selection rules, so such transitions
occur for a very long time - it arises phosphorescent
radiation, which can be emitted for minutes or even
hours after the molecules have been excited. Many transitions
during collisions lead to non- radiative energy
transfer. In general, however, the electron transitions are
accompanied by radiation in the visible or ultraviolet part of
the spectrum, with each transition having a fine
structure - appearing as a series of closely spaced
lines due to the presence of different rotational and vibrational
states in each electronic state.
Thus, when
energy is absorbed, the molecules transition from the ground
state to a higher energy level, from which the molecule returns
to the ground state by radiating thermal energy and the
fluorescent quantum - Fig.2.4.7 on the right (again, only the luminescent deexcitation of the
scintillator molecule is marked there).
Fluorescence molecules appear mainly in aromatic hydrocarbon
molecules with double or multiple benzene nuclei (specific
species will be mentioned below).
Different
formation of scintillation in inorganic and organic scintillators
It is appropriate to emphasize the different mechanism
of scintillation in organic and inorganic scintillators :
¨ In inorganic
scintillators, the scintillation effect is a property of a
suitably arranged crystal lattice with
luminescent centers - they are always solid -based
detectors. When the inorganic detection substance is dissolved
(eg in water), the crystal lattice decompose and the
scintillation effect disappears.
¨ In organic
scintillators, the scintillation is formed by deexcitation of its
own molecules of suitable organic compounds. When
dissolving such a scintillator in a suitable organic solvent, the
organic molecules remain unchanged and the scintillation effect
is usually preserved - a liquid
scintillator is formed (the
properties of liquid scintillators and their use will be
discussed in more detail below in §2.6, section "Detection of beta radiation by liquid
scintillators") .
Properties
of scintillators
We will now introduce some physical parameters
that can characterize scintillation materials and which are
important for their practical applications.
¨ Conversion
efficiency
The basic parameter of the scintillation material is the conversion
efficiency, which is the ratio of [%] of the total
energy of the emitted light and the absorbed energy of the
primary incoming quantum of ionizing radiation. In practice, more
often than the conversion efficiency is used so-called light
yield, given as the number of emitted light photons per
1 MeV of absorbed energy of the detected quantum of primary
radiation.
¨ Luminescence
spectrum
describes the spectral composition (wavelengths) of the emitted
light. It is important to align this luminescence spectrum with
the maximum spectral sensitivity of the photocathode,
which in most photomultipliers is in the blue region of the
spectrum about 600-700nm.
¨ Scintillation
afterglow
Another important characteristic, describing the
temporal properties, is the duration of scintillation,
or so-called scintillation afterglow - the time
during which the scintillation photon flux drops to 1/e. This
parameter co-determines the speed of the whole scintillation
detection process - the dead time of the
detector and the time resolution when coincidently
using two or more scintillation detectors.
¨ Density
and the proton (atomic) number of the scintillation material is
particularly important for the detection of gamma
radiation. It determines the degree of absorption
of radiation g in the scintillator and thus the resulting detection
efficiency. For light materials, most of the g- radiation passes
through without absorption by the photoeffect (or multiple
Compton scattering). Scintillators with a density of about 3-9
g/cm3 are
suitable for the effective detection of especially harder
radiation g (with energies of hundreds of keV up to MeV units).
¨ Mechanical,
chemical and optical properties
of scintillator material are important for practical
implementation and construction of scintillation detectors. Of
particular importance is how big single crystals
can be grown from a given material, while maintaining good
homogeneity and optical transparency (see next point). This is
especially crucial for applications in scintillation cameras (see §4.2 "Scintillation
cameras").
Some scintillation materials, especially NaI(Tl), are hygroscopic,
so they must be hermetically encapsulated. Some larger inorganic
single crystals can be quite brittle, so they
need to be protected from mechanical pressure and also from
larger temperature gradients (different
thermal expansion can cause mechanical stress inside the crystal
and lead to its cracking). For organic
scintillators is important solubility
in organic solvents and other chemical properties, important for
the application of liquid scintillators (see
below).
¨ Energy
resolution
characterized by the ability to distinguish two photons of gamma
radiation with close energy values. The resulting resolution
depends on several factors, discussed above in the "Scintillation Spectrum"
section. The internal resolution of a
scintillation crystal depends on the light yield of the
scintillator and the nonlinearity of the scintillation response
for different electron energies. Furthermore, also on the perfect
optical transparency of the scintillation
material - so that, if possible, the same percentage of
scintillation photons, regardless of the scintillation site, can
fall on the photocathode of the photomultiplier.
Scintillation
materials
There are a number of substances that exhibit scintillation
properties. It can even be said, that almost every optically
transparent substance, when interacting with ionizing radiation,
emits a certain amount of photons of visible light; but the light
yield is usually small, the wavelength of this light may not
correspond to the spectral sensitivity of the photomultiplier
photocathode and scintillation time may not be short enough.
Therefore, only substances that have optimized
these properties, are designated as true scintillators.
Inorganic scintillators
First we will mention inorganic scintillation
materials. As already mentioned, the longest known scintillator
is zinc sulfide activated by silver atoms
ZnS(Ag). However, the most used inorganic scintillator is a
crystal :
¨ NaI (Tl) - sodium iodide, activated
with 1-2% thallium. It is suitable for the detection of low and
medium energies of gamma radiation (see the
curve of energy dependence of the detection efficiency in the
right part of Fig.2.4.6). Its disadvantage
is that it is hygroscopic. It must therefore be
mounted in airtight housings with a glass outlet window, the
inner walls of the housing are provided with a reflective coating
such as magnesium oxide to increase the light yield. If the case
is not perfectly hermetic, the crystal absorbs moisture from the
air, it is hydrolyzed (manifested by yellowing -
dissociation of NaI), loses perfect transparency, deteriorates
energy resolution and conversion efficiency (Fig.2.4.8 b, c) :
Hygro.gif)
Fig.2.4.8. Influence of encapsulation hermeticity on NaI(Tl)
scintillator properties.
a) Perfectly hermetic encapsulation of the
crystal ensures its long-term transparency and good spectrometric
properties.
b) The NaI(T1 ) crystal,
yellowed due to imperfect hermeticity, shows impaired resolution
and reduced conversion and detection efficiency.
c) A more serious violation of the hermeticity
leads to a browning of the NaI(Tl) crystal, which not only
completely loses its spectrometric properties,
but to a large extent also loses its simple detection properties!
Note: All three scintillation detectors
have the same dimensions (diameter 45 mm, height 25 mm) and their
age from production is 43 years.
For the detection of higher energies of gamma
radiation, scintillators with a higher density are more suitable
from the point of view of detection efficiency :
¨ Bi4 Ge3 O12 (bismuth-germanium oxide, abbreviated BGO
);
¨ Lu2 SiO5 (: Ce) (cerium-activated lutetium
orthosilicate - LSO );
¨ Lu1.9 Y0.1 SiO5 (lutetium yttrium silicate LYSO );
¨ Y2 SiO5 (: Ce) (cerium-activated yttrium
orthosilicate - YSO);
¨ Gd2 SiO5 (: Ce) (cerium activated gadolinium
orthosilicate - GdSO);
¨ further LuAlO3 (Ce) (LAO).
¨Based on LSO, the LFS (Lutetium
Fine Silicate) scintillator was further developed, which has
a finer crystal structure and, in addition to basic
lutetium, silicon and oxygen (LSO) with doping Ce, also contains
carefully tested small impurities of some other elements such as
Ca, Gd, Sc, Y, La, Eu, or Tb. Depending on the type and content
of alloying elements, there are several types of numbered LSF
scintillators, such as LFS-3. This results in slightly better
energy resolution and shorter scintillation afterglow.
These high-density scintillators are mainly used for the
detection of 511keV energy annihilation e- e+ gamma
radiation in positron emission tomography (PET)
cameras, where it is necessary to achieve high detection
efficiency with not too large crystal thickness (in order to achieve high spatial resolution of
scintillation localization by a system of photomultipliers) - see §4.3 "Tomographic cameras", section
"PET cameras".
¨ The heaviest scintillators, such as PbWO4, are
used as part of complex detection systems that register high-energy
radiation
from the targets of large accelerators of elementary particles (eg the new "Large Hadron Collider" at CERN
uses almost 80,000 PbWO4 crystals in the detection part) -
see §1.5 "Elementary particles", section "Charged particle accelerators".
For some special
purposes, such as the detection of harder X-rays in CT, other
scintillation materials such as Lu1.9Y0.1SiO5 (LYSO), CdWO4 are used .
Scintillators based on ceramic materials (silicon oxides), doped
with rare earths (such as gadolinium or yttrium) and possibly and
other elements, sometimes referred to as UFC
(Ultra Fast Ceramic) - ultra-fast ceramic
detectors. Scintillation flashes are detected by either
photomultipliers or phototransistors
(significantly simpler and cheaper phototransistors or
photodiodes are sufficient if it is only a simple detection, not
spectrometry; another advantage is the miniature size) - see
§3.2 "X-ray diagnostics", section "Transmission X-ray tmography (CT)". The use of so-called silicon semiconductor
photomultipliers described above is promising (section
"Photomultipliers", Fig.2.4.2g ).
The following table lists several
inorganic scintillation materials used in scintillation
detectors. They are sorted by increasing density (which increases
the detection efficiency for higher energy gamma radiation) :
| Scintillator: |
NaI
(Tl) |
CsI
??(Tl) |
Y 2 SiO 5 (Ce) |
BaF 2 |
LaBr
3 (Ce) |
Gd 2 SiO 5 (Ce) |
Bi 4 Ge 3 O 12 |
Lu 2 SiO 5 (Ce) |
CdWO4 |
PbWO4 |
| Density [g/cm3] |
3.67 |
4.51 |
4.53 |
4.89 |
5.1 |
6.71 |
7.13 |
7.41 |
7.9 |
8.23 |
| l max [
nm ] |
415 |
400/565 |
420 |
220/310 |
360 |
440 |
480 |
420 |
470/540 |
410/500 |
| scint. afterglow [ms] |
0.23 |
0.6 / 3.4 |
0.07 |
0.008 |
0.016 |
0.06 |
0.3 |
0.04 |
20/5 |
|
| h [photon/MeV] |
4.104 |
5.104 |
4.6.104 |
1.8.103 |
6.3.104 |
1.104 |
8.103 |
3.104 |
5.103 |
3.102 |
Note: In terms of
spectrometric properties, it is worth noting the
lanthanum bromide crystal doped with cerium LaBr3(:Ce 5%), which thanks
to its high light yield of 63000 photons/MeV and good energy
proportionality, in the scintillation detector provides
very good energy resolution (approx. 4% at 137-Cs). It
also has a very short scintillation afterglow of
16ns, which makes it promising for the coincidence detection of
annihilation photons in PET positron emission tomography
(§4.3 "PET cameras", TOF analysis).
Internal radioactivity
of LSO scintillators
A certain disadvantage of lutetium -based
scintillators (such as LSO or LYSO) is their relatively high
background due to the internal radioactivity
contained in the scintillator. In addition to the basic stable
isotope 175Lu
(97.4%), natural lutetium also contains an irremovable
admixture of the long-term radioisotope
176Lu
(2.6% - a natural radionuclide of primary
origin), which decays with a half-life of
3.8.1010 years b-
converted to a stable hafnium 176Hf, emitting beta radiation with max energy Ebmax = 596 keV (99.6%) and a prompt cascade of gamma
radiation with energies Eg
88keV (15%), 202 keV (78%), 307keV
(94%) and 401keV (0.4%) - see §1.4, passage "Lutetium".
The mass specific activity of 176Lu in the LSO
material is about 39 Bq/1gram LSO *) and the resulting internal
radiation background (due to the 100% efficiency of internal
detection) reaches values of about 250 imp./s./cm3
LSO; medium large scintillation detector 100cm3 of the LSO would
therefore have an internal radiation background of about 25,000
imp./s.! Therefore, LSO scintillators are not suitable for
measuring weak radiation fluxes and low activities. However, when
used in medical positron tomography PET, for which they are
primarily intended, this disadvantage does not apply in practice.
On the one hand, coincidence measurements are performed, and on
the other hand, the internal background of LSO/LYSO scintillators
is negligibly small compared to the fluxes of the measured
annihilation radiation of about 106 photons/s in clinical scintigraphy. However, certain
problems may arise in experimental studies of PET with low
activities and long measurement times (animal PET) - it is
discussed in more detail in §4.3 "Tomographic
cameras", section "PET cameras".
*) Mass specific activity can be
determined using the formula derived in §1.2. "General laws of atomic nucleus transformation", passage "Relationship between half-life
and activity": A1g @ (6.1023 /N).ln2/T1/2 @ 4.16.1023/ (N.T1/2). Substituting the mass number N and half-life T1/2 [s] for 176Lu is 51.23 Bq /1 g
of pure 176Lu
and after conversion to a content of 2.6% 176Lu in lutetium and a lutetium content of 76% in LSO we
get a final value of about 39 Bq /1 gram
LSO.
Just a small interesting thing is that the
above-mentioned lanthanum bromide LaBr3 (: Ce) scintillator
has also an internal natural radioactivity: natural lanthanum, in
addition to the stable basic isotope 139La, also
contains 0.09% of the long- lived radioisotope 138La,
which is converted to barium-138 by electron capture (70%) with a
half-life of 1.12.1011 years, or b- radioactivity (30%) at cer-138; it is accompanied by
the emission of gamma photons 1426 and 790 keV. However, the
volume specific activity here is only about 1 Bq/cm3
LaBr3.
How did lutetium 176Lu form?
The answer is given by nuclear astrophysics - a
fascinating scenario of cosmic nucleogenesis (see "Cosmic alchemy" or "We
are the descendants of the stars!"). 176Lu was nuclear- synthetized, along with a stable 175Lu and all the
heavier elements, more than 5 bilion years ago during a
supernova explosion, the ejected gases of which formed
the solar system, including the planet Earth ...
Organic scintillators
There are also a number of organic
substances that have scintillation properties (see Fig.2.4.7 on the right for the mechanism). It is mainly naphthalene, which emits
scintillation radiation with a very short flash time of 0.08 ms and a wavelength
of around 345 nm (this wavelength is
shorter compared to the maximum spectral sensitivity of the
photocathodes of most photomultipliers, so a "spectrum
shifter" is sometimes used - see § 2.6). An important organic scintillator is anthracene,
which is used as a standard to compare the properties of all
other organic scintillators. Anthracene emits scintillation with
a flash time of 0.03 ms and wavelength of 450 nm, its conversion efficiency is
about half that of NaI(Tl). Other organic substances include stilbene,
which emits scintillation with a duration of 0.08 ms and a wavelength
of 380-410 nm; its advantage is the ability to form large
crystals. Organic scintillators have too low a density to detect
gamma radiation, so the detection efficiency would be low.
However, they are very suitable for the detection of beta
electrons, alpha particles, protons, deuterons and also fast
neutrons (neutrons eject protons from the molecules of organic
matter, which cause scintillation and are thus registered).
Organic scintillants usually retain
their scintillation properties even when dissolved in suitable organic solvents *) (toluene, xylene,
benzene, dioxane, phenylcyclohexane, phenyl ether, etc.) - liquid
scintillators are formed. Liquid scintillators have the
advantage that they can be adjusted to a suitable shape even by a
simple filling into a suitable container, even to a size which is
not achievable with solid (crystalline) scintillators; they are
therefore used, for example, in the detection of cosmic rays.
However, the main use of liquid scintillators is in the method of
detecting beta emitters directly in solution
with these scintillators (§2.6, section
"Liquid
scintillators"). The use of organic and liquid scintillators will be
described below in §2.6 in connection with the beta and alpha detection
methodology.
*) This is due to the mechanism of
scintillation formation (which was outlined above - Fig.2.4.7).
In inorganic scintillation crystals, where scintillations occur
during deexcitation of energy levels in the luminescent centers
of the crystal lattice, when the scintillator
dissolves, the crystal lattice disappears and the scintillation
effect also disappears. In contrast, in organic scintillators,
where scintillation occurs during excitations and deexcitation of
the energy levels of the molecules themselves of organic
substance, the scintillation effect persists
even after the scintillator is dissolved.
Cherenkov detectors
In addition to the scintillation mechanisms described above,
there is another process of light formation during the
interaction of ionizing radiation with matter: Cherenkov
radiation. As stated in §1.6 "Ionizing radiation",
the passage "Cherenkov radiation", a charged particle that flies through an
optically transparent medium with a refractive index n at
a speed higher than the speed of light c' = c/n in this medium,
produces "shock" electromagnetic waves - visible light
called Cherenkov radiation. The physical mechanism of this
radiation was clarified in the mentioned §1.6, passage "Cherenkov radiation", where the table also shows the threshold
energies for the generation of this radiation for different types
of particles in different media environments. This radiation can
be used to detect charged high-energy particles,
event. also hard gamma radiation (which ejects
fast electrons when interacting with matter).
The Cherenkov
detector, in its simplest configuration, consists of a transparent
dielectric with a high refractive index (eg plexiglass),
in which the fast-flying charged particles excite Cherenkov
radiation, which impinges on the photocathode of photomultiplier,
where it is converted into electrical impulses,
similar to scintillation detectors. Different sizes and shapes of
dielectric are used, the detection medium is sometimes liquid (eg
water) or air, lens or mirror optical systems are sometimes used
to concentrate Cherenkov radiation on the photocathode of one or
more photomultipliers. Since the number of emitted photons and
the angle of the direction of their emission with respect to the
direction of motion of the primary particle depend on its energy
(superluminal velocity), the energy of the detected charged
particle and the direction of its motion can be determined.
When detecting Cherenkov radiation,
the problem of a small number of emerging photons
is encountered. According to the relations given in §1.6, the
passage "Cherenkov
radiation", about 200
photons per centimeter of ultrarelativistic electron trajectory
are produced in water, under less optimal conditions it is less.
Therefore, high demands are placed on the properties of
photomultipliers - high quantum efficiency of the photocathode
for the spectral range of Cherenkov radiation, low noise, good
optical contact of the photomultiplier with the environment, as
well as low absorption of radiation in the environment. This
problematics is somewhat similar to the detection of low energy b -radiation of
tritium 3H
in liquid scintillators (see below §2.6
passage "Liquid scintillators").
The
ring imaging Cherenkov detectors - RICH
For special purposes of directional detection of high-energy
particles, more complex detection systems have been developed,
using the properties of Cherenkov radiation. They are called RICH
(Ring Imaging Chrenkov detector). They consist of a
system of mirrors (spherical and planar) that
reflect light photons of Cherenkov radiation, created along the
path of a particle in an optical medium (eg CF4, C4F10
, ....), and direct them to a system
of a large number of imaging photomultipliers.
Electronic analysis of impulses from these photomultipliers can
reconstruct the trajectory of the particle and determine its
energy. The device therefore works as imaging
detector-spectrometer of fast charged particles.
Cherenkov detectors have their main
use for the detection of high-energy particles -
they are used in large accelerators and in the detection of
cosmic radiation (see also the passage
"Neutrinos - "ghosts"
between particles" in
§1.2 "Radioactivity"
or "Cosmic radiation" in §1.6).
2.5.
Semiconductor detectors
By the mechanism of direct
electrical use of ionizing radiation effects, the semiconductor
detector is somewhat similar in principle to the
ionization chamber, wherein the sensitive medium is of course not
gas, but a suitable semiconductor material. From an electronic
point of view, the semiconductor detector is basically a diode
connected in a high voltage electrical circuit (approx. 1000-2000
V) via a large ohmic resistor in the closing
(non-conductive) direction (Fig.2.5.1), so that no current flows
through the circuit at rest.
Fig.2.5.1. Diagram of a semiconductor
detector. On the right is an example comparing the semiconductor
spectrum of gamma radiation with the scintillation spectrum.
If a quantum of ionizing radiation enters the
active layer of the detector (it is a "depleted" layer
or volume region without free charge carriers), the ionizing
energy causes in the semiconductor to jump a proportionate number
of electrons into the conductive band and form electron-hole
pairs. These electrons immediately start moving in the
electric field to the positive electrode (and the holes to the
negative) - a short current pulse passes through
the electric circuit, a voltage drop occurs on the working
resistor R and through the capacitor C the electric
pulse leads to a charge-sensitive preamplifier.
The amplitude (or time integral) of the pulse at the output of
the amplifier is directly proportional to the total charge
colected, and thus the energy of the detected radiation (more
precisely, the energy that was absorbed when the quantum of
radiation passed through the active detector layer). Thus, by
amplitude analysis of the output pulses, we can perform
a spectrometric analysis of the energy of the
detected radiation, similarly to scintillation detectors. The
amplified pulses are fed to an analog-to-digital
converter and from there to the memory of a "multichannel
analyzer", now realized in a computer, in the
memory of which the resulting spectrum is stored.
Semiconductor g radiation detectors have a very
good energy resolution (usually better than 1 keV), about 30 times better than
scintillation detectors - see comparison of spectra in Fig.2.5.1
on the right. Two basic factors in particular contribute to this
:
1. The collection of the charge
created in the semiconductor by ionization is relatively perfect
from the entire sensitive volume.
2. The small width of the band gap
leads to the low energy required to form one electron-hole pair.
The number of these charge pairs generated by the detection of a
quantum of a given energy is therefore high (more
than 10 times higher than with gas or scintillation detectors) and thus the relative quantum-statistical fluctuations
in their number are low.
Semiconductor detectors also have a
high ratio of photopeak to continuous Compton background.
However, compared to scintillation detectors, they usually have
somewhat lower detection efficiency for gamma
radiation and also longer dead time (dead time is given by the capacity of the detector +
preamplifier system and the value of the working resistance). Semiconductor detectors are used wherever we need the
best possible energy resolution, eg in nuclear physics, neutron
activation analysis, X-ray fluorescence analysis, detection of
radionuclides in ecology or measurement of radionuclide purity of
preparations. Otherwise, all the principles and principles of gamma-ray
spectrometry (§2.4, section
"Scintillation spectrum"), including energy and
efficiency calibration, which have been discussed in the
scintillation detector, also apply also to the semiconductor
detector.
In some applications, the great
advantage of semiconductor detectors is their independence
from the magnetic field (unlike
photomultipliers used in scintillation detectors).
Differences in
scintillation and semiconductor gamma spectra
If we look at the example of gamma spectrum in Fig.2.5.1 on the
right (enlarged section from the spectrum
of radionuclide 123I), we can see at first glance two
significant differences between the spectra
measured by scintillation and semiconductor detector :
¨ The photo peaks on the scintillation
spectrum are round and gradual, as if
"blured" - the energy resolution is relatively
imperfect here (approx. 10% for the 662keV
test line 137Cs), the nearby gamma lines merge
into one wider photopeak. The semiconductor
spectrum, on the other hand, consists of very sharp and
narrow peaks - the energy resolution is about 30 times
better. Some compact ("overlapped")
peaks of scintillation spectra on a
semiconductor spectrum are decomposed in two or several discrete g-lines (Fig.2.5.1 right) ...
¨
In the scintillation spectrum is seen
distinctly represented continuous component of
Compton scattered radiation, especially in lower energy areas.
This continuous background is disturbing (especially
in the "peak" area of the backscatter, which can
interfere with the actual gamma peak of the measured
radionuclide). In semiconductor
spectra, the continuous component is strongly suppressed
because better energy resolution leads to narrow and high
peaks (while maintaining the same
area under the peak , which automatically
leads to a reduction in the relative height of the continuous
background in the spectrum - graphical drawing of the spectrum is
normalized to the top of peak.
Germanium and silicon semiconductor detectors
Semiconductor detectors are mostly
made of germanium single crystals, either with a
trace amount of lithium, so-called drift - Ge(Li)
detectors, or more recently of superpure germanium HPGe (High Purity Ge), or
from silicon Si *). Germanium detectors are constructed either in a coaxial
arrangement of n-i-p layers (for the detection of higher gamma
energies) or in a planar shape with a thin input window
(for the detection of soft gamma and X). Silicon detectors Si(Li)
are mainly intended for the detection of soft gamma and X
radiation with high resolution, planar shape, often a
beryllium input window with low absorption of soft gamma and X
radiation is used.
*) Other semiconductor materials are also used, such as Ga(As),
Cd (Te), .... For the detection of gamma and X-rays, detectors
based on CdZnTe (CZT) are also used, which have a high detection
efficiency for photons of energy of tens of keV and work even at
room temperatures, see below.
Upon absorption of a gamma photon of
energy 1MeV in germanium HPGe, approximately 3x10⁵ electron-hole pairs
is formed. Compared to silicon, germanium is more effective for
detection than silicon because its atomic number is much larger.
The average energy for electron-hole pair formation is 2.9 eV for
silicon and 3.6 eV for germanium. Due to its higher atomic
number, germanium has a significantly higher absorption
coefficient for gamma radiation, so it is suitable for the
detection of gamma radiation of higher energies up to several
MeV. Silicon detectors with a thickness of several millimeters,
on the other hand, are suitable for low energy spectrometry of
gamma and X photons, keV units, with high resolution.
Scintillation and semiconductor detector when used in
gamma-spectrometry of radionuclides.
Left: Scintillation probe - a
scintillation crystal NaI(Tl) + photomultiplier, with shielding. Middle:
Analog-to-digital converter (ADC) and computerized (CPU)
multichannel analyzer. Right:
Semiconductor Ge(Li) / HPGe detector with preamplifier and Dewar
vessel with cooling liquid nitrogen.
Semiconductor spectrometric detectors usually
need to be cooled to liquid nitrogen (LN2 - Liquid Nitrogen) *) to function
properly to reduce the closing current and electronic noise. In
low-energy detectors, also the preamplifier is often cooled, the
input element (field-effect transistor) of which is located in the cryostat together with the
detector in order to minimize the preamplifier noise. For some
new types of semiconductor spectrometers with HPGe,
it is no longer necessary to use liquid nitrogen added to the
Dewar for cooling, as an electronic cooling system
is used, working on the basis of Joule-Thomson expansion of
compressed gas (in addition to nitrogen, helium or other suitable
cryogenic gases are also used), with a miniaturized compressor
with a Stirling cycle and possibly also with Peltier
thermocouple.
*) Ge(Li) detectors even have to be cooled
permanently also during storage; interruption of cooling
leads to diffusion of Li drift and destruction of the detector!
The advantage of detectors made of very pure germanium HPGe is
the possibility of thermal cycling - during the
measurement it is cooled to the temperature of liquid nitrogen,
but they can be stored at room temperature.
However, semiconductor detectors
have been developed that operate at room temperature,
using semiconductors with a large bandwidth, such as alloys of
two (GaAs, CdTe, InP) or
three (CdZnTe, InAlP) different
semiconductor materials. Although these detectors do not achieve
such a perfect energy resolution, they have a higher detection
efficiency against photon radiation (see CZT
detectors below).
Semiconductor detectors with a surface
barrier are used to detect corpuscular radiation (alpha,
beta, protons - see below), which has a short range in
substances. They are designed so that a very thin metal layer of
eg gold (thickness of only a few atoms - less than 1 micrometer)
is applied to the front side of the polished silicon wafer of the
"n" type semiconductor, which serves both as an
electrode and an input window of the detector; the back wall is
nickel-plated and serves as the second electrode. A voltage of
approx. 100-200V is connected to such a detection diode with a
p-n junction via a working resistor, pulses generated by particle
detection are taken from the working resistor for amplification
and further processing.
Diamond
detectors
Crystalline carbon - diamond can also serve as a
suitable material for electronic detection of low-energy
radiation. Here, the carbon atoms are bonded to each other by a
strong covalent bond and are arranged in a cubic crystal lattice.
The width of the band gap is 5.45 eV. Pure diamond is
electrically non-conductive (dielectric, high resistivity »1016 W cm). A small amount of defects or dirt causes the
diamond to discolor; such a diamond also behaves like a
semiconductor. Diamond detectors are somewhat similar to silicon
detectors.
The diamond crystal is placed
between two electrodes to which voltage is applied - the
connection is the same as in Fig.2.5.1. An ionizing particle or
photon of electromagnetic radiation releases electrons (and
positive ions - "holes") in the crystal lattice upon
their impact and passage, which move under the influence of an
electric field in the conduction band in the crystal and cause an
electric impulse at the electrodes. The principle is very similar
to a classic gas ionization chamber - a diamond detector is a
kind of "solid ionization chamber".
As with other semiconductor
detectors, diamond detectors can be made either as single single
crystals or as layers formed by chemical Vapor
Deposition technology (CVD, lat.. vapor = steam ).
With this CVD technology, even more complex structures of a
larger number of detection elements can be created - multi
-detector systems or polycrystalline active surfaces in the strip-detector
mode.
Diamond detectors have some advantageous properties :
× Mechanical resistance and good thermal
conductivity.
× Insensitivity to visible light (they are
sensitive only from harder UV radiation).
× They work at room temperature, no
cooling is required.
× High
signal-to-noise ratio.
× Fast
signal response. Diamond detectors are very fast, have a time
resolution in the order of tens of picoseconds. They are able to
work even at high intensity particle flow. They are therefore
used as internal "trigger" detectors, which
define the exact moment of interaction in complex detection
systems at accelerators ("Arrangement and configuration of radiation detectors").
× High
radiation resistance to damage in strong radiation beams.
They are used, or are promising, in a number of areas :
- detection
of high energy particles, detection of neutrons and a-particles;
- monitoring
and dosimetry of photon and particle beams for radiotherapy;
-
measurements on cyclotrons and synchrotrons;
- trackers
for complex detection systems examining the interactions of high
- energy particles in accelerators ("Arrangement and configuration of radiation detectors").
Cadmium-Zinc-Teluride (CZT)
detectors
Spectrometric germanium and silicon semiconductor detectors
provide excellent energy resolution, so they play an
irreplaceable role in the precise analysis of gamma radiation
from natural samples and laboratory preparations. However, their
technical disadvantage is the need to cool
to liquid nitrogen temperature. This is a serious, often
insurmountable, obstacle in many laboratory and
all practical technical applications of radiation. Therefore,
there is a need to develop semiconductor detectors that have at
least "slightly good" spectrometric properties, but
could operate at the usual room temperature (in the laboratory, natural terrain).
From this point of view, some
compounds of tellurium (tellurides)
with metals such as zinc and cadmium (used in photovoltaic cells of solar panels) have proved successful. For detection and gamma
spectrometry is used in particular cadmium telluride and zinc
CZT (Cadmium -Zinc-Tellurium) - Cdx Zn(1-x)Te in different
ratios, usually x = 0.1-0.15. Sometimes small admixtures of other
elements are added to improve the crystalline-electrical
properties of the alloy (usually 0.05-0.07
selenium).
This alloy acts as a semiconductor
detector operating at room temperature,
which converts gamma and X radiation into electrical impulses
with high efficiency. Semiconductor CZT detectors can in most
applications serve as a (better) replacement for
conventional scintillation NaI(Tl) detectors, with significantly
smaller dimensions.
The comparison of the basic parameters of the semiconductor
detectors HPGe, CZT and scintillation detector NaI(Tl) is in the
table (approximate practical - average,
typical - values are given) :
| Detector type |
Energy resolution
(FWHM at 662keV 137Cs) |
Density |
Detection efficiency |
Pulse reverberation time |
Max.
pulse frequency / s . |
| HPGe |
1.4 keV (0.2%) |
5.32 g / cm 3 |
% |
... [ns] |
1.5 . 10 5 cps |
| CZT |
33 keV ( 5% ) |
5.82 g / cm 3 |
|
... |
2 . 10 6
cps |
| NaI (Tl) |
55 keV (8%) |
3.67 g / cm 3 |
|
230 ns |
2 . 10 5
cps |
Compared to spectrometric germanium GeHP
detectors, CZT detectors have poorer energy resolution (which is sufficient for many
applications), but higher detection
efficiency and shorter dead time.
Semiconductor CZT detectors are
often mounted on printed circuit boards, which on the opposite
side have connected integrated circuits containing amplifiers,
analyzers and other electronics for processing the detected
pulses. This creates miniaturized compact integrated modules - detection
blocks (analogous to scintiblocks), which can be fitted to more complex detection systems.
The use of suitably arranged pixel CZT detectors for semiconductor
gammagraphy is particularly interesting and beneficial (planar and SPECT "scintigraphy" - §4.2, part
"Alternative physical principles of scintillation
cameras", passage "Semiconductor multidetector gamma cameras").
Multidetector semiconductor systems
Advantageous electro-mechanical properties of semiconductor
detectors enable their miniaturization and
integration of individual semiconductor elements into multidetector
systems. These multidetector systems can provide
information both on the energy of the registered
radiation and on the point of impact of the
individual ionizing quanta, or on the paths of the flying
particles - they can therefore have imaging properties.
The most commonly used semiconductor multidetector systems are of
three types :
¨ Array of semiconductor detectors arranged on a suitable surface, usually at regular
intervals. Allows by a single measurement chart e.g. geometric
progression of the intensity of radiation beams (........
¨ Pixel semiconductor detectors (SPD - Semiconductor Pixel Detector). On a
thin semiconductor wafer (most often silicon, type N) electrodes
(P) are applied, which in the form of an output electrical signal
dissipate the charge created by the passage of an ionizing
particle. The electrodes are distributed in a dense regular grid,
forming cells - pixels - with dimensions of a
few micrometers to tenths of a mm. Electronic circuitry for
evaluation can also be integrated on the board - preamplifiers,
discriminators, multiplexers, counters, analog-to-digital
converters (ADC - allow to evaluate the energy of particles
absorbed in individual pixels). By processing the pulses from
such a detector, we get a planar image of the
distribution of the positions of the incoming particles and
possibly also their energies. Such imaging detectors are used,
among others, in radiography, especially X-rays
- so-called flat panels with direct conversion,
§3.2, part "Electronic X-ray imaging". Detectors of this type are also beginning to be
used in gamma cameras of nuclear medicine -
§4.2, part "Alternative physical principles scintillation camera" passage "Semiconductor multidetector gamma
camera".
Pixel detectors can be spatially
stacked in many layers, in blocks or other
units, allowing spatial display tracks the
passing particles - this is called tracker
(tracking of path of particles). Systems of these detectors are
used in complex analyzers of high energy particle
interactions, the typical arrangement of which is given
above in §2.1, section "Arrangement and configuration of
radiation detectors",
Fig.2.1.3 below - forms the innermost part of the detection
system, the tracker.
A simpler variant of the
position-sensitive semiconductor detectors are called strip
detectors (tape-strip-shaped), which also consist in
systems constituting trackers ...
¨ Semiconductor Drift detectors (SDD)
On the surface of the N-type silicon
wafer with a high resistivity, regions P are implanted,
forming P-N transitions. Anodes are placed on the edge of the
plate, collecting charge from the detector. During the passage of
the ionizing particle, electron-hole pairs are released, after
which the electrons are moved in a drift motion to the region of
the anodes, where they are captured and generate an output
electrical signal. If we know the rate of electron diffusion, we
can determine the position of the place where the particle flew
through the detector from the time of the pulse at the anode
(from the time of the drift motion).
LBSD detectors
A uniquely used type of semiconductor detector is the so-called long
base silicon diodes (LBSD - Long Base Silicon Diode),
designed to measure the radiation dose (kerma) from heavy
particles, especially fast neutrons. As a result of irradiation
and ionization, the crystal lattice of silicon is damaged, which
changes the lifetime of the minor charge carriers and thus the
conductivity of the diode. The voltage drop across the diode is
measured in the forward direction before and after irradiation,
the change in voltage drop after irradiation relative to the
initial value being an approximately linear function of the
radiation dose (kerma).
Microcalorimetric detectors
During the interactions of radiation with a substance, a certain
part of its energy is converted into heat (the thermal effects of radiation have already been
mentioned in §1.2 "Radioactivity" and in §1.6 "Ionizing radiation", section "Thermal and electrical
effects of radiation). Based
on this fenomenon, detectors were developed that use the thermal
effects of energy transferred to the substance at absorb
quantum radiation. These detectors can to some extent be
classified as semiconductor detectors, either in terms
of the primary sensor, or for semiconductor technology used in
the electronic processing of measured signals. The methodology
for measuring physical quantities through heat is generally
called calorimetry; in a figurative sense, all
detectors measuring the energy of radiation quanta are sometimes
referred to as calorimeters.
Calorimeter (lat. Calor = heat )
is generally an arrangement or device that
in thermodynamics is used to measure heat
quantities based on heat exchange between test specimens
located in an insulated system, where the law of conservation of
heat-energy applies. Heat, temperature, heat capacity, heat of
reaction, heat conversion to other types of energy, etc. are
measured. For simple calorimeters, the temperature of the
examined environment is measured with a conventional mercury thermometer.
With modern calorimeters, the temperature is registered
electronically using thermistors - electronic
components whose resistance is strongly temperature dependent.
The so-called isothermal
calorimeters, operating at normal temperature, are
sometimes used for absolute measurement of the radioactivity of
high-activity preparations - bridge temperature thermistors are
used to compare the temperature difference between a reference
sample and a sample containing radioactive material (in which
radioactivity causes the material to heat).
Bolometer (from the Greek bole
= incident, beam )
is generally a device or element that
measures radiation based on its thermal
effects. These thermal effects are mostly measured thermoelectrically,
using the pyroelectric effect - the ability of some
materials to generate a temporary electrical potential when the
temperature changes. Depending on the heating, the electrical
resistance of the detector changes. The basic principle of the
bolometer is simple: the absorber converts the
radiation into heat and the thermistor converts
this heat into an electrical signal. In modern bolometers, the
absorber and the thermistor are usually combined into one element
- the detector.
The detector consists of a suitably
shaped thin metal strip or semiconductor or superconducting
material - thermoresistor, with electrical
outlets to the evaluation circuit. By absorbing the incident
radiation, the temperature increases and the resistance of the
thermoresistor changes, on the basis of which the evaluation
apparatus determines the amount of absorbed energy. Bolometers
are sensitive to radiation of any frequency, they respond to
different types of radiation.
An interesting special type of
microcalorimeter is the bolometer on the edge of
superconductivity TES (Transition
Edge Sensor). It uses a very steep course
("edges") of the dependence of the resistance of a
suitable material on the temperature around the phase transition
between normal conductivity and superconductivity (Fig.2.5.2 on
the right). The bolometer sensor itself consists of a small,
suitably shaped thin metal strip (eg a tungsten film several tens of nanometers thick,
deposited on a silicon substrate) -
Fig.2.5.2 on the left, cooled just below the
superconductivity temperature, so that its resistance is
practically zero. The impact of a quantum of radiation (photon)
slightly heats the tape material beyond the edge of the
superconductivity, thus transitioning to the normal conductivity
mode, the resistance rises sharply (Fig.2.5.2 on the right) and
in the electrical circuit it causes a fast voltage pulse, which
is amplified (Fig.2.5.2 in the middle) and registered in the
evaluation device. After detection, the sensor cools down quickly
to superconducting temperature and is ready to detect another
quantum. The current pulse in the bolometer
circuit (its integral value) is proportional to the change in
temperature and thus the energy absorbed of
detected quantum. Instead of a metal film, superconducting
nanofibers with a thickness of about 100 nm are
sometimes used in the TES bolometer.
 |
Fig.2.5.2. Highly sensitive bolometer
working on the edge of superconductivity TES (Transition Edge Sensor) - principle
diagram.
Left: Cooled superconducting
sensor. Middle: Electronic
signal acquisition. Right:
Steep curve dependence of TES resistance on temperature. |
In the most demanding applications, to achieve
the highest possible sensitivity, the signal in
the electrical circuit of the TES bolometer is sensed and
amplified first using the so-called SQUID
magnetic detector *), magnetically connected via a coil
L connected in the bolometer circuit (Fig.2.5.2 in the
middle). The magnetic flux F from the coil L sensitively modulates the current
through both branches of the SQUID ring. Only thus pre-amplified
signal is fed to a standard electronic amplifier and then to
evaluation.
*) SQUID ( superconducting
quantum interference device )
is a highly sensitive magnetometer used for
measuring very weak magnetic fields. Is based on Josephson
junction, in which an electric current passes between two
superconductors separated by a thin layer of insulator. This is
due to the quantum tunneling of electron Cooper
pairs across this seemingly impermeable barrier. The most
commonly used superconducting material is niobium, or an alloy of
lead with 10% gold or indium. The insulating layer is usually
made of aluminium oxide. Two types of SQUID elements are used in
low-current electronics :
- Radio frequency RF SQUID consists of one Josephson
junction connected to a superconducting ring. It is used in the
circuit of a high-frequency oscillator, where the measured
external magnetic flux modulates the frequency of the signal ...
- Direct current DC SQUID consists of two Josephson
junctions arranged in a superconducting ring. It is much more
sensitive to weak magnetic fields:
The highly sensitive quantum
magnetometer DC SQUID consists of a small superconducting
ring interrupted by two Josephson tunnel layers
(contacts). The input current I is divided into two
parallel branches in the ring. The wave properties of electrons
are manifested here. In the SQUID ring, the electron waves split
into two, passing through the tunnel effect through the
insulating layers, and then the two meet again. In the absence of
an external magnetic field, the two waves meet without a phase
difference. In the presence of a magnetic field, it will interact
with the electric current in the ring and a phase
difference will occurin the wave functions of the
electrons between the two tunnel transitions. The electrons will
show quantum interferences depending on the
strength of the magnetic field (magnetic flux F through the SQUID
ring). The current through the superconducting ring with tunnel
layers then very sensitively depends on the intensity of the
magnetic field (the electrical resistance of the DC SQUID shows a
response even to very small changes in the magnetic field). Using
a suitable electronic circuit (Fig.2.5.2 in the middle), this can
be used to detect very small changes in the magnetic field.
Small note: The current I through DC
SQUID is a periodic function of the magnitude of the magnetic
flux F (with
the period given by the elementary quantum of the magnetic flux F o= h /2e). However, for our purposes of detecting slight
changes in the magnetic field, this periodic course is not
important.
Cryogenic microcalorimeters
are bolometers made up of elements of a
suitable thermoelectric material that electronically register a
slight increase in temperature caused by the absorption of
quantum radiation in the material. The element then cools down
again and is ready to detect another quantum. The smaller the
working element of the microcalorimeter, the smaller its heat
capacity and the faster it is enough to cool to the initial
temperature - the shorter the dead detection time.
Microcalorimetric detectors are therefore formed by a larger
number of individual small bolometric elements -
microchips FET ( field-effect
transistor) or SET (single-electron tunneling transistor), or the above-mentioned highly sensitive TES
bolometers. The whole system is cooled by liquid
helium, additional active cooling to an operating temperature of
the order of 0.1 °K is achieved by the method of adiabatic
demagnetization (the most commonly
used paramagnetic magnetocaloric material are gadolinium
alloys).
The great advantage of microcalorimetric
bolometers is their extremely wide spectral
range sensitivity - in the electromagnetic field it
ranges from millimeter radio waves to high-energy gamma
radiation. It reacts similarly to particles of various energies.
Cryogenic microcalorimeters are used experimentally to detect
soft radiation b and X, and are used in some unique sensitive experiments
such as energy analysis of radiation b to determine the mass of
neutrinos (§1.1, part "Neutrinos"). Interesting is their use
in astronomy for measuring the intensity and
polarization of microwave relic radiation (see §5.4, passage "Microwave relic radiation - messenger of early
space news", in the
monograph "Gravity, black holes and space - time physics").
Scintillation
and semiconductor gamma-spectrometry
The basic criterion for the choice of scintillation or
semiconductor detection and spectrometry of gamma radiation is
the required detection efficiency and especially
energy resolution. Where an energy resolution of
about 10% is sufficient, scintillation spectrometry is more
advantageous, due to the somewhat higher detection efficiency.
For accurate energy measurement and resolution of nearby gamma
lines, spectrometry on a semiconductor detector with about 30
times better energy resolution, is required. These differences
can be seen in §1.4 "Radionuclides", section "The most important radionuclides", on a series of radionuclide spectra measured
simultaneously by a scintillation and semiconductor detector.
2.6.
Detection and spectrometry of a, b, protons and neutrons. Magnetic
spectrometers. Liquid scintillators.
Detection of charged
particles - alpha, beta, protons - radiation
Detection and spectrometry of alpha and beta radiation is more
difficult than with gamma radiation, because this radiation is
less penetrating, easy to absorb and difficult
to penetrate into the sensitive area of the detector. Detectors
for such radiation must have very thin entrance windows,
or are "windowless".
Otherwise, essentially the same
types of detectors as described above are used to detect charged
particles of corpuscular radiation. The simplest are ionization
chambers, G.-M. or proportional
detectors with appropriately adjusted thin windows (eg
mica), or flow ionization detectors (without
window). Scintillation detectors for radiation a and b are usually plastic
(high density is not required as for radiation g) with or without a
thin metal window (insulating against light) - such windowless
scintillation detectors must be operated in light-tight chambers.
Furthermore, the semiconductor detectors
described in the previous paragraph are used, for higher energies
Cherenkov detectors can also be used. The use of
liquid scintillators is very common and
effective, as described in more detail below in a separate
paragraph.
Detection and
Spectrometry of cosmic rays
Within this our category falls partly detection of cosmic
rays (see
§1.5, section "Cosmic radiation"), consisting primarily of high-energy protons,
particles a, heavier nuclei. Secondary cosmic radiation, created by
interactions in the atmosphere, also contains electrons +
positrons, muons, gamma radiation, often in large sprays.
However, the detection of cosmic radiation has some significant
specifics, so we have already discussed it in the treatise on
cosmic rays - §1.5, section "Detection and spectrometry of
cosmic radiation".
Magnetic spectrometers
The most advanced instruments for accurate measurement of the
energy of charged particles are magnetic spectrometers
*). The magnetic spectrometer is based on the force of a magnetic
field on moving charged particles. Permeating particles of charge
q moving with velocity v in the magnetic
field intensity (induction) B , it will be
(perpendicular to the direction of movement) to act Lorentz
force F = q. [v x B]
, causing bending the particle pathway. When
moving perpendicular to the direction of the homogeneous magnetic
field B , the charged particles are acted upon
by a radial Lorentz force, which is in equilibrium with the
centrifugal force: B.q.v = m.v2 /R. The particles will therefore move around the circle
of radius R = m.v /(q.B) = Ö(2Ev .m) / (q.B) wherein p = m.v is the momentum of the
particles, q charge and Ev= 1/2 m.v2 is the kinetic particle energy. By measuring the radius
R of curvature of the path of a particle of known mass and
charge in a magnetic field of a given intensity B,
we can determine the energy of the particle Ek . ...? ... give a formula for the relativistic case ...?
...
*) Electrostatic
spectrometers
For accurate radiation spectrometry of electrons b in the field of low
energies, the electrostatic spectrometers
based on the curvature of the particle path in an electric field
are sometimes advantageous; or combined spectrometers (e.g. an
electrostatic spectrometer with a magnetic collimation).
Spectrometer with a
transverse magnetic field
Magnetic spectrometer with transverse magnetic field is
formed by a strong electromagnet, between whose
pole pieces forming an almost homogeneous magnetic field *), a
vacuum measuring chamber is placed. Particles fly into the
chamber through the inlet orifice, move along a path curved in a
magnetic field and fall through another orifice onto the
detector, where they are registered by conversion into electrical
impulses - Fig.2.6.1. This detector does not have to have
spectrometric properties - the spectrometry is "taken care
of" by the magnetic field + geometric arrangement. Only good
detection efficiency is required for the analyzed charged
particles in a sufficiently wide range of energies.
*) Focusing: To achieve
better detection efficiency, or "luminosity" of the
spectrometer, special shapes of pole pieces are sometimes used,
creating in the main homogeneous magnetic field certain
additional gradients causing, by effect of a magnetic lens, to
focus an otherwise diverging beam of charged particles...
For a given geometric configuration
of the input window, apertures and detector and a certain
specific value of magnetic induction B, only
particles of a certain energy Ek = Efoc can fall into the detector, which is curved in the
magnetic field so that it "hits" the detector location
of position Rfoc. By increasing the excitation current I in
winding the electromagnet, we increase the magnetic induction B and thus the energy of the particles that selectively
impinge on the detector and are registered.
Fig.2.6.1. Schematic representation of the operation of a
magnetic spectrometer with a transverse magnetic field (left)
and a longitudinal magnetic field (middle).
On the right is the
use of a magnetic spectrometer for gamma radiation spectrometry.
Each value of current I through the coil
of the electromagnet thus corresponds to a certain energy Ek of charged particles,
which will be registered in the detector. The magnetic
spectrometer operates cyclically in a dynamic mode, during which
the current I in the electromagnet increases
continuously, while the pulses from the detector are
registered. Particles of different energies gradually fall into
the detector, depending on the instantaneous intensity of the
magnetic field. In the next cycle, the electric current increases
again from zero to the set maximum value. If we plot the
appropriate calibration multiple of the square root current ÖI on the
horizontal axis and the registered number of pulses for each
value I on the vertical axis, we obtain a graph of the
energy distribution of the measured charged particles, ie. the energy
spectrum of corpuscular radiation. Magnetic
spectrometers have a very good resolution, usually better than
1%, but their detection efficiency is relatively low (the energy resolution and "luminosity"
of the spatial detection angle compete with each other).
Magnetic lens spectrometers
In addition to transverse magnetic field spectrometers, smaller longitudinal
magnetic field spectrometers are also used, especially
for radiation spectrometry b. The focusing effects of the axial
magnetic field are used here, which, according to the laws of
electron optics, create an image of the source similar to a
converging lens. The principle of operation of such a
spectrometer is shown in Fig.2.6.1 in the middle. The
spectrometer consists of a coil *) through which
a current I passes and excites in the vacuum chamber
inside the coil a longitudinal magnetic field with a vector B
directed along the axis of the coil. Source of analyzed
radiation, eg radiation b, is located on the axis of the magnetic field.
Particles (electrons) emitted by this source in the direction of
the coil at an angle J to the axis, move under the influence of magnetic forces
for spatial spiral paths whose projection into a
plane perpendicular to the axis is a circle with radius of
curvature R = (m.v.sin J) /(q.B), and are focused to one point
on the axis, which is from the source at a distance F = (2p.p/q.B) .cos J, where p = m.v is
the momentum of the particle. At a constant angle J, which is defined
by the aperture of the spectrometer, we can focus particles with
different momentum and thus different energy by focusing the
magnetic field B to one point on the coil axis and
register particles of respective energies with a detector located
at this point on the coil axis. Thus, depending on the current I
through the coil winding, the particles passing through the
annular orifices are focused to the location of the detector
according to their energies - this dependence, after appropriate
calibration, creates an energy spectrum.
*) It is either a long coil
- a solenoid, creating a homogeneous magnetic field inside, or a short
coil, creating an inhomogeneous axially symmetric
magnetic field, limited to a short space between the source of
measured radiation and the detector. If current I flows a
coil with n turns, for particles with momentum p and
charge q, this coil behaves in the direction of its axis as a magnetic
lens with a focal length f = k.(p /q.n.I) 2, where the
coefficient k depends on the dimensions and construction
of the coil.
Mass spectrometers and
separators
Mass spectrometers and separators used in physical
chemistry and radiochemistry also work in a similar arrangement
as the charged particle magnetic spectrometer according to Fig.
2.6.1 on the left. The analyte is ionized in an ionization tube,
the formed cations are accelerated by an electric field, and ions
with a constant velocity v are selected in a velocity
filter (consisting of, for example, a crossed electric and
magnetic field). These then fly through the entrance slit into
the magnetic field, in which they describe a circle of radius R =
(v/e.B).m, proportional to the mass m . Ions of different
masses describe different paths and thus fall on different places
of the base - so the device separates from each
other ions of different masses (given by the weight of the
nucleus). By changing the magnetic field, ions of corresponding
masses are gradually focused into the detector - a mass
spectrum is created .
In the mass
separator, instead of the detector, a suitable target
is installed on the base, on which the incident ions of the
selected mass are absorbed. This method allows isotopic
enrichment of the target, or the creation of an isotopically
pure preparation, but only in small amounts.
Magnetic gamma spectrometers
An important use of magnetic spectrometers is also for accurate
gamma spectrometry. A thin foil called a radiator
(not very apt name, a converter
would be better...) is placed in the input
window of the magnetic spectrometer, from which the incident
photons g eject electrons, whose energy is
measured from the curvature of the path in a magnetic field, as
with a magnetic beta spectrometer (Fig.2.6.1 right). If the
radiator is made of a substance with a low atomic number, the
secondary electrons are generated mainly by Compton scattering,
in the case of using a heavy substance (lead, tungsten) the
secondary electrons will be produced mainly by a photoeffect (at
lower energies of quantum gamma). High-energy gamma radiation (Eg > 1.02 MeV) also produces electron-positron pairs; in this case, paired
gamma spectrometry can be used by simultaneously measuring
the energy of electrons and positrons using two detectors located
on opposite sides of the base.
Magnetic spectrometers have played a very
important role in the accurate measurement of the spectra
of b, g, a, protons, conversion and Auger electrons in
radioactivity and nuclear reactions; they thus contributed to the
specification of physical ideas about the structure of atomic
nuclei as well as about the interactions of elementary particles.
Most of the data in the nuclear tables (eg
in the detailed tables of isotopes from Lederer, Hollander,
Perlman) were obtained by measurements
using magnetic spectrometers.
Spectrometric
analysis of radiation b
While the analysis of radiation spectra g, containing clearly
expressed photopeaks of discrete energy lines, is in principle
relatively easy, the analysis of radiation spectra b is quite difficult. On
the appearance of the continuous spectrum of radiation b, we often do not
even know visually whether the radiation belongs to one maximum
energy, or is composed of several groups of radiation. The
so-called Fermi-Kurie graphs are sometimes used for
detailed spectrometric analysis of radiation b.
The
exact shape of the curve of the radiation spectrum b follows from the
analysis of the energy distribution of the emitted electrons
within Fermi's theory of weak interaction. It follows from this
theory that the intensity N(p) of radiation b on momentum p
a energy Eb is given by N(p) = (Ebmax-Eb)2.p2.F(Z,p), where Ebmax is the maximum decay energy b and the constant F in
itself includes the relevant constants, including the proton
number Z. From this relation, for the spectrum b follows the
equation Ebmax-Eb = Ö[N(p)/p2.F(Z,p)]. If we plot
the function Ö[N(p)/p2.F(Z,p)] on the vertical axis depending on the energy Eb on the
horizontal axis, we get a linear dependence called the Fermi-Kurie
graph. It is a descending line that intersects the
horizontal (energy) axis at the point indicating the maximum
decay energy b. If the studied radiation b is composed
of two or more energy groups, we get a graph composed of two or
more linear segments. By interpolating and
extrapolating these linear segments, we can determine the
energies and relative intensities of individual groups of
radiation b. Analyzes of this kind can now be performed by computer
using special spectrometric software.
Magnetic "cyclotron"
radio-frequency spectrometry
The spectra of low-energy beta radiation can in principle be
measured using coherent so-called cyclotron radiation
emitted by individual electrons b in a
spiral motion in a magnetic field. The evacuated detection
chamber, located in a strong homogeneous magnetic field, is
equipped with microwave antennas that register this
"cyclotron" radiation and the electronic apparatus
evaluates its frequency. In the classical approach the Larmor
frequency f cyclotron radiation f =
e.B /(2p.me)
with the electron charge e and rest mass me is given only by the
intensity of the magnetic field B and does not depend on
the velocity v the electron, and thus on its kinetic
energy E b. However, due to the effects of the special theory
of relativity, in reality the Larmor frequency will slightly
depend on the velocity of the electron v and thus on its
kinetic energy Eb: f = [e.B/2p.me] .Ö(1-v2/c2) = (e.B/2pme)/[1+Eb/(me.c2)]. By
accurately measuring the frequency, we can determine the energy
of the electron - perform beta spectrometry. For
a 1T magnetic field, the emitted radiation will have a frequency
of around 27GHz.
This method is
not suitable for higher electron energies in the relativistic
region, because cyclotron radiation changes into synchrotron
radiation , which has a continuous spectrum and no longer carries
direct information about the energy of the electron. The origin
and properties of cyclotron and synchrotron radiation are briefly
discussed in §1.6, section "Interaction of charged
particles", passage "Cyclotron and synchrotron radiation".
This method is not yet
standard used. The prototype of this detector was assembled in
2009-2012 by J.A.Formaggio and B.Monreal.
Detection
of beta radiation by liquid scintillators
The difficulties encountered in detecting beta radiation on the
detector side, mainly associated with radiation absorption, were
mentioned above. However, even bigger problems occur on the side
of the measured sample! Significant (self) absorption of
beta radiation occurs directly in the sample itself -
beta electrons from the inner parts of the sample usually do not
penetrate out at all, this radiation also does not penetrate
trought any packaging of the radioactive sample (e.g. a vials).
To measure beta radiation from such samples, it is necessary to
make a relatively damanding treatment of the sample into a very
thin layer (evaporated) and then try to measure it in a
geometry of 2p using window GM tubes or plastic scintillators.
Accurate activity measurement b-radioactive
preparation, especially low-energy beta radiation, is therefore not
possible (due to the absorption of beta radiation in the
sample itself) even with the use of very perfect radiation
detectors b. However, there is an interesting and well-functioning
method of accurately and with high efficiency (approaching even
100%) to detect the radiation of b- radioactive preparations:
it is a method of liquid scintillators.
A liquid scintillator
is a substance in the liquid state which, upon interaction with
ionizing radiation, converts part of the absorbed energy into
flashes of light (scintillation), similar to the solid state
scintillators described above. These are suitable cyclic
hydrocarbons in organic solvents (specific
compositions and properties of some types of liquid scintillators
will be given below). The use of liquid
scintillators for measuring beta-radioactive samples is as
follows (Fig.2.6.2) :

Fig.2.6.2. Left:
Schematic representation of the principle of beta radiation
detection by a liquid scintillator. Right:
Mark II instrument (Nuclear Chicago) with a sample exchanger for measuring beta-samples in a
liquid scintillator (at Department of
Nuclear medicine in Ostrava).
- 1. The measured b -radioactive
sample we mix directly into a solution
of liquid scintillator in a transparent (glass) vial.
This completely eliminates the problem self-absorption,
since each b -radioactive atom of sample is entirely
surrounded on all sides by the molecules of the
scintillator, so that each electron, emitting by the b--decay,
immediately interact with the scintillator => a scintillation
flash is generated.
- 2. The resulting
scintillations in the liquid scintillator are registered
by photomultipliers (Fig.2.6.2 on the left),
where light flashes are converted into electrical pulses
in the same way as with conventional scintillation
detectors. The amplitude of the output pulses is
proportional to the intensity of scintillation, and thus
the energy of the detected electrons b - the
detector has spectrometric properties.
The number of registered pulses per unit time is
proportional to the radioactivity of the sample.
In principle, one photomultiplier would be
sufficient to capture light flashes from a liquid scintillator.
The reason for using two photomultipliers in a coincidence
circuit according to Fig.2.6.2 is, in addition to
increasing the detection efficiency, to suppress unwanted
impulses coming from photomultiplier noise and
chemiluminescence. Some chemical reactions between the sample
material and the scintillator can lead to light emission - chemiluminescence
(see below), which in
the photomultiplier produces false pulses not originating in the
detected beta radiation. In contrast to scintillation,
chemiluminescence is characterized by the fact that only
one photon (or a few photons) is emitted in one act,
while true scintillation is a flash of several hundred or a
thousand photons. Therefore, if we use two photomultipliers
according to Fig.2.6.2 to detect light from a liquid
scintillator, then noises and photons from chemiluminescence
always generate an impulse independently in only one of the
photomultipliers, while from a large number of simultaneously
emitted photons during true scintillation, a certain part always
falls into both photomultipliers at the same time. Thus, at the
output of the coincidence circuit, we receive pulses only when
beta-induced scintillation is detected, while noise and
chemiluminescent pulses are not transmitted. This suppression of
unwanted pulses is particularly important when measuring tritium
samples, where the noise pulses from the photomultiplier have an
amplitude comparable to the signal pulses coming from the
detection of low-energy beta radiation from 3H.
When measuring low-energy radiation b in liquid
scintillators, we encounter the problem of a small number
of emitted photons, which can be only tens of photons
per scintillation. Therefore, high demands are
placed on the properties of photomultipliers - high quantum
efficiency of the photocathode for a given spectral range (see
below for spectrum shifters), low noise (in co-production with
coincident photomultiplier connection), good optical contact of
photomultipliers with scintillator (incl. reflectors), also low
absorption of radiation in the scintillator itself.
The entire detection system with
photomultipliers is of course enclosed in a light-tight
shielded box, where the cuvette with the measured
sample, mixed with the liquid scintillator, is lowered through a
light curtain by means of an elevator and is extended back after
the measurement has taken place. Laboratory instruments of this
type for measuring series of a larger number of samples are
equipped with an electro-mechanical system of a sample
transducer with a capacity of several tens to hundreds
of vials, which gradually inserts individual cuvettes, after a
preset measuring time extends, moves and inserts another vial
(Fig.2.6.2 right - the principle is similar
to the one below in Fig.2.7.3 on the left ).
Some devices have the entire space of the detection system and
the sample converter tank cooled to a
temperature of about 4 °C, which contributes to the reduction of
noise, chemiluminescence and possibly evaporation of samples.
In Fig.2.6.2 on the right is the
deviceMark II (Nuclear
Chicago) with a cooled sample
exchanger for measuring beta samples in a liquid scintillator.
For many years (1974-1990), we have successfully used this
state-of-the-art instrument at our nuclear medicine department in
Ostrava to measure b- radioactive samples of radiocarbon 14C, tritium 3H, 32P and others. It was
later replaced by a newer RackBeta (LKB) device.
Measurement of
beta-radioactive samples using Cherenkov radiation
We present this possibility as rather of curiosity. If the
radionuclide in the measured sample emits beta radiation of
sufficiently high energy (higher than about
300keV for water samples), we can use the described instruments
according to Fig.2.6.2 in principle to measure without
the use of liquid scintillator - using the emission of Cherenkov
radiation (§1.6., passage "Cherenkov radiation") in the sample material. It
is applicable, for example, to 32P or yttrium 90Y samples. The conversion efficiency of Cherenkov
radiation production is significantly lower than for
scintillation radiation, so the method is not suitable for
samples of very low activities.
Use of
liquid scintillators for the detection of external radiation
In addition to the internal measurement of
radioactive samples mixed directly into the scintillator
described above, the liquid scintillators can in some cases also
be used for the detection of external radiation.
We simply pour the liquid scintillator into a container of
suitable shape and size, so that we can obtain a detector of a
size not achievable with solid (crystalline) scintillators; they
are therefore used, for example, in the detection of cosmic rays
or neutrinos (.....).
Make the invisible
visible
At our department, we used a liquid scintillator (in a very unconventional way) for
mapping and visualization of irradiation beams -
electron, photon, proton - used in radiotherapy. We filled a
glass measuring cylinder with a diameter of 6 cm
and a height of 44 cm with 1 liter of liquid scintillator (we used a dioxane scintillator with a density
of 0.95 g/ml) and placed it under the
irradiation head of the appropriate accelerator - electron,
photon CyberKnife, proton. From the side, we observed and
photographed the scintillation radiation generated in
the scintillator along the passage of the irradiation beam -
Fig.2.6.3 :
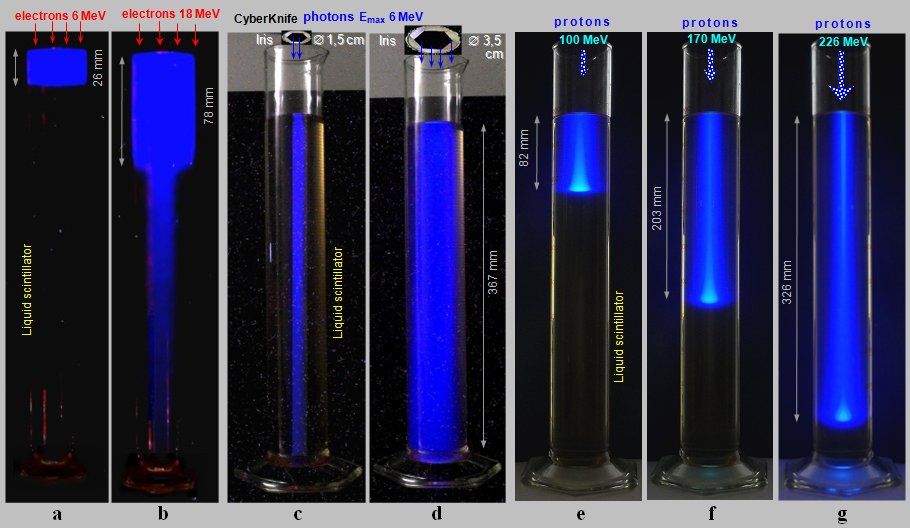 |
Fig.2.6.3 Scintillation radiation
generated in a cylinder (diameter 6 cm and
height 44 cm) filled with a liquid scintillator
during irradiation with electron, photon and proton
radiation beams.
a), b): A cylindrical phantom
filled with a liquid scintillator was irradiated with a
wide electron beam of 6 MeV and 18 MeV from a linear
accelerator.
c), d): When irradiating the same phantom
with a beam of photon radiation - max.
energy 6MeV, beam with a diameter of 1.5 cm and 3.5 cm -
they form secondary electrons along g
beam scintillation radiation - with a deep decrease in
intensity as the primary photon beam attenuates as it
passes through the liquid.
e), f), g): When
irradiated with narrow ("pencil
beam") proton beams of energy 100, 170
and 226 MeV, the protons penetrate to different depths
depending on the energy, with a significant Bragg
maximum. |
The results of these measurements are discussed
in more detail in §3.6, passage "Make the invisible
visible " - display of radiation beams".
Liquid
scintillators - composition and properties
The liquid scintillator consists
of two main components: the solvent and the scintillator
itself dissolved in it . The most commonly used solvents are toluene
and 1,4-dioxane. The actual scintillator is some
organic compound characterized by fluorescence. In particular,
2,5-diphenyl 1,3-oxazole (PPO) and 1,3,4-oxadiazole (PBD) are
used in concentrations of about 5 g/liter, and naphthalene
in dioxane-based scintillators.
The energy of the beta radiation is first transmitted to the
solvent molecules. The excitation energy of these molecules is
then transferred to the molecules of the scintillator itself,
which emit photons of visible light during deexcitation. However,
the spectrum of this emitted light is distributed in the region
of shorter wavelengths than the maximum spectral sensitivity of
the photocathode of conventional photomultipliers. To increase
the detection efficiency, therefore, a spectrum shifter
*) is added to the scintillation solution, the molecules of which
absorb the primary energy of the scintillation and emit
subsequent light photons of lower energy, corresponding to the
spectral region of maximum photomultiplier sensitivity. The most
commonly used spectrum shifter is 1,4-bis- (5-p-tolyl-2-oxazolyl)
-benzene (POPOP) and its modifications, in concentrations of
tenths of grams/liter.
*) The spectrum shifter also provides
another positive effect. In one-component scintillators, the
optical emission and absorption spectra are identical, so that
the radiated scintillation photons in the surrounding
scintillator molecules self - absorb back . The
scintillator is thus not very transparent for the emitted
scintillation photons, from a greater depth many photons do not
penetrate the photomultiplier. This reduces the conversion
efficiency of the scintillator. The addition of a spectrum
shifter leads to the absorption of the original scintillation
energy and the emission of lower energy photons, for which the
environment of the organic scintillator is already well
transparent.
For better miscibility of the solvent
and the sample, secondary solvents, tissue solubilizers,
are sometimes added to the scintillation solution or gelling
agents. A dioxane scintillator that is up to about 10% miscible
with water is suitable for measuring samples in aqueous
solutions. Sometimes different heterogeneous mixtures of liquid
scintillator and measured sample are also used. E.g. the
microfilter film with the captured beta sample soaks up when
immersed in the scintillator and becomes transparent, so that the
resulting scintillations can also be measured similarly to a
conventional homogeneous arrangement. In all these non-standard
methods, due to the geometry of measurement, absorption and
increased quenching, the detection efficiency is significantly lower
than in homogeneous unquenched samples, but in many cases it is fully
sufficient and is sometimes the only applicable method.
Quenching
and chemiluminescence
Based on the principle of
detection by liquid scintillators, it can be expected that
practically every electron b emitted by the measured
sample inside the scintillator (except for a thin layer at the
surface and walls of the measuring cuvette) will cause
scintillation and be registered - this is true "4p -geometry",
detection efficiency should be close to 100% *). However, there
are two adverse events that can reduce detection efficiency,
increase background, and overall impair the accuracy and
reproducibility of liquid scintillator sample measurements: quenching
and chemiluminescence.
*) Radiation spectrum b it is continuous and contains a significant proportion
of low-energy particles (the rest is carried away by neutrinos -
§1.2), whose scintillations cause low signal
pulses of the same magnitude in the photomultiplier as the noise
pulses generated by the thermoemission of the photocathode. These
pulses then do not pass through the lower discriminatory level of
the analyzer - a certain initial part of the spectrum is
therefore often lost for detection. Therefore, for soft beta
radiation from 3H, it is generally not possible to achieve a better
detection efficiency than 50% in practice.
Quenching
A side effect of mixing the measured sample into the scintillator
is a series of chemical reactions that can cause a reduction in
the light yield (conversion efficiency) of the scintillator and
thus a corresponding reduction in the amplitude of the pulses
from the photomultiplier. These reduced pulses may fall outside
the discriminant levels on the analyzer and are not registered.
This phenomenon is called quenching. We
distinguish two types of quenching, which usually occur in the
samples at the same time :
Chemical quenching is caused by the fact that
the molecules or atoms of the measured sample, by their chemical
action, partially prevent the transfer of excitation energy
between the molecules of the solvent and the scintillator, so
that only weaker scintillation occurs.
Color quenching then it causes part of the
photons emitted during scintillation to be absorbed
by the substances contained in the sample. The designation
"colored" refers to the fact that these non-fluorescent
substances have a discrete absorption spectrum and absorb photons
in a certain energy (= color) range.
Some chlorinated hydrocarbons, such as chloroform or tetrachloro
CCl4,
peroxides, as well as water and oxygen dissolved in the
scintillator, have strong quenching effects .
The
consequence of quenching is that two samples containing the same
activity, but showing different quenching, give different
numbers of pulses.
Quenching correction
Because quenching can vary the detection efficiency differently
for different samples, quenching correction is required for
accurate and reproducible measurements. The quenching correction
is based on the analysis of the measured radiation
spectrum b in the amplitude analyzer. In Fig.2.6.2 on in the
middle, the radiation spectra b of the same radionuclide (eg 14C) measured by a liquid scintillator at low quench and
at high quench are plotted. Extinguishing significantly affects
the shape of the spectrum b - the spectrum shortens and shifts to lower energies.
Thus, by analyzing the shape of the spectrum, we can determine
the degree of quenching. The analysis of the shape of the
spectrum is simply performed here by determining the ratio of the
number of pulses in the two analyzer windows suitably set to the
spectrum b.
Calibration
or standardization is required to correct for quenching. We will
prepare several identical samples of the given radionuclide b in a liquid
scintillator. Gradually add an increasing amount of quencher (eg
chloroform) to each of them and perform their spectrometric
analysis on the instrument according to Fig.2.6.2. The ratio of
the number of pulses in two suitable windows of the amplitude
analyzer is plotted on the horizontal axis, on the vertical axis
efficiency (all samples have the same activity). This gives the
so-called quenching curve (usually in the form
of a parabola or hyperbola), which can then be used to correct
for quenching in unknown measured samples: from the ratio of the
number of pulses in the two analyzer windows on the quenching
curve we determine the correction coefficient by which we must
multiply the measured number of pulses to compensate for loss by
quenching. This is the so-called internal standardization
of quenching.
Some devices also have a
built-in so-called external quenching standardization.
It consists in that the measured sample with a liquid
scintillator, inserted in the measuring position between the
photomultipliers, is irradiated for a moment with
gamma radiation from an external source and the
correction coefficient is determined by analyzing the shape of
the spectrum thus obtained (ratio of two parts of the spectrum).
The external standard uses radionuclides (mixed emitters b+ g or a + g ) 137Cs, 133Ba, 241Am, 226Ra, sometimes a pair
of radionuclides, with an activity of tens of kBq. The external
standard is placed in a lead shield, from where is automatically
extended into close of the measuring cuvette with a liquid
scintillator, and pushed back again after standardization.
Chemiluminescence
Chemiluminescence is an event in which light is emitted as a
result of chemical reactions. Some chemical reactions between the
sample material and the scintillator can lead to this
chemiluminescence, which in the photomultiplier produces spurious
pulses not originating in the detected beta radiation.
Fortunately, however, chemiluminescence is limited in
time and expires exponentially within about 30 minutes
of placing the finished samples in the sample exchanger
container, where they are not exposed to light.
Neutron detection
Because neutrons have no electrical charge and can not themselves
directly ionize the electron shells of atoms, for their detection
is necessary to use the processes of interaction
which produce secondary charged particles which
already have an ionization effect, and can be detected. The
following methods are mainly used for neutron detection :
- The method of reflected
nuclei uses collisions (elastic interactions) of
fast neutrons with light nuclei, especially hydrogen
nuclei (protons), which are accelerated during collisions
and then cause ionization in the substance - they can
then be detected by conventional detectors.
- Method of nuclear
reactions - neutrons, when entering certain
nuclei, induce nuclear reactions (see
§1.3, section "Reactions induced by neutrons"), in which ionizing
radiation is emitted and then detected. In organic (plastic or liquid) scintillators
it is possible to use reactions of neutrons with carbon: 12C(n,p)12B--b--->12C, 12C(n,pa)8Be-->2a, 12C(n,p 3He)9Be--b--->n 2a. The following reactions are also used: 10B(n,a)7Li, 4He(n,p)3H, 6Li(n,a)3H, 113Cd(n,g)114Cd. In the
practical implementation of these reactions, the
respective "target" materials are implanted
directly into the detectors, so that the
resulting secondary ionizing radiation can be detected
immediately. E.g. to the anode surface of G.-M. tube, a
layer of cadmium is applied for the neutron detection.
High detection efficiency for neutrons has a lithium
iodide LiI(Eu) crystal scintillation detector, with
lithium being highly enriched in the 6Li isotope;
this detector also has spectrometric properties (see
below). The proportional neutron detector is filled with
either helium enriched in the 3He isotope, or boron fluoride BF3 which is
highly enriched in the 10B isotope.
- The fission
method uses the fact, that neutrons when they
enter into heavy nuclei (uranium and transuranics) cause
them to split, producing strongly ionizing fragments (see §1.3, section "Fission of atomic nuclei"). A fissile
material (such as 235U) is coated in a thin layer on the electrodes
of the ionization chamber, or implanted into the detector
material.
- The method of
activation is based on the fact that the capture
of a neutron by an inactive nucleus can lead to the
formation of a radioactive nucleus. This nucleus, during
its radioactive conversion, then emits ionizing radiation
(b, g), which is detected.
In principle, neutrons can be detected using
conventional g or charged particle detectors (b, a, p), event. provided
with a suitable converting material. This
converting material absorbs neutrons, creating secondary
radiation that can already be easily detected. For slow
neutrons, layers containing lithium 6Li or boron 10B are often used, in which neutrons are converted into
charged particles and g. For fast neutrons, for example, a polyethylene film is
suitable, from which fast protons are emitted by interaction. In
general, it should be noted that the layer of converting material
is depleted during interactions. Another
negative phenomenon in neutron detection may be internal
radioactive contamination of detector materials, induced
by nuclear reactions with neutrons inside the detector (see §2.1, section "Nuclear reactions and induced radioactivity
inside detectors").
Neutron spectrometry
Energy measurement, or neutron spectrometry, is
more difficult than with gamma or beta radiation. To measure the
spectrum of slow neutrons, so-called mechanical
selector is used. They consist of two disks made of a
highly neutron-absorbing matter (cadmium) mounted on a rotating
shaft. The discs have a series of identical radial slots around
the circumference, the position of which is shifted at the second
disc by a very small angle relative to the first disc. The
measured neutron beam passes parallel to the shaft axis through
the slit of the first disk and is absorbed by the second disk,
except for those neutrons whose velocity is such that they reach
the second disk at a time when they can pass freely through the
shifted slit of the second disk. For a given shaft speed, disk
distance and angular displacement, neutrons are only transmitted
in a narrow speed range. By changing the speed of the shaft
speed, neutrons of different speeds are gradually transmitted,
their count rate is measured by a neutron detector and thus their
velocity spectrum is measured, from which the energy
spectrum is derived. In this way, the spectra of only
slow neutrons, of the order of eV, can be measured.
The spectrum of slightly
faster neutrons can be measured by their Bragg
scattering on the crystal lattice. Due
to corpuscular-wave dualism, the neutron of mass mn and kinetic energy E
behaves as a wave of wavelength l = h/(2mnE)1/2. For slow neutrons,
the wavelength corresponds to the order of magnitude of the
distance of the atoms in the crystals. On such a grating,
neutrons can be scattered by Bragg reflection (similar to
X-rays): neutrons of only one energy are reflected to a certain
angle between the plane of the lattice and the direction of the
incident beam. By continuously changing the angle between the
neutron beam and the crystal on the goniometer,
the measured frequencies in the neutron detector give us an angular
distribution curve from which the spectrum is
determined. Crystal neutron spectrometers are suitable for
energies in the range of about 0.1-100 eV.
To measure fast
neutron spectra, reflected protons can be
used, whose energy is measured by a proportional or scintillation
detector, event. by measuring the length of the proton trace in
the nuclear emulsion. It is also possible to use the already
mentioned scintillation detector 6LiI (Eu), where
neutrons in the reaction (n, a) transfer to the scintillator released energy 4.78MeV +
energy of the arriving neutron, which can be determined by
amplitude analysis of output pulses from a photomultiplier with a
resolution of about 10% (at an energy of 5MeV).
2.7.
Measurement of radioactivity of samples (in vitro)
One of the most common types of radiation measurements is the measurement
of radioactivity of samples - whether they are samples
in medicine and biology, samples from the environment, or samples
taken from various places in industrial systems. The specific
methodology for measuring the radioactivity of samples depends on
several circumstances - the type and energy of radiation, the
activity of samples, the size and shape of samples, the required
accuracy, whether it is a relative or absolute measurement, etc.
The questions of the choice of detectors according to the type of
radiation were discussed above in §2.1-2.6, the most frequently
used detectors for gamma-samples in the passage "Scintillation probes", Fig.2.4.3. Here we will mention some practical
aspects of measurement geometry, on specific
methods for measuring series of samples and radiochromatographic
methods for analyzing samples.
Measurement geometry -
2 p
, 4 p
The overall measurement efficiency is given not
only by the detector's own detection efficiency, but also by the
mutual arrangement of the measured sample and the detector - the
so-called measurement geometry. By measurement geometry
we generally understand all aspects of the spatial
relationship and configuration of the measured sample or
beam of radiation with respect to the detector.
Fig. 2.7.1 shows typical geometric configurations when measuring
samples using gamma radiation :

Fig.2.7.1. Geometry of sample measurement. Planar detector for
geometry max. 2p and
two types of well scintillation detectors for measuring the
activity of samples in geometry close to 4p .
¨ Geometry 2p
The simplest configuration arises when the measured sample is
simply placed tightly to the detector (Fig.2.7.1
on the left). If we neglect the absorption and the effect of the
final size of the sample and the detector, ideally all radiation
is detected that from the sample is directed to the half-plane in
which the detector is located, ie half of all radiation
emitted by the sample - we say that we measure in geometry
2p (full spatial the 360° angle expressed in radians is 4p, its half 180°
then 2p). The total detection efficiency for the attached sample
here can reach a maximum of 50%. Detectors for
this type of measurement are sometimes referred to as planar.
¨ Geometry less than 2p
If the sample is placed at a greater distance from the detector,
it is a measurement at a spatial angle w < 2p, with a correspondingly lower
detection efficiency (0-50%).
¨ 4p geometry
If we want to increase the detection efficiency and measure all
radiation emitted by the sample to a full spatial angle of 360°
- ie in 4p
geometry, we use
the so-called well detector
(see Fig.2.4.3b in §2.4, passage "Scintillation probes") in the arrangement shown
in the middle and right part of Fig.2.7.1. A well detector for
measuring higher activities in the design of the ionization
chamber is shown in Fig.2.3.3 on the right in §2.3 dedicated to
ionization detectors. However, for sensitive measurements of low
activities sample, well scintillation detectors are used with a
hole drilled in the crystal either longitudinally
to a certain depth (middle part of Fig.2.7.1 - well
crystal), or with a hole drilled transversely
through the whole crystal (Fig.2.7.1 on the right). The vial with
the measured sample is inserted into this hole, so that almost
all the radiation emitted by the sample (except the narrow cone
in the direction of the hole) must pass through the sensitive
volume of the detector and can be detected - a geometry close
to 4p. In the 4p geometry, the detection efficiency can theoretically
approach up to 100%, in practice it reaches approx. 80-90% for
well scintillation detectors.
Note: The real 4p -geometry is the
above measurement of beta samples dissolved in a liquid
scintillator, where we can sometimes approach up to 100%
efficiency ("Detection
of beta radiation by liquid scintillators").
Detection
efficiency
The most important parameter at the measurement of radioactive
samples is the detection efficiency of the measurement
- the ratio between the measured number of pulses in the detector
and the number of radiation quantum emitted by the sample during
radioactive transformations. The general detection efficiency of
a radiometer depends on a number of physical factors of the
interaction of radiation with the detector material, absorption
and geometric conditions - it was discussed above in the section
"Detection efficiency and sensitivity". There are some specific influences and
circumstances in the measurement of samples, which we will
mention here.
Positional and volume dependence of the detection efficiency
When measuring radioactive
samples, the detection efficiency depends crucially primarily on
the geometric configuration of the sample
relative to the detector. Each sample emits radiation isotropically
in all directions *), but only a certain part of this radiation
enters the sensitive volume of the detector and can be
registered. In the basic geometry of the planar detector
according to Fig.2.7.1 on the left, the detection efficiency
depends mainly on the distance of the sample
from the detector - it decreases approximately with the square of
the distance, reaching the highest values (but max. 50%) close to
the detector, as discussed above.
*) Angular (directional) correlations of gamma
photons
For some radionuclides, in one and the same
transformation event cascaded emits two or more gamma quanta
occurs. In such a case, angular correlations may
occur between the emission direction of these photons (see §1.2,
section "Gamma radioactivity", section "Angular
(directional) correlations of gamma radiation"). This relative "anisotropy" can have
some effect on the geometric dependence detection
efficiency. If the sample is close to the detector, the effect of
angular correlation is averaged over a wide range of angles
(close to 180°) and is practically not manifested. If the sample
is at a greater distance from the detector, the detection angle
is smaller and the effect of angular correlation on the different
efficiency of gamma photon detection from cascade deexcitation is
slightly increased. In some accurate measurements, even this
small dependence is corrected.
With a well
detector, the highest detection efficiency is when the
small sample lies at the "bottom" of the well detector
- then most of the radiation passes through the sensitive volume
of the detector and the smallest part comes out in the cone
through the hole without registration. The higher the sample is
placed in the well hole, the more radiation comes out
"useless" - the well detector has a significant positional
dependence of the detection efficiency. Closely related
to this position dependence is the volume dependence
of the detection efficiency: the larger the volume of the sample
in the vial inserted into the hole of the well detector, the
larger part of the sample is near the hole, where the detection
efficiency is lower - Fig.2.7.2 left. The self-absorption
of radiation in the sample also contributes to the volume
dependence of the detection efficiency.
In addition to geometric influences,
the detection efficiency can also be reduced by radiation
absorption, both in the sample itself (self-absorption)
and in the input window of the detector. When measuring samples, different
glass thicknesses of test tubes and ampoules can also
have an effect, especially when measuring low-energy gamma
radiation (eg for 125I the plastic test-tubes are recommended here).

Fig.2.7.2. Left: Volume dependence of
the detection efficiency of a well scintillation detector. Right:
Positional dependence of the photopeak on the location of the
sample in a well of scintillation detector.
Positional dependence of
the photopeak in a well scintillation detector
In well scintillation detectors, we encounter an strange typical
phenomenon: the broadening or doubling
of the photopeak and the dependence of its position on
the location of the sample inside the well. Gamma radiation from
a sample placed inside a well passes through two areas of the
scintillator :
1. Bottom of well - usually a smaller portion of
gamma-photons passes through the well bottom, but scintillations
from this area of the scintillator, closest to the
photomultiplier photocathode, are registered with higher
efficiency, ie with higher amplitude output pulses.
2. The walls of the well passes
the larger part of gamma photons, wherein the scintillations from
those regions farther away from the photocathode being registered
with less efficiency, i.e. with a lower amplitude of the output
pulses.
In the resulting spectrum, the photopeak
consists of two parts. The main, dominant peak of the
photopeak, shifted to the left to lower amplitudes (energies),
corresponds to the majority detection of gamma radiation in the
massive side walls of the well crystal. Right (descending) part
photopeak is towards higher energies expanded a
sort of bump - "second photopeak",
corresponding to the detection of a smaller fraction of gamma
radiation passing through the bottom of the well crystal -
Fig.2.7.2 on the right. This effect is most pronounced for a
point source located at the bottom of the well, where a
significant part of the radiation passes through the bottom of
the well (a partial photopeak shifted to the right - resulting in
a "double photopeak"); for higher positions of the
source in the well, the effect diminishes and ceases to be
noticeable, with large-volume samples or sources outside the
wells, we see only one overall extended photopeak.
This complex geometric situation
during detection at different locations of the scintillation
crystal leads to a worsened energy resolution of
the well detectors compared to planar detectors (the effects
affecting the resolution were analyzed above in the section
"Photopeak
- energy resolution of a scintillation detector"). For large-volume well detectors (as in Fig.
2.7.2 on the right), the energy resolution is around 17%.
Spectrometric setting of detection
apparatus
On the detection efficiency has a significant influence also spectrometric
setting of detection device. The highest detection
efficiency would formally achieved in integral mode
when we measure all impulses coming from the detector. We cannot
use the integral mode if we want to distinguish more
radionuclides with different energies in the measured samples -
then we have to use differential measurement
with the analyzer window set to the photopeak of
the required gamma radiation. However, even when the samples
contain only one type of radionuclide, photopeak
measurement is advantageous because we achieve the best
signal/background ratio, which is especially important
when measuring samples with low activities,
background-comparable. For accurate measurements of the content
of radionuclides in samples, mostly calibrated semiconductor
detectors with a multichannel analyzer are used, on
which careful spectrometric analysis is
performed measured gamma photopeaks.
Measuring
series of samples
Measuring large series of samples, numbering
tens, hundreds or thousands of samples, would be very laborious
and time-consuming when measured manually with one detector.
Therefore, special instruments are used that allow automatic
measurement of series of samples - sample changers and
multi-detector instruments.
Automatic sample changers
Sample changers, often also called
gamma automates (usually gamma radiation are
measured *), are detection apparatus equipped with an
electro-mechanical device for exchanging samples. Prior to
measurement, the samples we they stack in a tray (cartridge)
with a capacity of about 100-500 samples, which has either a
chain or cassette arrangement. The electro-mechanical drive
unit uses an small electric motor to move the individual
samples to the location of the detector, where a motor-operated elevator
inserts the given sample into the cavity of the well or drilled
detector. The measurement is then performed for a preset time,
the measured number of pulses is registered (printed
out, sent to computer), the elevator
extends the sample, the next sample moves and another measurement
takes place - Fig.2.7.3 on the left.
*) The same principle of electro-mechanical displacement of
samples in the cartridge is used by sample changers for measuring
beta radiation in liquid scintillators.

Fig.2.7.3. Measurement of larger series of samples. Left:
Gamma-automat with electromechanical sample changer. Right:
20-detector gamma sample meter.
Multi-detector systems
Sampler changers with one detector allow automatic measurement
without the need for manual manipulation, but measuring large
series of samples is time consuming - the total
measurement time N samples is T = N.(t + tm), where t is
the average measurement time of one sample and tm is the sample
exchange handling time. E.g. the measurement of 300 samples with
a measuring time of 100 s. takes about 8.5 hours. With such a
long time (sometimes measured overnight), there is also a certain
risk of power failure, instability or other malfunction.
The most powerful and fastest
instruments for measuring large series of samples are multi-detector
systems. They consist of 10, 12, 16 or 20 independent well scintillation detectors
placed right next to each other, possibly in two rows (Fig.2.7.3
on the right). Each scintillation detector has its own
photomultiplier, usually firmly connected to a crystal in a
so-called scintiblock. The samples are stored in
trays (casets), which fit exactly into the holes
of the detectors. After the insertion of such a set of samples,
the measurement of each of them takes place simultaneously (but
independently) in well scintillation detectors, the measured
pulses being registered in the memory of the instrument. At the
end of the measuring time, insert the container with another set
of samples, etc. The above example of measuring 300 samples after
100 s. takes only less than 30 minutes here when using a
20-detector device!
In addition to the high measurement speed of large series of
samples, the great advantage of multi-detector instruments is
that they have no mechanical parts (they are
purely electronic), so they do not require maintenance and have a
minimum failure rate.
The basic requirement for
multi-detector instruments is the same detection
efficiency of all detectors - the result must not depend
on which detector the sample was measured. This is achieved by
careful selection of scintillation crystals and photomultipliers,
the remaining differences are compensated by
numerical correction of detection efficiency -
results from detectors with slightly reduced sensitivity are
multiplied by an appropriate correction factor greater than 1,
pulse counts from detectors with increased efficiency by a factor
of less than 1. The matrix of correction coefficients
is obtained by either measuring one sample sequentially on all
detectors and calculating the respective ratios to the mean
value, or by measuring a set of samples - standards - with the
same activity. The correction factor for each detector is then
stored in the instrument's memory and the measured pulse counts
are automatically corrected.
Another requirement for
multi-detector measurement is that radiation from a sample
inserted in one detector does not penetrate to the surrounding
detectors and does not affect the measurement results. Due to the
low energies of gamma radiation (devices of this type are most
often used for 125I), this radiation is prevented by the lead shielding in
which the individual detectors are embedded. For higher energies,
where panetration can be actually applied, the devices are
equipped with radiation penetration correction:
the numbers of pulses registered in the other (surrounding)
detectors, multiplied by certain weight transmission
factors, are subtracted from the measured number of
pulses in the given detector . The matrix of these transmission
factors is obtained by measuring the sample of a given
radionuclide gradually in individual detectors, registering not
only the number of pulses in the detector, but also the response
of other (empty) detectors and dividing it by the number of
pulses in the detector. The obtained factors are again stored in
the device's memory and the correction takes place automatically
during the measurement.
Hybrid sample changers
In addition to single-detector sample changers and multi-detector
systems, sample changers with several detectors - approx. 3-5
detectors - are also rarely used. The electro-mechanical device
gradually moves the sample cartridges and the elevators
periodically insert 3-5 samples into the detectors for the
duration of the measurement. These instruments, sometimes called
"hybrid" instruments, measure faster than
single-detector sample transducers (as many times faster as there
are detectors), but generally do not achieve the performance of
multi-detector systems and are mechanically very complicated...
The category "Measurement
of radioactive samples" can also include two
complex chemical-analytical methods using ionizing radiation - radiochromatography
and radioelectrophoresis. We will describe here
both these methods in terms of physico-chemical principles and
laboratory procedures, as well as radiodetection measurement of
the obtained distribution of analyzed radioactive substances.
Radiochromatography
Chromatography
is a physico-chemical separation method that
spatially separates the molecules of the analyte from
each other on the basis of their different mobility in
the carrier media. This is due to their different physical or
chemical properties, especially sizes - molecular weights
and shape, as well as polarity and chemical bonding. This
separation is performed primarily for the purpose of analyzing
the molecular representation in the test substance (occasionally also for the purpose of isolating
the required substances).
Terminological note: The somewhat
misleading name "chromatography" (formed by combining Greek words chroma = color, graphein = write,
draw) comes from the first experiments with
this separation method, which were performed with plant pigments
chlorophyll, carotene, xanthophyll (M.S.Cvjet,
1903). Their separation was observed
visually according to different colors - green, red,
yellow. Now analyzed substances are usually not colored.
The separation
process takes place in a chromatographic system, which
contains two phases: mobile and stationary. The
mobile phase (eluent,
solvent) - liquid, gas or plasma,
containing a sample of the analyte, moves - flows, seeps -
through the system and entrains carry the sample through
the stationary phase (immobile,
anchored in place), which leads to separation
of the various molecular components. This creates a certain spatial
distribution of the analyzed substances along the
chromatographic system - chromatogram. The
analyte is applied ("drip") to a site called the "start".
The places where the individual molecular fractions of the
analyzed sample penetrate at a given time form more or less sharp
local concentration maxima - chromatogram peaks.
The mobile phase itself (eg solvent) passes through the
system the fastest - it forms "forehead"
of chromatogram (we stop the chromatography
when the forehead arrives near the end of the chromatographic
system). Passage of analyzed sample
components are then various ways slowed down - retarded
according to the size or other characteristics of the molecules.
For quantification of the different speeds of the passage of
analytes in a sample is introduced so-called retardation
factor RF - the ratio of the distance of the forehead from the
start, to the distance of the center of the peak ("spots") of the
substance from the start, is in the range of values <0,1>.
For substances that are not carried by the mobile phase (heavy poorly soluble macromolecules), is RF = 0 - remain detained at the start; for substances that
the stationary phase does not slow down at all and are freely
entrained together with the forehead, RF
= 1.
For systems where a chemical chromatogram is not formed (such as liquid and gas chromatography) the so-called retention time is
introduced - the time from the start of flow so that the sample
fraction reaches the detector at the end of the chromatographic
column.
A number of
types of chromatographic methods have been developed, depending
on the arrangement of the separation system, the mobile and
stationary phase used, instrumental techniques (column
chromatography, liquid, gas, plasma chromatography, gel, paper,
thin layer chromatography). Three methods are more often used :
- Gel chromatography takes
place in a gel, which is placed in a vertical column. The gel
contains small holes (pores) inside, which act as a "molecular
sieve". However, the gel is most often used in the Electrophoresis
described below.
- Thin layer chromatography uses a plate covered
with a thin layer of sorbent - silica gel, to which the
analyte is applied to one starting point with a thin
capillary in a suitable organic solvent. The end of the plate in
front of the starting point is then placed in ascending order in
a solvent which begins to rise with silica gel and entrains the
analyte with it, at a rate depending on the size of the
molecules..
- Paper chromatographyis the most common method, using
as a fixed phase "absorbent" - non-glued
chromatographic paper (thickness about
0.2-0.6 mm), consisting of a compressed
layer of cellulose fibers, between which there is a large number
of gaps and pores; in them, the solvent seeps through by
capillary forces. The analyzed sample is applied to the paper
strip at a certain "starting" point near one end and
before this point the strip is immersed in the mobile phase -
solvent (the starting line must be above
the surface!). Depending on the type
(solubility) of the analyte, the mobile phase may be water
or aqueous salt solutions, but often organic solvents
ethanol or methanol, acetone, methyl ethyl ketone, ethyl acetate,
acetonitrile, tetrahydrofuran, dichloromethane and the like.
Chromatography is performed in a vessel with saturated
solvent vapors to prevent the chromatographic strip from
drying out during the process.
Depending on the direction of movement
- leakage - of the mobile phase (solvent) in the chromatographic
strip, two embodiments are used, "descending" or
"ascending". In the descending design, a small
dish with solvent is attached in the upper part of the analytical
vessel, into which the upper end of the chromatographic strip is
immersed, which then hangs and the solvent seeps downwards
- Fig.2.7.4a above (second dish with
solvent, built on the bottom, ensures a saturated atmosphere of
vapors). In the ascending design,
a layer of solvent (approx. 5 mm) is poured at the bottom of the vessel and the
chromatographic strip is suspended so that its lower end is
immersed in the solvent, which then capillaries rises upwards
and carries fractions of the analyte with it from the starting
point - Fig.2.7.4a bottom. In this ascending position, a plate
with a thin silicagel foil can be used instead of a
paper tape.
The mobile phase flows or rises
through a layer of paper or thin film due to capillary forces
and carries with it the individual molecular components of the
sample, which are divided according to their solubility
and mobility. The low-molecular, well-soluble and mobile
components travel the furthest, larger molecules remain near the
starting point. When the front of the chromatogram approaches the
end of the paper tape, we end the process by breaking the contact
of the tape with the solvent (pull out the
tape). After the mobile phase has dried,
the chromatogram is detected and evaluated.
Upon completion of the motion of
mobile phase, the separated molecular components remain
temporarily fixed at the sites of the stationary phase
where they have reached *). This creates a basic chemical chromatogram,
which is mostly latent (except for
the analysis of color substances) and it is
necessary to "make it visible" - "evoke" - detect
-evaluate. Several methods can be used
for this. In the chemical method of development, a
suitable indicator substance is sprayed onto the
chromatogram, which causes a color reaction with the
distributed molecules. Physical - radiation - methods of
detection use irradiation of the chromatogram with visible or
ultraviolet radiation, which elicits a fluorescent
optical response on distributed substances. From the point of
view of our field of nuclear and radiation physics, we will
describe the method of radiochromatography
below.
* ) This is especially true for paper and
thin layer chromatography. For some other methods (such as gas chromatography) no
chromatogram is created, but at the end of the column there is
one fixed detector, which gradually registers the arrival of
individual molecular fractions and evaluates the time
of their arrival - retention time....
 |
Fig.2.7.4. Paper chromatography and
radiochromatogram evaluation.
a) Descending (top) and ascending
(bottom) chromatography on paper tape (in
the ascending version, a plate with a thin silica gel
foil can be also used instead of chromatographic paper).
b) Simple method of radiochromatogram
evaluation by measuring cut strips (with scissors) in a
scintillation detector. c) Automatic
radiochromatograph measuring the radiation profile of the
chromatogram by moving the collimated detector along the
strip.
Note: Spots or
stripes on the chromatographic tape are drawn only
symbolically, they are not directly visible (- only after
evaluation) ... |
Radiochromatography
is a method of chromatographic separation of radioactive
substances with subsequent use of ionizing radiation
detection for chromatogram evaluation. These are either primarily
radioactive substances (such as
radiopharmaceuticals) or substances labeled
with radionuclides specifically only for the purpose of
their analysis.
Detection of the distribution of
analyzed radioactive substances on the chromatogram is performed
by radiometric methods - using suitable
electronic radiation detectors (alpha,
beta, gamma) along the chromatographic
strip or column. The simplest (especially
previously used) procedure consists in cutting
(with scissors) dried chromatographic tape
into narrow strips (width approx.
5 mm), which are then measured separately
with a scintillation detector (usually in
test tubes in a well detector); their
radioactivity - the measured number of pulses - is plotted
graphically, resulting in a final chromatogram (Fig.2.7.4b). It
is a relatively lengthy and laborious procedure, suitable only
for occasional chromatography of simple samples.
Therefore, detection devices have
been developed for frequent routine use, which perform automatic
profilographic measurements and evaluation of
radiochromatograms. The collimated scintillation detector passes
just above the chromatographic strip or thin layer, registers the
local intensity of the emitted radiation - the count rate of
detected pulses - and outputs chromatographic curve
(Fig.2.7.4c), with event. quantitative computer evaluation. In
the graphical record, the individual chromatographically
separated fractions of the analyzed substance form
"bell-shaped" curves - peaks. The positions
of the peaks are given by the specific chemical properties of the
fractions - molecular weight, polarity, solubility. The area
(integral) under the curves of these peaks is proportional to the
relative proportion of the respective fractions in the
separated mixture from the analyzed sample.
Radiochromatography is
very often used to measure the radiochemical purity
of radiopharmaceuticals - §4.8 "Radionuclides and
radiopharmaceuticals for scintigraphy", section "Radiochemical purity".
A special method of chromatogram
evaluation is autoradiography, based on the
action of emitted radiation on a photographic emulsion (or on an electronic imaging detector) - §2.2, passage "Autoradiography".
Radio-electrophoresis
Electrophoresis (from the Greek electro
foresis - to be carried by electrons; - transmission by
electricity ) is a physico-chemical separation
method that spatially separates the molecules
of the analyte on the basis of different mobility of
charged particles - molecules - ions *) - by the action of an
external electrical field in a liquid,
gel or porous medium. This mobility of particles depends on the
value of the charge, the size, shape and weight of the particle
(molecular weight), the properties of the environment and, of
course, the strength (gradient) of the electric field. It is
performed primarily for the purpose of molecular
composition analysis of the analytes (rarely used for
preparatory purposes). It is an alternative
(often more sophisticated) analytical method to the chromatography described above.
*) Generation
of electric charge of analyzed molecules
Molecules of analyzed substances acquire electric charge by
interaction with the carrier medium. Conventional neutral
molecules within contain both positive and negative charges in
different parts of the molecule, wherein the total charge is
equal to zero. By interacting with the
environment, the molecule can gain or lose hydrogen ions
(H+ -
protons) and thus become more positive or negative. This property
depends on the pH value (acidity or alkalinity)
of the environment. In an acidic environment
(pH <7) there is an excess of hydroxide cations H3O(+), so molecules will generally tend to acquire protons
and become cations, while in a basic
environment (pH> 7) there is an excess of hydroxide anions OH(-) and molecules they
will more often lose protons and act as anions. The isoelectric
point pH(I) (often abbreviated as pI)
is that pH of the medium, at which the
molecules of a given substance are electrically neutral
(on a statistical average). If the pH value of the environment is lower
than pH(I), the molecules acquire an overall positive
electric charge, for pH values higher than pH(I)
the given molecules have a resulting negative
charge.
E.g. for proteins, pH(I) = 7.3 and
NH3 groups have a
charge of "+" and COO(-) groups have a charge of "-", the molecules
are generally neutral. At lower pH values, eg around 6, positive
values prevail for NH3(+), COOH are without
charge, the resulting charge is positive. At a higher pH, around
8, the NH2 groups are
uncharged and a negative charge predominates in COO(-). Therefore, at the
recommended pH = 8.6, the proteins travel from the cathode (-)
towards the anode (+).
The movement of
charged particles at electrophoresis
During electrophoresis, two forces act on a charged
particle with charge Q in an electric field of intensity E :
1.
The electrostatic
force FE = E . Q, which tries to accelerate
the motion of a particle. The intensity E of electric
field is given by the voltage U [V] on the electrodes and their
distances L [m] (the length of the
chromatographic column) : E = U/L [V/m] , so that FE = E .
Q/L.
2. Resistance
of environment (viscosity, shocs
in the "molecular network" - Fig.2.7.5a), which tries to slow down the speed of
particle motion: force Fr = k.Rm.s, where k is
the material coefficient, Rm is the effective diameter
of the molecule and s is the intrinsic resistance of the medium.
At the starting moment, when the velocity of the
particle is zero (except for thermal
movements), the particle is set in motion
by the electric force Fe . With increasing velocity,
the force Fr of the environmental resistance increases
(in fact it is a slight moment,
microseconds) until both forces acting on
the particle equalize Fe= Fr . Now is the
stationary state, in which the particles will move at
a constant speed v = Q . U / (k . L .
Rm . s). The speed of particle
movement - electrophoretic mobility - is therefore
directly proportional to the charge of the particles and the
electrical voltage at the electrodes and indirectly proportional
to the distance of the electrodes, particle size and resistance
(viscosity) of the environment.
(Electrophoretic mobility is usually normalized to 1V voltage.)
The carrier,
environment or medium in which the electrokinetic movement of the
substances of the analyzed sample takes place, can be either a
free liquid - an electrolyte (not commonly
used, except for capillary electrophoresis),
a porous support such as chromatographic paper or
cellulose acetate film (the channels of
which can serve as a "molecular sieve"), but it is usually a gel (agarose, polyacrylamide, starch).
In terms of hydromechanical properties, the gel
is a kind of transition form between solid and liquid state. More
than 90% is made up of water, but in which a dense three-dimensional
network is formed from polymerized sugar or acrylic chains
connected by transverse hydrogen bonds. The size and density of
the "mesh" of this network depends on the concentration
and method of gel polymerization - the gel concentration
determines the size and density of pores through which the
analyzed molecules pass (typically around
100-300 nm, for selected gel species it is comparable to nucleic
acid molecules and proteins). The
concentration of the gel can therefore influence the separation
rate and the size resolution of molecular fractions (proteins, DNA fragments). Usually
a concentration of around 1-2% is used (up
to 4% gel is used for finer resolution of short DNA fragments).
The pores of this network function as a
"molecular sieve" for the movement of
molecules under the influence of an electric field, through which
larger molecules pass more slowly than smaller molecules -
Fig.2.7.5a. Analyzed molecules is thereby progressively separated
according to their size (molecular weight) over a distance of several millimeters to centimeters;
individual fractions are arranged according to the size of
molecules. The places, where the individual molecular
fractions of the analyzed sample penetrate at a given time, form
more or less sharp local concentration maxima - peaks
of the electrophoreogram.
This resulting graph of the
electrophoreogram is already used for chemical analysis
of the measured sample: the positions of
the peaks determine the type of substances contained
(molecular weight), their intensities - peak heights
(or areas - integrals - below the peak
curves) determine the representation of
relevant substances. Quantitative analysis can
also be performed with the appropriate calibration.
 |
Fig.2.7.5. Gel electrophoresis and
evaluation the density and radio-electrophoresis.
a) Principle of separation of molecular
fractions by electric field through a "molecular
sieve". b) Basic arrangement of
electrophoresis in a gel environment. c)
Stained electrophoreogram. d) Optical -
photoelectric - evaluation of electrophoresis fractions. e)
Radiometric evaluation of the electrophoreogram of the
radioactive analyte. |
A small amount (drop - a
few microliters) of the analyzed sample - analyte
- is applied with a micropipette to the starting point
in the gel (it is a well
in the gel, usually several wells next to each other, extruded by
a special "comb"). Then an electrical
voltage of the order of tens to hundreds of volts (approx. 1-10 V/cm) is applied to
the electrodes between which the column is inserted *) -->
electrophoresis begins - Fig.2.7.5b. After a preset time, or when
the fastest molecular component approaches the end of the column,
the electrophoresis process is terminated by disconnecting the
electrodes from the high voltage.
*) Electrical
conductivity of the environment, pH, buffer
The electrical conductivity (resistivity) of the environment -
the gel - affects the passing current and the mobility
of molecules during electrophoresis. It is regulated by the
composition and concentration of the electrophoretic buffer
in the gel. Buffer is an agent regulating the alkalinity or
acidity of the environment - the pH value. The
fundamental importance of the pH environment for obtaining the
electric charge and thus the mobility of the analyzed molecules
was discussed above in the note "Origin of the
electric charge of the analyzed molecules".
Without the presence of buffer salts, the electrical conductivity
is minimal and the molecules move and separate hardly and very
slowly. However, if the salt content in the buffer is too high,
undesired heating of the gel may occur during electrophoresis.
Typical parameters used for conventional columns are: pH 8.6,
voltage 200-250 V, current about 10mA per 1cm of gel width,
separation time about 10 minutes.
pH gradient,
isoelectric "focusing"
Depending on the pH value of the environment,
many important analyzed molecules (amino acids, peptides,
proteins) acquire a positive or negative electric charge. This is
decided by their so-called isoelectric point pH(I) - the
pH value at which they are uncharged (discussed above in the
section "The formation of
an electric charge of the analyzed molecules"). This regularity can be used for a certain
"trick" to improve the resolution of separating
capability of electrophoresis.
There are certain chemicals called
ampholites which, when an electric current passes through
the electrolyte (in gel) creates a stable linear pH
gradient , with the lowest pH at the anode and the
highest at the cathode. In this situation, the assayed molecules,
e.g., proteins applied to the gel, will move with a pH gradient
only to the place, where the pH of the medium be equal to their
isoelectric point pH(I). Here is stopped,
because the molecule here becomes electrically neutral; and it
will remain stand firmly there, because if it is deflected
towards the anode or cathode, it would gain a positive or
negative charge and the electric force would immediately return
it. The result is very narrow and sharp
streaks - zones - peaks in the gel, where the molecules are
precisely concentrated (focused), with a high-resolution
of separation. The method is called isoelectric
focusation (ISS).
Electrophoreogram
After switching off the electric voltage, the movement of the
molecules stops and the separated molecular
components remain temporarily fixed in the
places of the gel where they reached. After electrophoresis, the
gel must be dried or fixed with a suitable reagent (such as acetic acid) to immobilize
the separated molecules in the support medium and prevent their
diffusion. This creates a basic chemical electrophoreogram,
which is usually latent and needs to be "made
visible" - detected - evaluated.
This can be achieved mainly by two methods :
- Optical
detection methods
make use of colored or luminescent labeling of the analyzed
molecules - gel is stained in order to visualize
individual molecular fractions (sometimes
the dye is added to the sample before analysis) . Special organic dyes are used (blue,
red, green, similar to microscopic observation of specimens). Subsequent irradiation of the stained column with
visible or ultraviolet radiation will elicit a fluorescent
optical response on the distributed substances (Fig. 2.7.5c). It
can be evaluated visually or electronically by photodetectors.
In the density method, the electrophoreogram is shifted
evenly over the slit of the photometer through which
light of the respective color passes (wavelengths,
approx. 400-700 nm). In the place of higher
concentrations of individual fractions there is a partial
absorption of radiation, which is registered by a photodetector -
densitometry recording the changing value of light
absorption according to intensity - density - color, Fig.2.7.5d.
In fluorescence mode, the photodetector directly
measures the intensity of the emitted fluorescent light.
In the graphical record of the
absorbance or fluorescence of the individual electrophoretically
separated fraction of the analyte, they form
"bell-shaped" curves - peaks. The read
positions and intensities of the individual fragments are
compared with the standard sample, analyzed in parallel.
The positions of the peaks determine the molecular weight of the
fractions, the area (integral) under the curves of these peaks is
proportional to the relative representation of the
respective fractions in the electrophoretically separated mixture
from the analyzed sample - it allows quantitative
analysis.
Into one of
the wells in the gel (in Fig.2.7.5b it is
the last well on the right) a standard
sample with a known representation of analyzed
substances, eg various types of proteins, is applied. By
comparing the positions of the peaks in the chromatograms of the
analyzed samples in other columns, it is possible to identify the
type and representation of the sought types of substances
(molecules). The position coordinate on the chromatogram (Fig. 2.7.5d, e) - the distance of
the peak from the start in [cm] - is thus calibrated
to the molecular weight axis in [kDa].
- Nuclear
radiation methods
use the detection of ionizing radiation emitted by radiolabelled
sample molecules and its fragments. From the point of view of our
field of nuclear and radiation physics, we will briefly present
the method radio electrophoresis below.
The above-described method of
electrophoresis in "plate" gel columns according to
Fig. 2.7.5b,c is suitable for the analysis of a smaller number of
samples and their molecular fractions. Current laboratory
electrophoreographs have the option of about 12-60 sample routes
in the gel column. They are used in biochemical analyzes of eg
amino acids, peptides, proteins, nucleic acids.
Serum
protein electrophoresis is most commonly performed. These
proteins are here divided into about 6 protein fractions. The
width of the zones shown depends on the number of individual
types of proteins with similar mobility
(molecular weight) that are present in the
fraction. Albumin is the most common here, which also
travels furthest towards the anode. By decreasing electrophoretic
mobilities follow a1, a2, b1,
b2 - globulins, b lipoproteins, the
transferrin.... Gammaglobulins (G,
A, M, D, E) form a wide "blurred"
strip near the start. The electrophoreogram of blood serum
proteins (unspecified example) was used above as an illustrative example in Fig.2.7.5c.
Electrophoresis of proteins in
urine is also
used (proteins of glomerular and tubular
origin differ here) and cerebrospinal
fluid proteins (an increased
proportion of different types of proteins is found due to the
increased permeability of the blood-brain barrier or the
inflammatory process in the CNS).
However, for
analyzes of a large number (hundreds or
thousands) of samples, this standard method
is somewhat complicated and time consuming. Here can be
advantageously used a capillary electrophoresis :
Capillary
electrophoresis
uses the electrokinetic effect of electrophoresis (and electroosmosis) to the
separation process of materials within a thin capillary.
A quartz glass (silicon-oxide) capillary is used with an inner
diameter of approx. 20-200 micrometers and a length of min. 20cm
to 1 meter. It is connected to high voltage of approx. 20-30 kV
via tubes with buffer. Such a high voltage
(causing a higher current density and thus Joule heat) can be used due to the efficient heat dissipation
from the capillary to the surroundings. High voltage leads to
increased separation efficiency and shortened analysis time
to units of minutes.
This capillary serves as an electrophoretic
chamber, in the end part of which a photoelectric fraction detector
is located. No "chemical electrophoreogram" is
created along the capillary (which would
have to be subsequently evaluated), but the
detection of fractions takes place continuously - "on
line". The detector continuously evaluates the
intensity and retention time arrival of a given
molecular fraction - the time from the beginning of the flow,
necessary for the given fraction of the sample to reach the
detector at the end of the capillary chamber. This directly
creates electrophoreogram peaks.
Current routine biochemical methods
of DNA sequencing use fluorescently labeled nucleotides,
which are analyzed by capillary electrophoresis in a
large number (tens or hundreds) of parallel
capillary sequencers, wherein the fluorescent light is
registered by a sensitive opto-electronic detector. These new
sequencing techniques allow very fast and relatively inexpensive
"reading" of entire genomes. A huge amount of sequence
data obtained in this way is processed by computer - it becomes
the subject of bioinformatics.
The development of advanced very
fast, highly parallel (approx. 106) sequencing techniques continues, using fragmentation
into short section, sequencing synthesis of complementary strands
to the analyzed fragment using DNA polymerase, implementation of
chemical luminescent labels signaling incorporation of
new bases into the DNA strand. Completely new possibilities of electronic
detection are also tested, during sequencing, based on
electrical signals from a change in conductivity in the
"molecular sieve" environment, in which DNA fragments
are translocated ...
However, all these methods
completely go beyond the scope of our treatises on nuclear and
radiation physics (as well as the
professional orientation of the author...).
Radioelectrophoresis
is a method of electrophoretic separation of radioactive
substances with subsequent use of ionizing
radiation detection to evaluate the distribution of
radioactive molecular fractions in columns. These are either primarily
radioactive substances (such as
radiopharmaceuticals), or substances labeled
with radionuclides only for the purpose of
their analysis.
Detection of the distribution of
analyzed radioactive substances on the electrophoregram is
performed by radiometric methods - using
suitable electronic radiation detectors (alpha,
beta, gamma) along the electrophoretic tape
or column (it is analogous to the
radiochromogram in Fig.2.7.4c). The
collimated scintillation detector passes just above the
radioactive electrophoretic column, registers the local intensity
of the emitted radiation from individual places - the frequency
(count rate) of detected pulses - and outputs the electrophoretic
curve (Fig.2.7.4e), with event. quantitative computer
evaluation. In the graphical record, the individual separated
fractions of the analyte form "bell-shaped" curves - peaks.
The area (integral) under the curves of these peaks is
proportional to the relative proportion of the
respective fractions in the electrophoretically separated mixture
from the analyzed sample.
Radioelectrophoresis
is sometimes used - in addition to the more frequently used radiochromatography
- to measure the radiochemical purity of
radiopharmaceuticals - §4.8 "Radionuclides and
radiopharmaceuticals for scintigraphy", section "Radiochemical purity".
A special method of
radioelectrophoresis evaluation is the above-mentioned autoradiography,
based on the effect of radiation emitted from radioactive
fractions on a photographic emulsion (or on an electronic imaging detector) attached closely to the electrophoretic column - §2.2,
passage "Autoradiography".
Chromatography
<- versus -> electrophoresis
Both of the above analytical methods of chromatography
and electrophoresis have much in
common. They differ mainly in two aspects :
1. Chromatography is a passive method,
where the molecules of the carrier and the analyzed substances
move and separate due to natural thermal motion and
intermolecular forces, manifested, for example, by capillary
forces.
2. Electrophoresis is an active method,
where the molecules of the carrier and the analyzed substances
move and separate under the influence of an artificial
electric field and current. This controlled method provides wider
possibilities of optimized analysis of a large range of
substances, especially proteins, nucleic acids, DNA fragments.
Therefore, the technical design and
the course of the analytical process also differ. However, the
evaluation of the result - chromatogram and electrophoreogram
- is largely similar, including the possibility
of using radiometric methods - cf. Figures 2.7.4 and 2.7.5.
2.8.
Absolute measurement of radioactivity and radiation intensity
Like measuring methods in general, radiometric measuring methods
can be divided into absolute and relative.
For relative measurements, we are concerned with determining the ratios
of activities or radiation intensities of individual
samples either with each other or with respect to a suitable standard;
in most applications of ionizing radiation, such relative
measurements are sufficient for us. For absolute methods, we need
to determine by direct measurement under precisely defined
conditions, from the measured of ionization current or pulse
frequency, the absolute value of activity in
[Bq] or the absolute intensity of the radiation
beam in [number of quant /cm2] (fluence) or in units of dose [Gy]
or dose rate [Gy/s]. Absolute measurement of radiometric
quantities encounters a number of fundamental and technical difficulties,
which will be briefly discussed below. Methods of absolute
measurement of radiometric quantities can be divided into two
categories :
- Primary absolute measurement
,
where the relevant quantity is determined directly
from the measured values of the response of the
measuring instrument, taking into account a
number of correction factors (measurement geometry,
detection efficiency, radiation absorption, etc.). These
very demanding measurements are performed at metrological
workplaces, where they serve as reference
methods for primary radiation standardization
and for calibration of secondary radiometers.
- Secondary absolute measurement
,
where the absolute value of the required quantity is
determined using a measuring apparatus calibrated
with a suitable standard or a set of standards. This
method is used in technical practice.
Absolute
measurement of radioactivity
For the primary absolute measurement of the activity of
radioactive emitters and preparations can be used several methods
utilizing the physical and chemical manifestations of
radioactivity.
Absolute counting of emitted particles
The activity A of a certain radioactive emitter (ie the
number of nuclei that is converted per unit time) can be measured
directly using the frequency of particles
(quantum of radiation) that a given sample emits. Using a
suitable detector, measure the number of pulses N
for a certain time t , subtract the background
pulses Nb
and multiply the result by the correction factor F
:
A [ Bq ] = F. (N - Nb) / t .
The total correction factor F includes all circunstances
affecting the detection of radiation from a given sample; is the
product of several partial coefficients: F = fg . fd . fa . Here fg = 4p/w is a geometric
factor given by the ratio between the full spatial angle
4p (into
which isotropic radiation from each source takes place) and the
actual angle w, in which the quantums emitted from the source fall
into the sensitive space of the detector (Fig.2.8. 1 top left). fd is the correction
factor for the detection efficiency, which
depends on the type and size of the detector, the type and energy
of the detected radiation, or on the dead time of the detector. fa is the radiation
absorption correction factor, which is the product of
the self-absorption factors in the sample, the radiation
absorption in the detector window and possibly radiation
absorption in the environment between the source and the
detector. These correction factors must be determined by
independent measurement for each specific method.
For detecting the radiation quanta
are used GM tubes (earlier), scintillation and semiconductor detectors,
proportional detectors. A special group consists of methods with
a measurement geometry of 4p, when the
active space of the detector completely surrounds the radiation
source. The measured sample is stored either inside the
ionization chamber - GM or proportional detector, or the
radioactive atoms are evenly dispersed in the gas charge, or the
radioactive preparation is dissolved in a liquid scintillator.
This measurement geometry is almost completely 4p, only at the edges
and walls of the detection volume there is a reduction in
detection efficiency.
Absolute coincidence
methods
In certain special cases, it is possible to circumvented the
chalenging and difficult determination of the above correction
factors F. The elegant possibility of determining the absolute
detection efficiency (ie h = 1/F), and thus
automatically the possibility of measuring the absolute activity
of a radioactive preparation, is offered for such radionuclides
that emit two quanta of ionizing radiation simultaneously
(or more quanta simultaneously). Here we can use methods of
simultaneous - coincidence - detection of these
two quanta of radiation emitted by a radionuclide.
Method of b-g coincidences
This method is suitable where the radionuclide emits beta
radiation accompanied by gamma photons (decay scheme in the left
part of Fig.2.8.1 above). In this case, we place a measured
sample of (sought) activity A between two detectors,
equipped with independent evaluation circuits (detection
"channels") and a coincidence circuit. Detector Db is
sensitive only to beta radiation and will measure the pulse
frequency nb = A.Fb , where Fb is the geometric-efficiency factor for detecting
radiation b from the sample. Detector Dg , sensitive only
to gamma radiation, will measure the pulse frequency ng = A.Fg , where
Fg analogously characterizes the efficiency of g radiation
detection from the sample. A pulse will appear at the output of
the coincidence circuit only if pulses occur at both its inputs
at the same time. The probability that a particle b and a quantum g emitted during one
radioactive transformation will be registered at the same time is
Fb.Fg , so the frequency of coincidences will be ncoin = A.Fb.Fg . From
these three relations we can exclude the unknown factors Fb and Fg, thus
obtaining the resulting relation: A[Bq] = (nb.ng)/ncoin , according to which the absolute activity A
can be determined by the coincidence method only on the basis of
measuring the pulse frequencies nb and ng in both
beta and gamma detectors.
Fig.2.8.1. Coincidence measurement of absolute activity and
detection efficiency.
Left: Coincidence detection of
radiation b and g by two separate detectors b and g. Right:
Coincidence analysis of measuring pairs of photon radiation g .
Method of g-g coincidences
This method can be used if the investigated radionuclide emits
two photons simultaneously during each transformation - either
during deexcitation of nuclear levels in a cascade (eg 60Co), or in electron
capture accompanied by simultaneous emission of a characteristic
X-ray photon from envelope and photon g from the excited daughter
nucleus (eg at 125I) - Fig.2.8.1 at the top right. If both of these
photons enter the detector and are registered, the detector will
not distinguish them from each other in time - they will coincide
and the transmitted pulse will be equal to the sum
of the pulses from both quanta. In the spectrum thus appears summation
peak nS corresponding to the sum of energies of both quanta
(Fig.2.8.1 on the right).
If we measured in the geometry 4p and the detection
efficiency was 100%, all pairs of coincidence photons would be
detected simultaneously and only the summation peak
would be present in the spectrum. If the detection efficiency is
lower than 100% (which is practically always), in a part of the
coincident gamma-pair only one from this twoo photons is
detected, and in addition to the summation peak, the actual
peaks of both quanta with respective energies appear in
the spectrum. The lower the detection efficiency (whether by
deviation from the geometry of 4p, or the lower the
efficiency of the detector itself), the lower the probability of
simultaneous detecting of coincidence photons and the lower the
summation peak with respect to the separate peaks of the
individual photons from the coincidence pair. By evaluating the ratio
between the areas (integrals) of the summation peak nS and the
peaks of individual coincidence photons n1, n2 it is possible to determine the total detection
efficiency in a given measurement arrangement, which includes
all partial factors (geometric, absorption, detector
efficiency), and thus determine the absolute activity
of the measured sample: A[Bq] = (n1+n2+2.nS)2 / 4.nS . This
method works well in a geometries close to 4p and with not too low
detection efficiency, when the summation peak nS is well
expressed (accuracy of absolute activity determination may be
better than 1%). With a geometry of 2p or lower, the summation
peak in the spectrum almost disappears - the method is subject to
a large error or is not applicable at all.
Calorimetric measurement
of absolute activity
In principle, the thermal effects of the
energy released during radioactive transformationscan also be
used for the absolute measurement of radioactivity. Since the
amount of heat generated is relatively very small from a
macroscopic point of view, this method can only be used for
preparations with relatively higher activity, of the order of
hundreds of MBq, GBq, TBq. The so-called isothermal
calorimeters, operating at normal temperature, are
sometimes used for the absolute measurement of the radioactivity
of high-activity preparations - bridge temperature thermistors
are used to compare the temperature difference between a
reference sample and a sample containing the radioactive
material. ...
Electrostatic measurement
of absolute activity
can be used to measure the activity of radionuclides
emitting charged particles - a or b. When a charged particle is emitted from
a radionuclide (originally electrically neutral), this
radionuclide acquires an equally large charge of the opposite
sign. From the change in the total charge of the sample over a
certain time interval, the activity can in principle be
determined. As this creates very small charge values, it is
necessary to use sensitive electrometers. There are a number of
disturbing influences, coming from secondary electrons released
during ionization by radiation and from the absorption of charged
particles in the source itself ...
Calibration of detectors
for measuring activity
...............
Measurement of activity by
well ionization chamber
For approximate measurement of radioactivity, especially in the
field of medical applications of open radionuclides, ionization
chambers in well design are preferably used as activity
meters of radioactive preparations (these
meters are sometimes incorrectly called "dose
calibrators") - was mentioned above in
§2.3 "Ionization detectors", Fig.2.3.1 on the right. The vial or syringe with
the radioactive substance is inserted into the opening of the
well ionization chamber, which in the geometry close to 4p registers the
emitting radiation g. The electrical signal I from this chamber is
proportional to the activity of preparations A and G-constant of the
given radionuclide: I ~ A. G; the G- constant is different for each radionuclide. The
electronic circuits of the activity meter are calibrated
so that for the selected radionuclide the display shows its activity
directly in MBq.
Measurement
of radiation intensity and dose rate
The intensity or fluence of radiation
can be measured directly using suitable detectors, sensitive to
the given type of radiation and located at the desired location
of the beam. The measured frequency (count rate) of pulses N
per unit area of the detector must again be corrected by the
factor F of the detection efficiency. In the case of
stronger beams of radiation, used for example in radiotherapy,
the intensity of radiation is characterized by a dosimetric
quantity of radiation dose rate at a given
location of the substance that is exposed to radiation.
Normalized and calibrated ionization chambers,
and more recently semiconductor detectors, are most often used
for these measurements.
For measuring doses and dose
rates inside irradiated materials, eg inside
tissue in radiotherapy, the so-called Bragg-Gray method
of ionization chamber is used, located in a cavity inside the
material (or this chamber itself is the cavity). This measurement
is objective, assuming that the radiation intensity in the
surrounding material and in the chamber is the same, the
dimensions of the chamber cavity are much smaller than the range
of secondary electrons in the gas and the dimensions of the
surrounding material layer are much greater than the range of
secondary electrons in this material. Then the electron
equilibrium occurs in the system, the presence of the cavity
- the ionization chamber - does not disturb the electron balance
in the surrounding material. Then the ionization of the gas in
the chamber cavity is caused almost exclusively by electrons
coming from outside their walls (the contribution from the
interaction of primary radiation in the chamber cavity is
negligible) and these electrons lose only a small part of their
kinetic energy as they pass through the chamber cavity. The
transmitted energy at the location of the chamber and its
surroundings is practically equal to the kinetic energy of the
released electrons ( dose = kerma ). In this situation,
the number of ion pairs formed in the chamber cavity is proportional
to the dose of primary radiation in the material that
surrounds the chamber cavity. Thus the dose rate D´ is
proportional to the current I through the ionization
chamber: D´ = L.w.I/(r.V), where L
is the ratio of the linear ionization of the irradiated material
and the chamber gas during electron motion, w is the
energy required to form one ion pair in the chamber gas, r is the density
(specific gravity) of the gas, V is the volume of the
chamber cavity. In practical measurements, the ionization
chambers are placed in the appropriate sites of the phantoms,
either aqueous or tissue equivalent (which, by their
composition, mimic the irradiated tissue).
2.9.
Measurement of radioactivity in the organism (in
vivo)
A specific area of radiometric measurements is the detection of
radiation from radioactive substances deposited within
the organism - in vivo measurements.
Let us first ask the question: Under what circumstances can
radioactivity enter the body? There are basically two options :
- 1. Targeted application
of a radioactive substance to the organism for the
purpose of diagnostic or therapeutic use of ionizing
radiation emitted by a radionuclide within the organism.
- 2. Internal contamination
with a radioactive substance in an undesirable situation
- careless work with open radionuclides, radiation
accidents, neutron irradiation, etc.
Note:
Tiny content of natural radionuclides (14C, 40K, 3H, ...) in the
body is not considered as internal
contamination.
In both of these different situations, there
may generally be a need to measure the amount or
distribution of radioactivity in an organism.
Whole-body
measurement of radioactivity
Absolute measurement of the total amount of radioactivity
in the organism may be important in the mentioned case
No. 2 - internal contamination of radiation
workers.
We determine radioactivity in the organism on the basis of
external detection of outgoing gamma radiation. In order to
achieve approximately the same detection efficiency for all parts
of the body during whole-body measurement, several
scintillation detectors of larger dimensions are used,
distributed around the patient's body in the arrangement of the
so-called whole-body detector. In some types,
the body passes evenly between the detector system. When
evaluating the number of measured pulses from individual
detectors, a number of corrections for absorption and geometric
conditions are used, as well as multiplication by calibration
coefficients expressing the relationship between the
measured pulse frequency and the activity of the monitored
radionuclide in the body.
To detect internal contamination by an
unknown radionuclide, or a mixture of different radionuclides,
high-energy spectrometric semiconductor detectors
are also rarely used in the whole-body detector, while the
spectra are measured and evaluated using a multichannel
analyzer.
In diagnostic
applications of radioactivity, in the 1970s and 1980s, whole-body
measurements were performed only very rarely in determining the
resorption of certain substances (eg vitamin B12 labeled with 57Co); now this method
is abandonded and by whole body measurements in nuclear medicine
we usually mean whole body scintigraphy -
chapter 4 "Radioisotope scintigraphy".
Local
measurement of the distribution of radioactivity
In diagnostic and therapeutic applications of radioisotopes to
the body, we do not need to measure the absolute value of
radioactivity in the body (this was measured in a bottle or
syringe before application). Rather, we need to determine the distribution
of radioactivity in individual places and organs in the
body - this has direct diagnostic or therapeutic significance. It
is therefore a relative local measurement of
radioactivity in certain places of the organism on the basis of external
detection of the outgoing gamma radiation, which
penetrates trough the tissues out of the organism.
This local measurement of the
intensity of the emitted radiation can in principle be performed
by simply placing the scintillation detector to the individual
locations. However, a free detector (without shielding) would
register g radiation not only from the desired location, but also
from other locations in the body, with only slightly lower
efficiency (given the greater distance of these locations from
the detector). In order to achieve selective detection
of radiation only from the desired place (direction) in the body,
it is necessary to shielding radiation g coming from other
(undesirable) directions and measure only radiation from a narrow
cone in the desired direction - to equip the detector with a collimator.
By gradually stoking such a collimated detection probe
to individual parts of the body we can "map" the
distribution of the radioindicator in individual organs within
the organism. Or, with a collimated detection probe aimed at a
specific organ, we can monitor the time course of distribution of
the radioindicator in this organ after the application of a
radioactive substance to the organism. But all this only very
inaccurately !
Nuclear medicine
These detection methods have played an important role in the
relevant early stage of development of nuclear medicine
- a field dealing with diagnostics and therapy using open
radionuclides (Chapter 4). The simplest method is to determine
the accumulation of 131I in the thyroid gland, where after
application of a known amount of radioiodine, the radiation g from the thyroid
gland is measured with a
collimated probe g and the percentage of radioiodine taken up by the
thyroid gland is determined by comparison with the standard
value; repeated measurements for several days further determine
the half-life of iodine from the thyroid gland.
The most used measuring method in
nuclear medicine in the 60s-80s was radioisotope
nephrography: Two collimated scintillation probes were
directed from behind into the right and left kidney, radioactive 131I-hippuran was
applied, which was taken up in the kidneys, and the detection
probes registered the amount of radiation from the left and right
kidneys. The impulses from the nephrographic probes were fed via
integrators to the recorders, whose pens gradually plotted the
so-called nephrographic curves, showing the
accumulation of 131I-hippuran in the left and right kidney and its gradual
excretion into the urinary tract. From the shapes of
nephrographic curves (steepness of increases, times of peaks and
steepness of decreases) it is possible to deduce the functional
ability of the kidneys and their drainage.
Occasionally, g- registration methods have
been used collimated detection probes from the heart or brain -
the method of so-called radiocirculation in order to examine the
dynamics of heart activity or blood flow through the cerebral
hemispheres. However, these and similar methods were already
debatable at the time of their creation (due to large errors and
inaccuracies in the detection of "blind" radiation) and
were soon abandoned. All these methods, including nephrography,
have been replaced by significantly more perfect
and complex scintigraphic methods.
Radiation-guided surgery - sentinel
nodes
Local radiation measurements with a closely collimated miniature
gamma ray detection probe find important application in radiation-guided
surgery in the detection of so-called sentinel nodes.
In the surgical treatment of cancer, it is important to remove
not only the primary tumor, but also, if possible, other tissues
into which the tumor cells could be infiltrated. These tumor
cells spread from the primary site mainly through the lymphatic
pathways, so that the lymph nodes around the
tumor site are the first to be affected. If we apply a suitable
radioindicator of colloidal state to the peripheral part of the
tumor lesion (most often 99mTc nanocolloid,
particle size approx. 50-600 nm, activity approx. 40-150 MBq), it will spread through the lymphatic pathways and capture
and accumulate in those nodes that are lymphatically associated
with the tumor site. The first such node in the lymphatic
"basin" of a tumor foci is called the sentinel
node. The accumulation of the radio indicator in the
nodes can be displayed scintigraphically.
However, the most important thing is
to monitor the radioindicator during the actual surgical
procedure, when using a collimated detection probe the surgeon
can find a sentinel node containing the radioindicator directly
in the operating field, and also to make sure that the operated
node contains a radioindicator. After application of the
radioindicator, scintigraphic imaging is first performed with the
imaging nodes drawn, then the patient goes to his own surgery,
during which a detection gamma probe is used.
*) Along with the radioindicator, a blue
dye (patentblue) is applied at the same time, which also
penetrates the nodes, so that the surgeon can recognize the
sentinel node even by its blue color.
Scintigraphy
The only viable and promising methods of analysis of the
distribution of radioactivity in the organism (apart from the above-mentioned method of sentinel node
detection) are methods of scintigraphic
imaging of static or dynamic distribution of the
radioindicator. These methods provide detailed mapping
and a clear view of distribution of the radio
indicator, including all peculiarities and anomalies within the
organism, with the possibility of visual evaluation and detailed
mathematical analysis and quantification of the parameters of the
investigated processes within the organism. Methods of
radioisotope scintigraphy are described in detail in Chapter 4
"Radioisotope scintigraphy".
2.10.
Calibration and inspection of detection instruments
In order to ensure accurate and reproducible results of
radiometric measurements, it is necessary to ensure the correct
setting and calibration of detection
instruments and to check these parameters regularly - thus
ensuring their stability.
Calibration of radiometric
instruments
The basic adjustment and calibration of these measuring
instruments is usually performed by the manufacturer upon
delivery of the equipment, it is a "company
calibration". The need for self-calibration
of the instrument arises for the user when he intends to use it
for a different purpose than the one for which it was calibrated.
Possibly, it is a device for general use, the
final response of which is individual pulses, voltage or current
signal. Some methods of absolute calibration have been mentioned
above in §2.8. For the normal user, usually only the method of relative
calibration is available - calibration of the instrument
using etalons, or by comparing it with another
("standard") device. For instruments that are subject
to high requirements for accuracy and reproducibility of results,
metrological calibration or verification of the
instrument is performed using standards with the participation of
an authorized laboratory (metrological
institute).
Stability of the measuring
instrument and its control
The instability
of radiometric instruments can be caused by various influences,
depending on the type of detection instrument. In simple devices
based on ionization chambers, instability is often caused by a
change in pressure and the composition of the gas filling in the
chamber due to a leak (filling leakage) - it usually leads to a reduction
in detection efficiency.
In the case of spectrometric
instruments, the instability of the detector and the electronic
circuits of the evaluation apparatus is manifested by a shift
of the spectrum and thus also by a change in the
position of the photopeak; if the analyzer window is
correctly set symmetrically to the photopeak, due to the
instability, the photopeak will "travels away" from the
window and the number of registered pulses will decrease
significantly. For multi-channel analyzers, instability can lead
to shifts and blurring of photopeaks. The cause of the spectrum
shift is a change in the height of the signal pulses
at the output of the detector, or a change in the
electronic gain evaluation apparatus. These changes can
be caused by high voltage fluctuations at the photomultiplier
dynodes (this is very sensitive!), amplifier gain fluctuations,
changes in electrical values of electrical circuit components
either by temperature fluctuations or "fatigue" and
aging, photomultiplier "fatigue", changes in
scintillation crystal properties (such as yellowing due to water
absorption) or a semiconductor detector (drift diffusion, etc.).
To eliminate
the effect of supply voltage fluctuations, modern devices are
equipped with voltage stabilizers. In order to
achieve high stability of the detection devices and to reduce or
eliminate the influence of temperature on the response of the
device, it is recommended to ensure temperature
stabilization the environment or room in which the
device operates (eg air conditioning). Another rule to ensure
accurate and stable measurement results is that we never measure
on the instrument immediately after it is turned on. The
amplification and other parameters of the electronic apparatus,
as well as the detector itself, may change slightly after
switching on the device and only in a few minutes the device
enters a steady mode, in which it remains for a
long time (unless there is instability due to another cause or
failure). Some devices do not turn off at all to ensure high
stability.
Tests of quality, correct function and
stability of measuring instruments are usually divided in time
into two groups :
- Short-term tests
These are daily tests, or operational tests before
each series of measurements. These tests must be
sufficiently simple and fast,
their task is to verify the functionality
and correct settings of the device. For
detection instruments, the background is
checked (its increase may signal, for example,
contamination of the detector) and the detection response
to a suitable standard, in the case of
spectrometric instruments the position of the
photopeak for the measured radionuclide. For
scintillation cameras, this may be the homogeneity of the
field of view.
- Long-term tests
These are weekly, monthly and annual tests (according
to the specific nature of the devices and controlled
parameters), or acceptance tests when installing new
equipment. Here, important parameters of the device are
tested and calibrated in
detail; in addition to the parameters from the previous
point, it can be, for example, dead time, energy
resolution of the spectrometric detector, amplification
of photomultipliers and spatial resolution of the
scintillation camera, so-called phantom
measurements are performed. Metrological
calibration is also performed for selected
instruments, performed by an authorized institute and
documented by the relevant protocol and certificate of
the instrument.
From an organizational point of view, each measuring
instrument for detecting radiation have drafted regulation for setting , monitoring and measurement
methodology , test results
should be recorded in the
technical diary of the instrument,
or evaluated and archived by computer.
Statistical check of instrument
response stability
If the radiometric instrument is properly calibrated and its
correct setting is verified, it will not show coarser measurement
errors, but in principle smaller deviations may occur due to
instabilities, which do not significantly affect the frequency of
measured pulses of background, samples and standards, and
"at first glance" we do not seen. We can then verify
the correct and stable function of the device using a suitable statistical
criterion - whether the measured pulse frequency is
subject only to statistical fluctuations, or whether it is also
affected by other factors. This method of verification is based
on the knowledge of statistical fluctuations given in the
following §2.11; here we will only present the procedure.
One way to evaluate the proper
function of the device is to repeated measurement
of the same sample on the instrument, thus finding a set of
frequencies N1 , N2 , ..., Nn . We calculate the average value N´ = (N1+N2+...+Nn)/n
for the standard deviation of the measurement s = Ö(N12+N22+...+Nn2)/n. This we compare
the standard deviation with the standard deviation given
exclusively by statistical fluctuations of radioactive
transformations ÖN´. If the standard deviation s during the measurement
significantly exceeds the theoretical value ÖN´, the instrument
contributes to error by its instability !
For a quick orientation check, it is enough to measure
the same sample twice, which gives two values of the number of
pulses N1 and N2 . To assess whether the
difference between these two values is still within the range of
statistical fluctuations, use the following criterion: if the
difference exceeds |N2 -N1| between the measured numbers of pulses, approximately
three standard deviations of the statistical fluctuations, ie 3.Ö[(N12+N22)/2], this indicates a suspicion
of instrument instability.
2.11.
Statistical fluctuations and measurement errors
Like all other measurements of real natural quantities, radiation
detection and spectrometry methods are subject to certain errors.
However, the nature and origin of these errors have their own
specifics in nuclear and radiation measurements, which we do not
usually encounter in other areas. These are irremovable
statistical fluctuations. *)
*) In everyday life, we do not encounter
these fluctations because we mostly observe macroscopic objects
and the amount of photons of light with which we observe is so
large that the fluctuations are negligible. However, in
astronomy, for example, in the observation and spectrometric
measurement of the faint flow of light from distant galaxies,
statistical fluctuations are exactly the same as in the detection
of faint ionizing radiation. Quantum - statistical fluctuations
are generally encountered wherever the measured signal is so weak
that quantum fluctuations of the measured quantity are
manifested.
Statistical fluctuations
The emission of quantum ionizing radiation, as well as its
interaction with the atoms of the material environment (and thus
the mechanisms of radiation detection) takes place at the microscopic
level through events governed not by the deterministic
laws of classical physics, but by the laws of quantum
mechanics. These quantum regularities are in principle
stochastic, probabilistic (see §1.1). The
transformation of radioactive atoms is a completely random
process and the resulting ionizing radiation is emitted
randomly, uncorrelated, incoherently. The flow of ionizing
radiation is therefore not smooth but fluctuating.
Equally fluctuating will be the response
of each device detecting this radiation. In repeated measurements
of the same sample under the same conditions, we therefore
measure every time somewhat different values of
the number of pulses, which fluctuate around a certain mean
value. These are deviations that can not be eliminated
by any improvement of the device or method, these fluctuations
have their origin in the very essence of the
measured phenomena.
The influence of statistical
fluctuations on the results of radiation detection and
spectrometric measurements can be expressed in a simplified (but
apt) way by the following rule :
| If
we measure N pulses on a radiation
detector , we actually measured N ± Ö(N) pulses . |
More precisely, the standard deviation
s (also
called the root mean square deviation) of an
individual measurement is given by the square root
of the measured number of pulses N: s = ± Ö(N). This means that
when measuring repeatedly, approximately 68% of the total number
of measured values lie in the interval (N- s, N + s) , 95% of the values
lie in the interval (N- 2s, N
+ 2s) and 99% of the values in the interval
( N- 3s, 3s + N). *)
*) The probability of occurrence of a
measured value of the number of pulses is generally expressed by
the so-called Poisson law of distribution (which
is asymmetric in areas of small numbers of pulses), at higher
number of pulses it then turns into a symmetric normal
(Gaussian) distribution (Fig.2.11.1 left).
Fig.2.11.1. Left: Distribution of the
probability of occurrence of measured values of the number of
pulses according to the Gaussian normal distribution.
Right: Comparison of spectrometric
measurements at low (top) and high (bottom)
number of detected pulses.
The relative error
(coefficient of variation) of the measurement is then D = s/N = Ö(N)/N = 1/Ö(N), or x100 if we want to
express it in%. Thus, the higher the number of
pulses we measure, the lower the measurement
error - and this is also the only way to reduce
the errors caused by statistical fluctuations! If we measure 10
pulses, the error is 1/Ö(10) @ 33%, at 100 pulses the error will be 1/Ö(100) = 10%, at
1000 pulses 1/Ö(1000) @ 3%, and only when we measure 10000 pulses, the
statistical error will be only 1%: 1/Ö(104) = 1%.
Thus, the only way to reduce
statistical fluctuations is to increase the accumulated
number of pulses - the number of "useful"
photons g from which the response in the detection device arises.
Thus, at low radiation intensity or radioactivity of the measured
sample, it is necessary to increase the measurement time in order
to accumulate the number of pulses needed to achieve the required
accuracy (relative error) of the measurement.
In Fig.2.11.1 on the right is an
example of the scintillation spectrum of a 131I radioiodine sample measured by the same detector at a
maximum accumulated number of pulses N = 50 imp/cell (measuring time 5 sec. - top) and
N = 15000 imp./cell (measuring time 300
sec. - bottom) . The
difference in the quality and accuracy of the spectrum is evident
- with a low number of registered pulses, the details in the
shape of the spectrum are "drowned out" by statistical
fluctuations, while with a high number of pulses the spectrum is
"drawn" smoothly and in detail, with minimal
fluctuations. In the same way, statistical fluctuations are
manifested in all radiation measurements, eg in scintigraphic
images (Chapter 4 - Radioisotope scintigraphy).
Total measurement error
The resulting measurement error
generally consists of individual partial errors,
which can be divided into three groups :
- Random errors of a
statistical nature, which in radiation measurements
result mainly from the statistical nature of radioactive
transformations. Random errors can also originate in the instabilities
of the detection apparatus due to random external
influences, or errors and scatter in
sample preparation (such as pipetting, weighing,
homogenization, etc.).
- Systematic errors that
distort the measurement results in a very defined way and
direction. They show that we get either permanently lower
or permanently higher results than the actual value. The
cause of a systematic error can be, for example, the dead
time of the detector, leakage of the gas charge of the
ionization chamber, contamination of the detector, the
influence of temperature (eg overheating) on the response
of the device, etc. If we can find out the cause of
systematic errors, we can reduce their influence by
appropriate adjustment of measuring conditions, or make
their correction.
- Gross errors caused by eg
instrument failure, incorrect instrument setting, sample
swapping, often failure due to human factor. Gross errors
can be avoided with increased attention and careful
control of the measuring procedure.
If individual partial errors have a statistical
character, the resulting measurement error according to the laws
of mathematical statistics is given by their geometric
sum : s = (s12 + s22 + s32 +....+ sn2) 1/2 .
Vojtech Ullmann